SciELO - Scientific Electronic Library Online

 
vol.63 issue5Transparent conductive carbon nanotube filmsStudy of the critical-fields and the thermal broadening in polycrystalline Ag2FeGeSe4 semiconducting compound author indexsubject indexsearch form
Home Pagealphabetic serial listing  

Services on Demand

Journal

Article

Indicators

Related links

  • Have no similar articlesSimilars in SciELO

Share


Revista mexicana de física

Print version ISSN 0035-001X

Rev. mex. fis. vol.63 n.5 México Sep./Oct. 2017


Research

On the kinetic arrest of martensitic transformation in Ni-Mn-In melt-spun ribbons

F.M. Lino-Zapataa 

D. Ríos-Jaraa 

J.L. Sánchez Llamazaresa  * 

aInstituto Potosino de Investigación Científica y Tecnológica A.C., Camino a la Presa San José 2055 Col. Lomas 4a sección, San Luis Potosí 78216, San Luis Potosí, México.


Abstract

Kinetic arrest (KA) of martensitic transformation (MT) has been observed in as-solidified Ni52.2Mn34.3In13.5 melt-spun ribbons; a characterization by dc magnetization measurements was carried out. These alloy ribbons transform martensitically from a single austenitic (AST) parent phase with B2-type crystal structure. For an applied magnetic field μ0H of 1 T and up to 9 T, a moderate but progressive KA of the MT is observed. The metastability of the non-equilibrium field-cooled glassy state was characterized by introducing thermal and magnetic field fluctuations. It was found that the total magnetization difference (Δσ) between the zero field-cooling (ZFC) and field-cooling (FC) pathways of the temperature dependence of magnetization Δσ(T) shows irreversible and reversible components; the former decreases as the temperature decreases. After a short thermal annealing of 10 min at 1073 K AST shows a highly ordered L21-type crystal structure and the kinetic arrest of martensitic transformation is no longer observed suggesting a connection between the crystal structure order of austenite and the appearance of the kinetic arrest phenomenon.

Keywords: Ni-Mn-In ferromagnetic shape memory alloys; melt-spun ribbons; kinetic arrest of martensitic transformation

PACS: 77.80.B; 75.50Cc.

1. Introduction

In the last few years, the study of magnetic-field induced phenomena across the first-order martensitic transformation (MT) in ferromagnetic shape memory alloys of the ternary alloy systems Ni-Mn-X (X= Sn, In, Sb) has been a subject of considerable attention. Among them, the most studied are giant inverse magnetocaloric effect 1,2,3.4, magnetic shape memory effect 5.6, and magnetoresistance 7. Another field-induced effect, less common, sometimes observed in various alloys is the kinetic arrest (KA) of martensitic transformation. It was first detected by Sharma et al. in a bulk Ni50Mn34In16 alloy 8, but later it has been also observed in other Ni-rich 8,9,10.11,12,13,14.15,16,17,18.19 and Mn-rich 20,21,22 Heusler-type Ni-Mn-X (X= Sn, In, Sb) alloys. In addition, it also appears in a variety of other materials exhibiting first-order phase transitions, either alloys or oxides, such as the Laves phases Ce(Fe,X)2 (X = Al, Ru) 23,24,25,26 and HfFe227, Gd5Ge428, MnSi 29, NiCoMnAl 30, Mn2PtGa 31, Mn3GaC0.932 and phase-separated manganites 26,33,34,35. An overview about the manifestation of this phenomenon in different magnetic materials is found in Ref. 36.

In the case of Ni-rich and Mn-rich Heusler-type alloys, a volume fraction of the parent austenite phase remains frozen into the equilibrium martensitic matrix under the application of a static magnetic field of strength beyond a certain critical value when the material is cooled down below the martensitic finishing structural transition temperature M f . This mixed, or two-phase, state is metastable in nature and is commonly characterized by means of magnetization 8,9,11,25, resistivity 9, and neutron diffraction measurements 22. The relevant information provided by these experiments is found when the information obtained from the zero-field-cooled and field-cooled states in the phase coexistence region is compared. As expected, due to the higher saturation magnetization of austenite with respect to martensite (MST), the zero-field cooling (ZFC) and field-cooling (FC) (and field-heating, FH) pathways of the temperature dependence of magnetization σ(T) split in the martensite existence region 8,9,10,11,12,13,14.15,16,17,18,19,20,21,22.

Most of the studies carried out on the observation and characterization of KA phenomenon in Ni-rich and Mn-rich Heusler-type alloys have been performed in bulk alloys. In the case of melt-spun ribbons, the field-induced arrest of MT has been only reported in a few alloys such as Mn50Ni40In1020, Ni45Co5Mn38Sn1217, Ni38Co12Mn41Sn918, and Ni47Mn35Fe5In1319. However, most of these studies are limited to report its existence based on the above mentioned splitting between ZFC and FC σ(T) curves (i.e., no further characterization is presented). We have already briefly reported on the occurrence of a moderate-to-low KA of MT in melt-spun ribbons with the off-stoichiometric composition Ni52.2Mn34.3In13.540. Here we are reporting a detailed dc magnetization study of this uncommon phenomenon with emphasis on the characterization of the kinetically arrested inhomogeneous magnetic glassy (MG) state. It is also shown that it is no longer observed after a short thermal annealing at 1073 K.

2. Experimental

A bulk alloy of nominal composition Mn50Ni36In14 was prepared by arc melting in argon atmosphere from highly pure elements (Ni 99.98%, Mn 99.98%, and In 99.999%). The sample was remelted three times to ensure good starting homogeneity. Additional amount of Mn was added to compensate the loss of this element during the arc melting process in order to preserve the starting 50:36:14 composition in the resulting pellet. From this as-cast alloy, melt spun ribbons were obtained in a highly pure argon environment (99.999%) at a high tangential speed of the copper wheel of 48 ms-1 (wheel diameter: 20 cm); the process was carried out by using a homemade single-roller melt spinner apparatus. The as-cast pellet was melted by radio frequency induction heating in a quartz crucible with an orifice of 0.5 mm; the molten alloy was ejected with an Ar overpressure of 20 bar onto the polished surface of the copper wheel.

X-ray powder diffraction, differential scanning calorimetry (DSC), scanning electron microscopy (SEM), energy dispersive spectroscopy (EDS) and magnetization measurements were used to study ribbon samples. The DSC measurements were performed in a TA Instruments model Q200 under a high purity Ar flow at a heating/cooling rate of 10 Kmin-1. X-ray diffraction patterns of finely powdered ribbon samples were recorded in a Bruker D8 Advance powder diffractometer (Cu-Kα; 20θ90; step increment: 0.02°). Scanning electron microscopy (SEM) studies were performed using a FEI XL 30 SEM equipped with an energy dispersive spectroscopy (EDS) system (EDAX); the average elemental chemical composition was estimated by EDS (±0.1 in the determination of the atomic percentage). Magnetization measurements were carried out by vibrating sample magnetometry (VSM) in a Quantum Design PPMS ® EverCool®-9T platform. The magnetic field μoH was applied along the ribbon axis (i.e., the rolling direction) to minimize the effect of the internal demagnetizing field. The low-field (5 mT) and high-field (up to 9 T) magnetization as a function of temperature σ(T) curves were measured between 10 and 350 K. First, the sample was cooled from room temperature under zero applied magnetic field (ZFC process) to 10 K (the initial measuring temperature); then, the magnetic field is applied and the magnetization is measured while increasing the temperature up to 350 K; once the last point is measured, the sample is cooled back to the lowest temperature keeping the static field (FC process); finally, the magnetization was measured again by increasing the temperature (FH process). As the non-equilibrium field-cooled state at a given T is affected by the temperature-sweeping rate 25, in all the experiments this parameter was set at 1.0 Kmin-1. Accordingly, this criterion was not only followed to record σ(T) curves, but also to reach any temperature at which a magnetization measurement versus field or time is performed or initiated.

3. Results and discussions

The room temperature XRD pattern of powdered as-solidified ribbons is shown in Fig. 1(a). All the diffraction peaks were satisfactorily indexed on the basis of a B2-type crystal structure with a lattice parameter of 0.299(3) nm. The crystallization of AST in this crystal structure, instead of the highly ordered L21-type structure, has been frequently reported in as-solidified Ni-Mn-In alloy ribbons with similar composition and results from the high cooling rate during solidification 41,42. The inset in Fig. 1(a) shows the typical cross sectional microstructure of ribbons. Their average thickness is ~ 9 - 12 μm, while the microstructure consists of well-formed columnar grains growing along the entire ribbon thickness. After more than 30 EDS analyses performed on both ribbon surfaces and the cross section at different ribbon regions, the average elemental chemical composition was determined as Ni52.2Mn34.3In13.5 (that slightly differs from the the nominal one Ni50Mn34In16). The difference is attributed to both the Mn loss by evaporation and the surface chemical reaction of the molten alloy with the quartz crucible in the melt spinner system. The inset in Fig. 1(b) shows the heating/cooling DSC scans along with the FH and FC σ(T) curves measured under a low static magnetic field of 5mT (referred to as σ(T)5mT). From these two curves we estimated by simple extrapolation the characteristic starting and finishing temperatures of the direct and reverse martensitic transformation (referred to as M S , M f , A S and A f , respectively) and from the minimum in the dσ/dT vs T curve the magnetic transitions of AST (Curie temperature) and MST, referred to as TCA and TCM, respectively. The values determined from the DSC [σ(T) 5 mT] curves were: M S = 281 (275) K, M f = 255 (264) K, A S = 267 (271) K and A f = 290 (279) K, whereas TCA=285 K and TCM=257 K. It can be noted in the σ(T)5mT curves (Fig. 1) that the transformation to martensite during FC extends over a long interval in the low temperatures range, indicating that energetically some volume fraction of martensite has difficulties to grow into the remaining austenite parent phase.

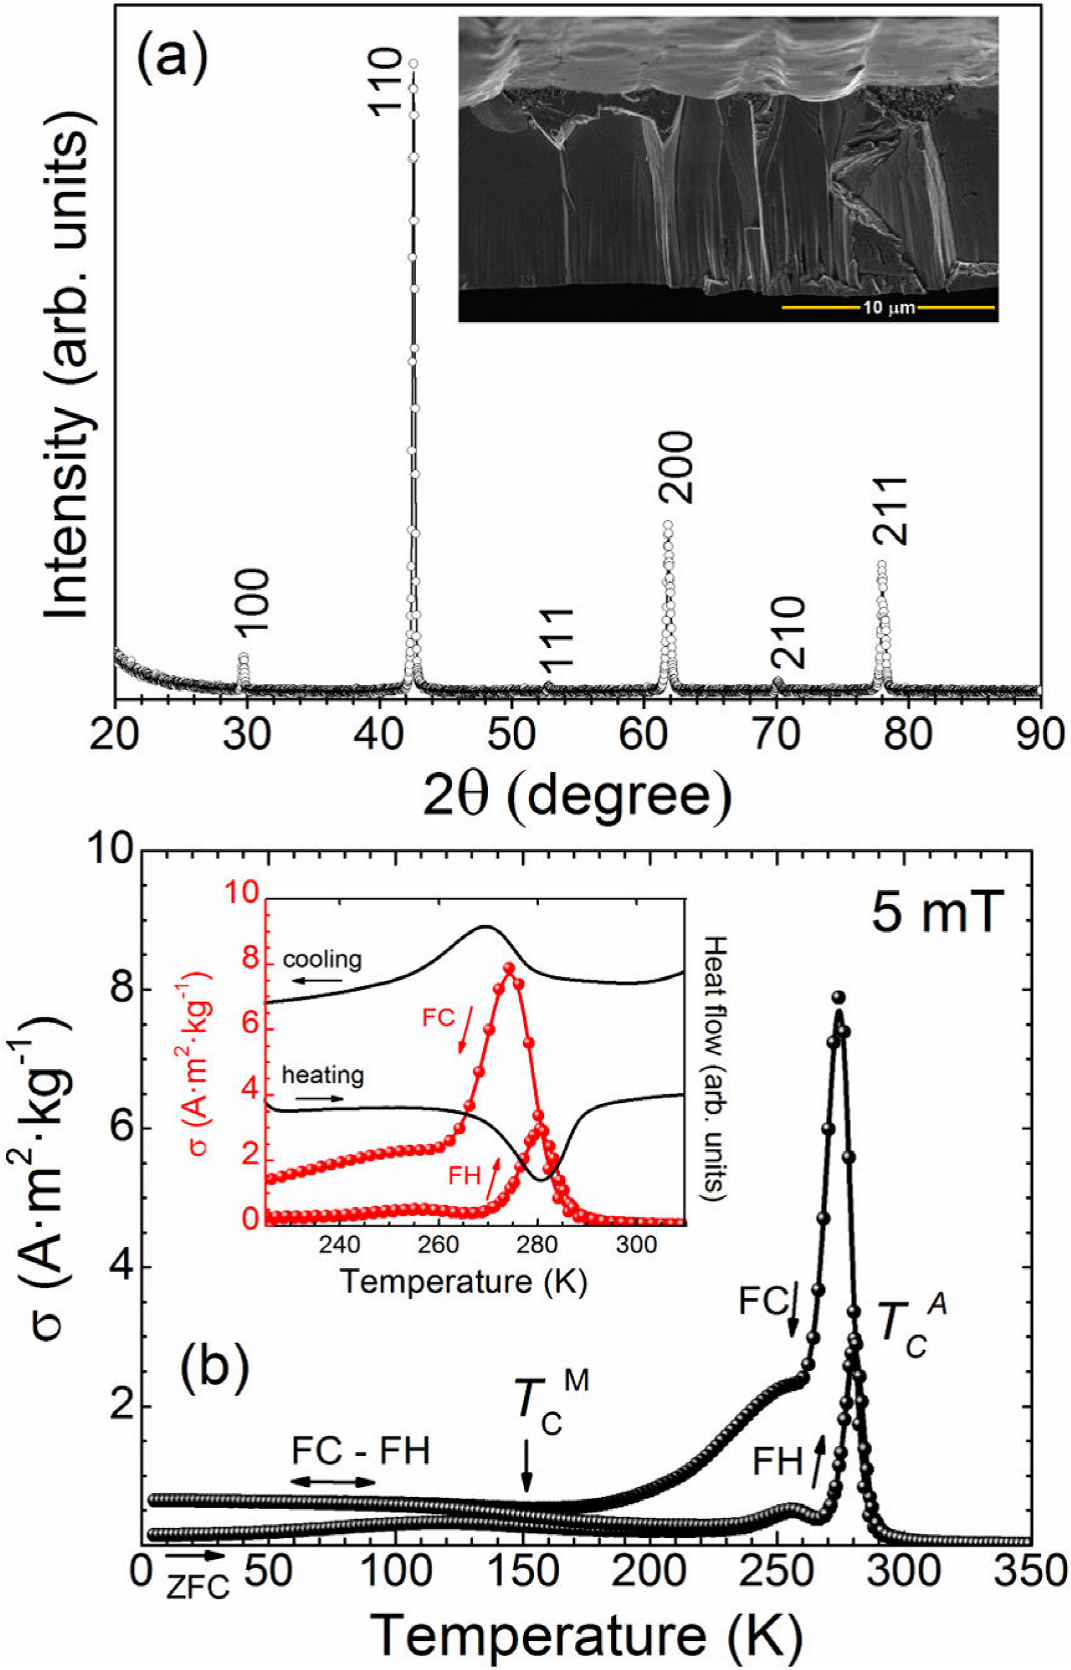
Figure 1 Room temperature XRD pattern (a) and ZFC, FC and FH σ(T) curves at 5 mT (b) for as-solidified ribbon samples. The insets in (a) and (b) show the typical cross section microstructure and the σ(T) curves (red dots) and DSC scans (black line) in the structural transition region. 

The temperature dependencies of the magnetization σ(T) under different applied static magnetic fields, ranging from 1 to 9 T, are shown in Fig. 2. The atypical behavior observed in the graphs, which reflects the kinetic arrest of the martensitic transformation, is the magnetization difference between the ZFC and FC (or FH) pathways in the martensitic existence region (hereafter referred to as ΔσFC-ZFC). The inset in Fig. 2(b) zooms into ΔσFC-ZFC for the σ(T) curves measured at 9 T. When the temperature decreases, a volume fraction of AST does not transform into MST but remains untransformed (i.e., “frozen”) within the equilibrium martensitic matrix due to the presence of the applied magnetic field. Hence, the KA of MT gives rise to a magnetically inhomogeneous system in which both MST and AST phases coexist. The resulting FC state should be metastable in nature, and therefore if energy fluctuations are introduced by cycling the magnetic field or the temperature, the system should tend to the ZFC equilibrium state. In the present alloy, the KA of MT was detected for magnetic field values above 1 T. The field dependence of ΔσFC-ZFC measured at different temperatures in the martensitic existence region up to a maximum magnetic field of 9 T is shown in Fig. 3(a). Roughly speaking, the fraction of AST arrested into the martensitic matrix must be proportional to ΔσFC-ZFC and, as the figure shows it increases almost linearly with the magnetic field strength.

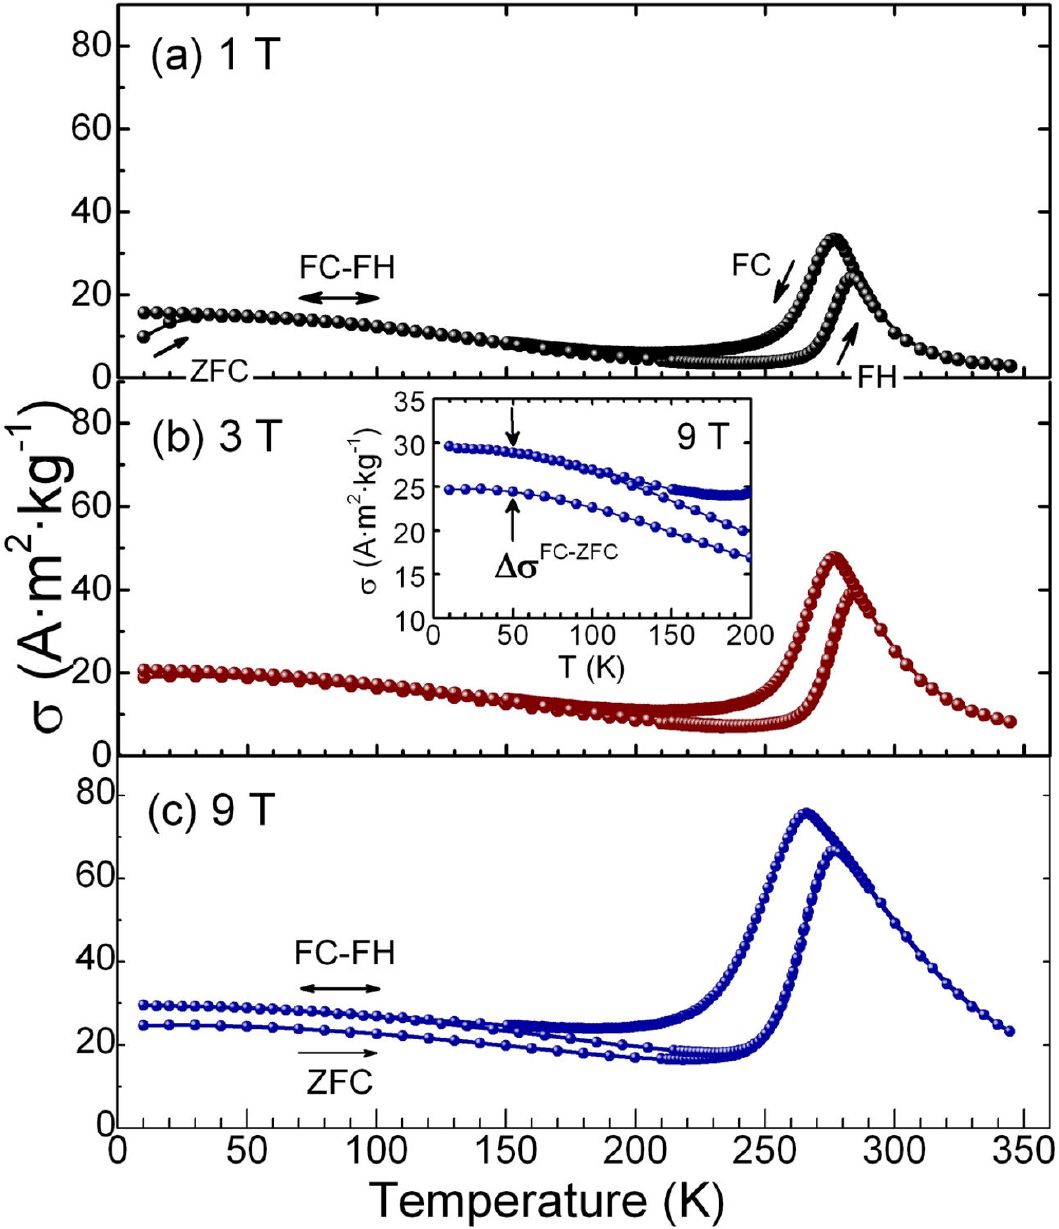
Figure 2. σ(T) curves measured in FH, FC and ZFC regimes under static magnetics fields of: 1 T (a), 3 T (b), and 9 T (c). Inset in (c): zoom into the σ(T) curve at 9 T in the martensitic region to show the magnetization difference
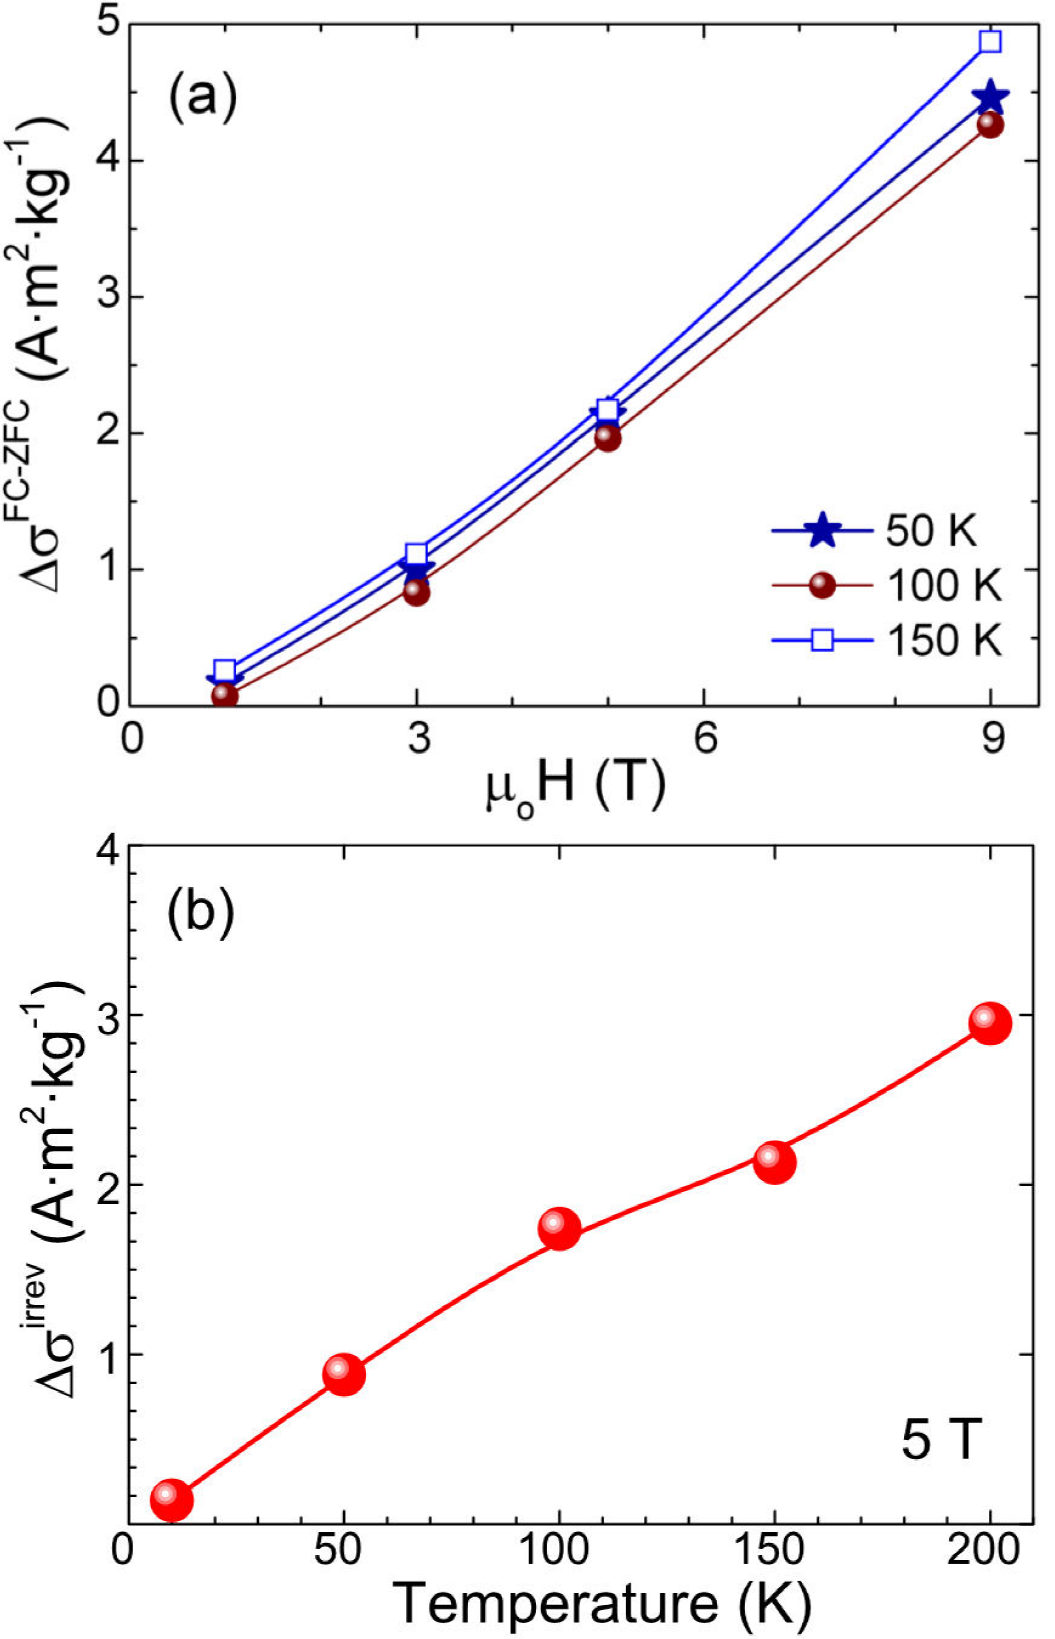
 ΔσFC-ZFC between the ZFC and FC pathways of the curve. 

Figure 3.  ΔσFC-ZFC as a function of the magnetic field at different temperatures in the martensitic region (50, 100 and 150 K). (b) Temperature dependence of the irreversible magnetization change Δσirrev at μoH=5 T for different temperatures in the martensitic existence region. 

To characterize the metastable nature of the FC inhomogeneous state, different magnetization experiments were performed in the martensitic existence region under an applied magnetic field of 5 T. In the first one, thermal energy fluctuations were introduced through successive thermal cycling. From 350 to 10 K the sample follows the FC regimen under a large magnetic field of 5 T. Then, the temperature was increased from 10 K to successively increasing maximum temperatures T max of 50 K, 100 K, and 150 K, after the sample reaches the respective T max, temperature is decreased to 10 K (the magnetic moment as a function of T is continuously measured along all these increasing and decreasing pathways). The measured σ(T)5T curves following this procedure are plotted in Fig. 4(a); they are referred as s1 (red circles), s2 (black squares), and s3 (green triangles), respectively. The inset in Fig. 4(a) zooms into the low temperature region to show the decreasing behavior of σ(T)5T. The metastable character of the FC state is manifested by the magnetization decrement after successive temperature cycling since the thermal fluctuations gradually transform a small fraction of AST into MST, indicating that the system tends to the ZFC equilibrium state 10,14. On a second test, we started with the sample in ZFC state and follow the same described procedure (a thermal cycling procedure at 5 T to introduce thermal energy fluctuations). It can be observed in Fig. 4(b) that thermal energy fluctuations gradually increase the magnetization after each cycle. The inset in Fig. 4(b) zooms into the low temperature region to underline the effect. It is well known that in both martensite and austenite antiferromagnetic (AFM) and FM coupling between Mn magnetic moments coexists 43. The introduction of thermal energy fluctuations leads to the metastable coupling of AFM moments with the applied magnetic field during the cooling process originating the observed magnetization increase. Thus, FC and ZFC methods lead to opposite behaviors underlying the metastable nature of the FC state.

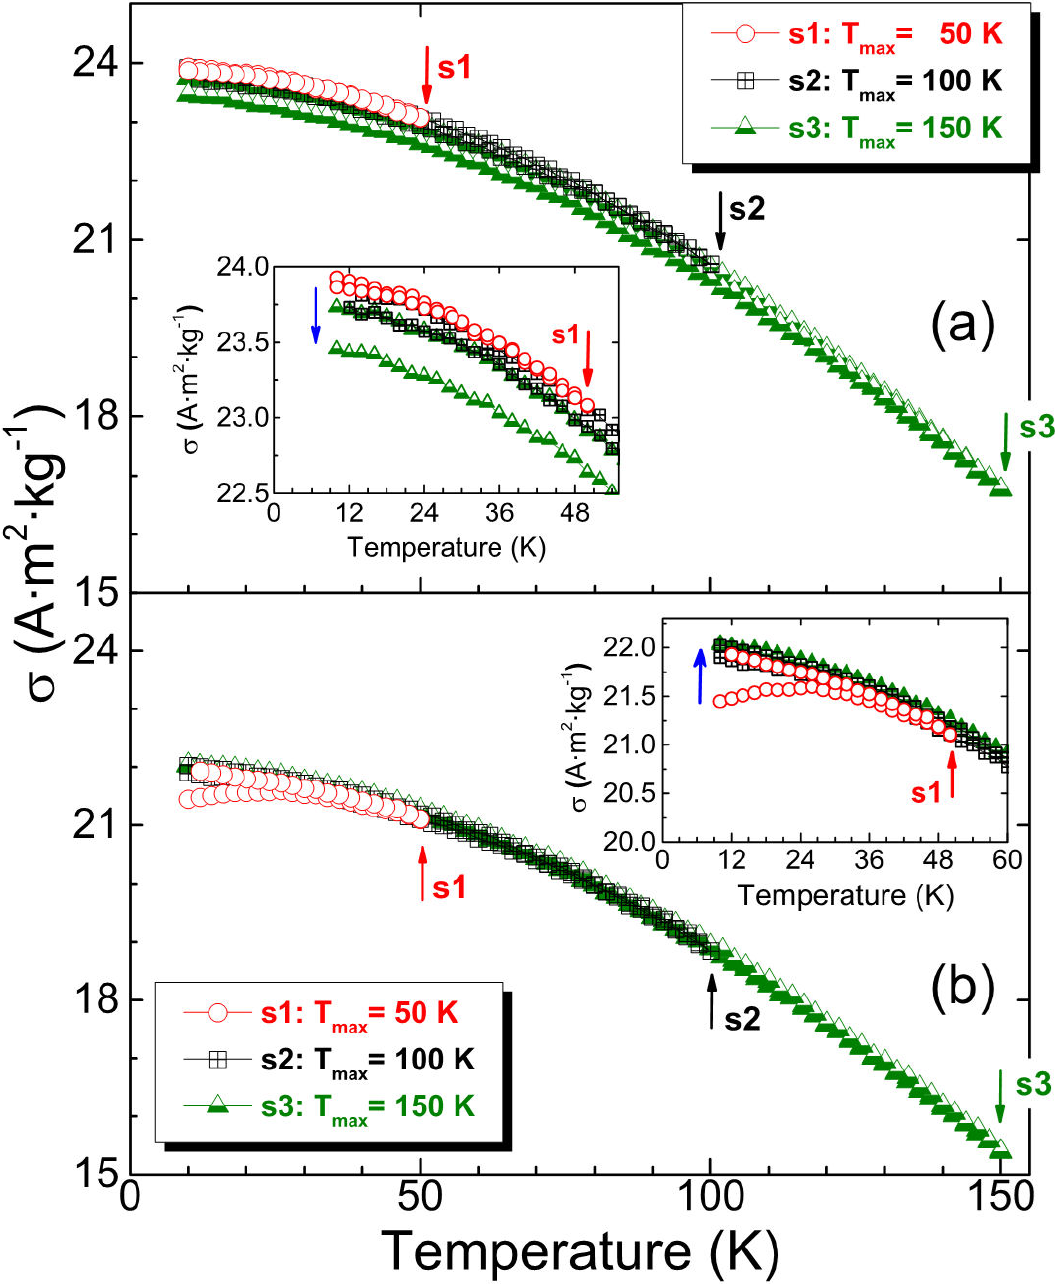
Figure 4. (a) Effect of the successive thermal cycling between 10 K and T max (for T max = 50 K, 100 K, and 150 K) on the σ(T) curve at μoH = 5 T after field-cooling (a), and zero field-cooling (b), from 350 K. Insets: zooms into the low temperature region of the curves. 

In a second experiment, the temperature was fixed at five selected values (referred to as T meas), namely 10 K, 50 K, 100 K, 150 K and 200 K, and two different thermal protocols, FC and ZFC, were followed to reach these temperatures; then, the σ(μoH) curves were measured. The purpose of this experiment was to determine if removing the magnetic field the frozen volume fraction of AST undergoes reversible and irreversible transformation into MST; this is another way to get insight on the characteristics of the metastable nature of the FC inhomogeneous two-phase state. So, in the FC protocol the temperature was decreased under the 5 T applied magnetic field to reach Tmeas and the so-called thermo-remanent (TR) demagnetization curve σ(μoH)TR-1 was measured (i.e., the magnetic field is removed while measuring σ(μoH)); afterwards σ(μoH) is subsequently measured by applying and removing the magnetic field. In the ZFC protocol the temperature is lowered at zero field to reach Tmeas and σ(μoH) is measured while applying and removing the magnetic field. Figure 5(a) and (b) compares the thermo-remanent demagnetization isotherms σ(μoH)TR-1 at 50 and 150 K which were followed by field-up and field-down isotherms (numbered in the figure as 2 and 3 or σ(μoH)TR-2 and σ(μoH)TR-3, respectively). For the sake of comparison, the magnetization isotherms measured from the thermally demagnetized state while increasing and decreasing the field (denoted as σ(μoH)ZFC; red stars) are also plotted. Note the difference between σ(μoH)TR-1 and σ(μoH)ZFC at μoHmax=5 T for the two T meas reported in the graph (which is better displayed in their zooming insets). This difference results from the metastable nature of the FC inhomogeneous state and it has the same origin than the splitting between ZFC and FC σ(T) curves. Similarly, it must be also noted the coincidence of σ(μoH)TR-2 and σ(μoH)ZFC at 200 K which suggest that the frozen fraction of AST fully transforms into MST when the applied magnetic field is removed, as previously reported for bulk Ni50Mn36In148 and melt spun Mn50Ni40In10 alloys 20. In contrast, the nearly complete overlap of σ(μoH)TR-1 and σ(μoH)TR-2 at 10 K implies that after the applied magnetic field is removed the volume fraction of AST frozen into the MST phase remains virtually untransformed. Thus, the magnetization change shows reversible Δσ(μoH)rev and irreversible components Δσ(μoH)irrev that are related to the conversion of AST into MST when the magnetic field is removed, as it is clearly show in the right insets of Fig. 5; here, the measured difference Δσirrev (i.e., σ(μoH)TR-1-σ(μoH)TR-2) is also shown, while Fig. 3(b) shows its temperature dependence.

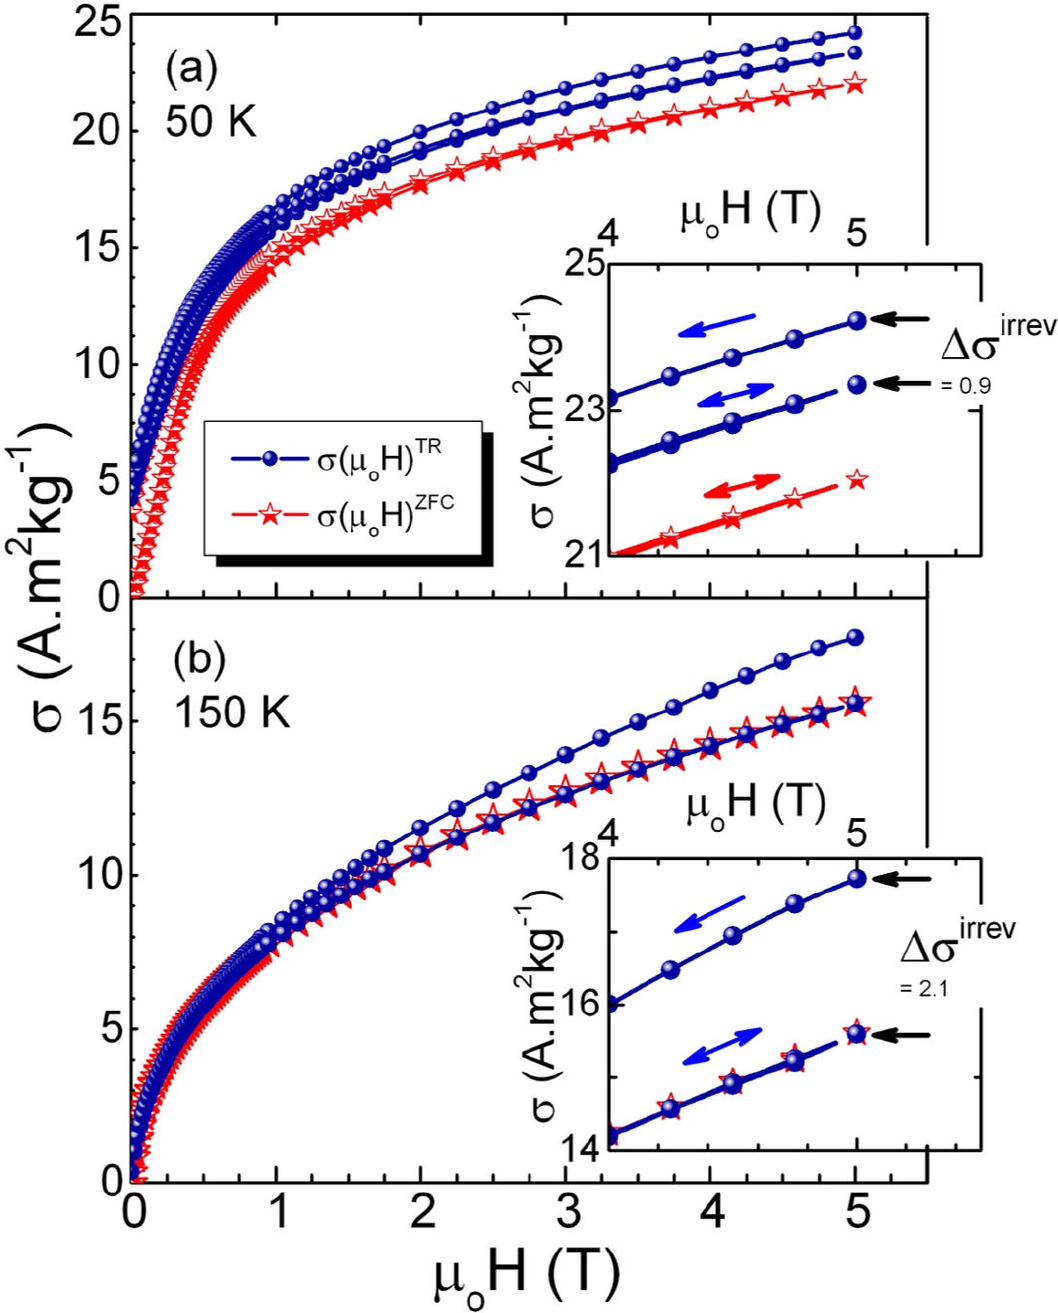
Figure 5 Demagnetization thermo-remanent curve σ(μoH)TR followed by the subsequent field-up and field-down σ(μoH) curves (blue circles), measured at T meas = 50 K and 150 K. For the sake of comparison, the magnetization curves for both increasing and decreasing the magnetic field measured from the demagnetized state σ(μoH)ZFC are also plotted (red stars). Insets: zoom into the highfield region of the curves to indicate the irreversible magnetization change ΔσμoHirrev (the value given is in Am2kg-1). Arrows indicate whether the magnetic field is being increased or decreased. 

The dynamical behavior of this non-equilibrium magnetic state, or magnetic glassy state, is very similar to that of a structural glass 44. The relaxation of magnetization in the FC kinetically arrested state is another phenomenon that characterizes the metastable nature of the magnetic glassy state 45. For this state, the normalized magnetization as a function of time σ/σ0(t) at a fixed magnetic field value follows a Kohlrausch-Williams-Watts (KWW) stretched exponential function Φexp-(t/τ)β, where τ is a characteristic relaxation time and β a shape parameter 8. β accounts for the number of intermediate states through which the system evolves and for different magnetic disordered systems its value lies between 0 and 1 35,46. In a third experiment, we measured the σ/σ0(t) curves at different temperatures (indicated in Fig. 6(a) by the vertical bars); σ was normalized to its zero-time value. Each temperature was reached following the same thermomagnetic protocol: cooling at a rate of 1 Kmin-1 from 350 K under a static field of 5 T. The experimental relaxation curves measured are shown in Fig. 6(b). Two of them, namely those at 250 and 235 K, show a considerable exponential-like magnetization reduction since they are in the temperature range of the martensitic phase transition where the system becomes highly metastable because of the nucleation and growth of the equilibrium MST phase. This is in contrast with the drastic decrease in the relaxation rate observed for the curves measured at 150 K and below (i.e., below M f ). These curves can be fitted assuming a KWW stretched exponential function. As an example, the inset in Fig. 6 shows the fitting for the relaxation curve at 10 K; the obtained values for the exponent β was 0.95. This value is close to 1 indicating that the system is weakly metastable.

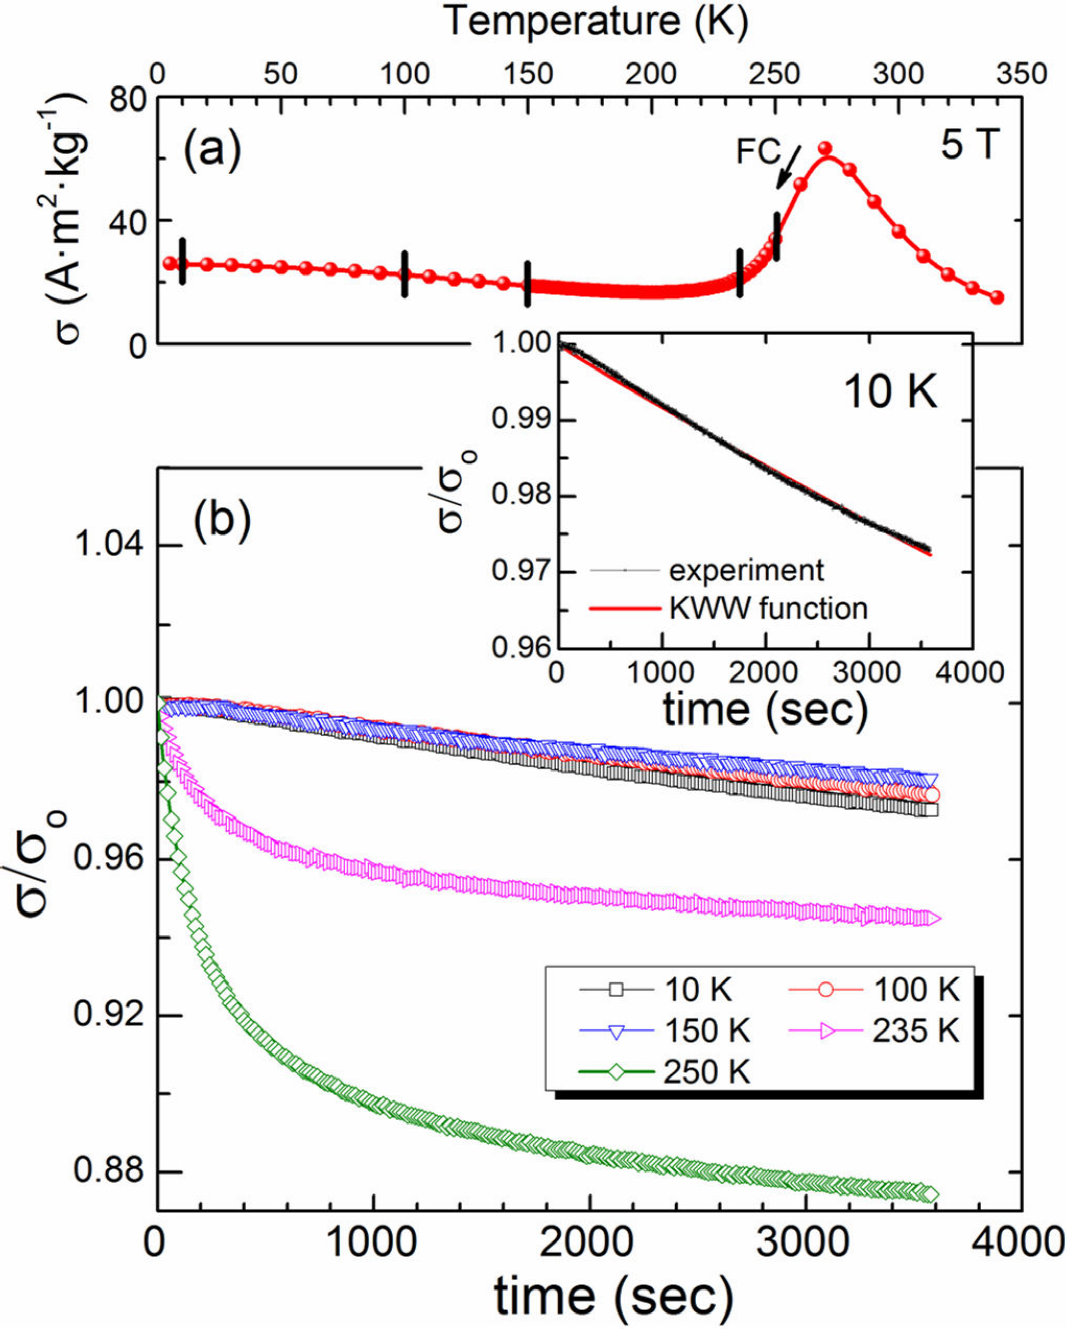
Figure 6. (a) FC pathway of the σ(T) curve measured at 5 T; the vertical bars indicate the temperatures at which the relaxation curves shown in (b) were measured. (b) Normalized magnetization σ/σ 0 versus time plots measured at 5 T and temperatures of 250, 235, 150, 100 and 10 K. Inset: experimental σ/σ 0(t) curve measured at 10 K and its fitting (solid red line) to a KWW stretched exponential function with a β value of 0.95. 

The as-solidified ribbon samples were thermally annealed in vacuum at 1073 K during a short time interval of 10 min. For melt-spun ribbons obtained at high quenghing rates, this process is usually addressed to modify the structural disorder induced by the fast extraction of thermal energy during rapid solidification that in crystalline materials leads to structural deviations from equilibrium 41,42. However, it is unable to change the relevant microstructural features, such as grain morphology, grain orientation and average grain size owing to the short annealing time and the relatively low diffusion rate. In (Ni,Mn)-based Heusler type melt-spun ribbons the annealing improves the chemical and crystallographic order resulting in: (a) an increased saturation magnetization of both AST and MST phases; (b) a shift of the structural and magnetic phase transition temperatures, and; (c) a more abrupt magnetization change across the structural and magnetic transitions and a change in the crystal structure of AST 41,42. The room temperature XRD pattern measured on powdered annealed ribbons is presented in Fig. 7(a). The diffraction peaks were satisfactorily indexed on the basis of a highly ordered L21-type crystal structure with a lattice parameter of 0.599(6) nm. The crystallization of AST in this crystal structure is observed in bulk and melt-spun ribbons after a long annealing time 41,42,47. The inset in Fig. 7(a) shows that the typical cross sectional microstructure remains unchanged. The average elemental chemical composition determined by EDS slightly shifts to Ni51.5Mn33.5In15. Figure 7(b) shows both the DSC scans and the ZFC and FC σ(T) curves measured under a low static magnetic field of 5 mT; the values determined for the starting and finishing structural transition temperatures and the magnetic transition temperatures were: M S = 287 (289) K, M f = 274 (278) K, A S = 287 (291) K and A f = 303 (297) K, whereas TCA=302 K and TCM=184 K. The ZFC, FC and FH σ(T) at 5 T and 9 T for both as-quenched and annealed ribbons are compared in Fig. 8(a) and (b), respectively. It must be noted that in the annealed sample the MT is not kinetically arrested by the presence of the applied magnetic field and the main difference with respect to as-solidified ribbons lies in the different structural and chemical order.

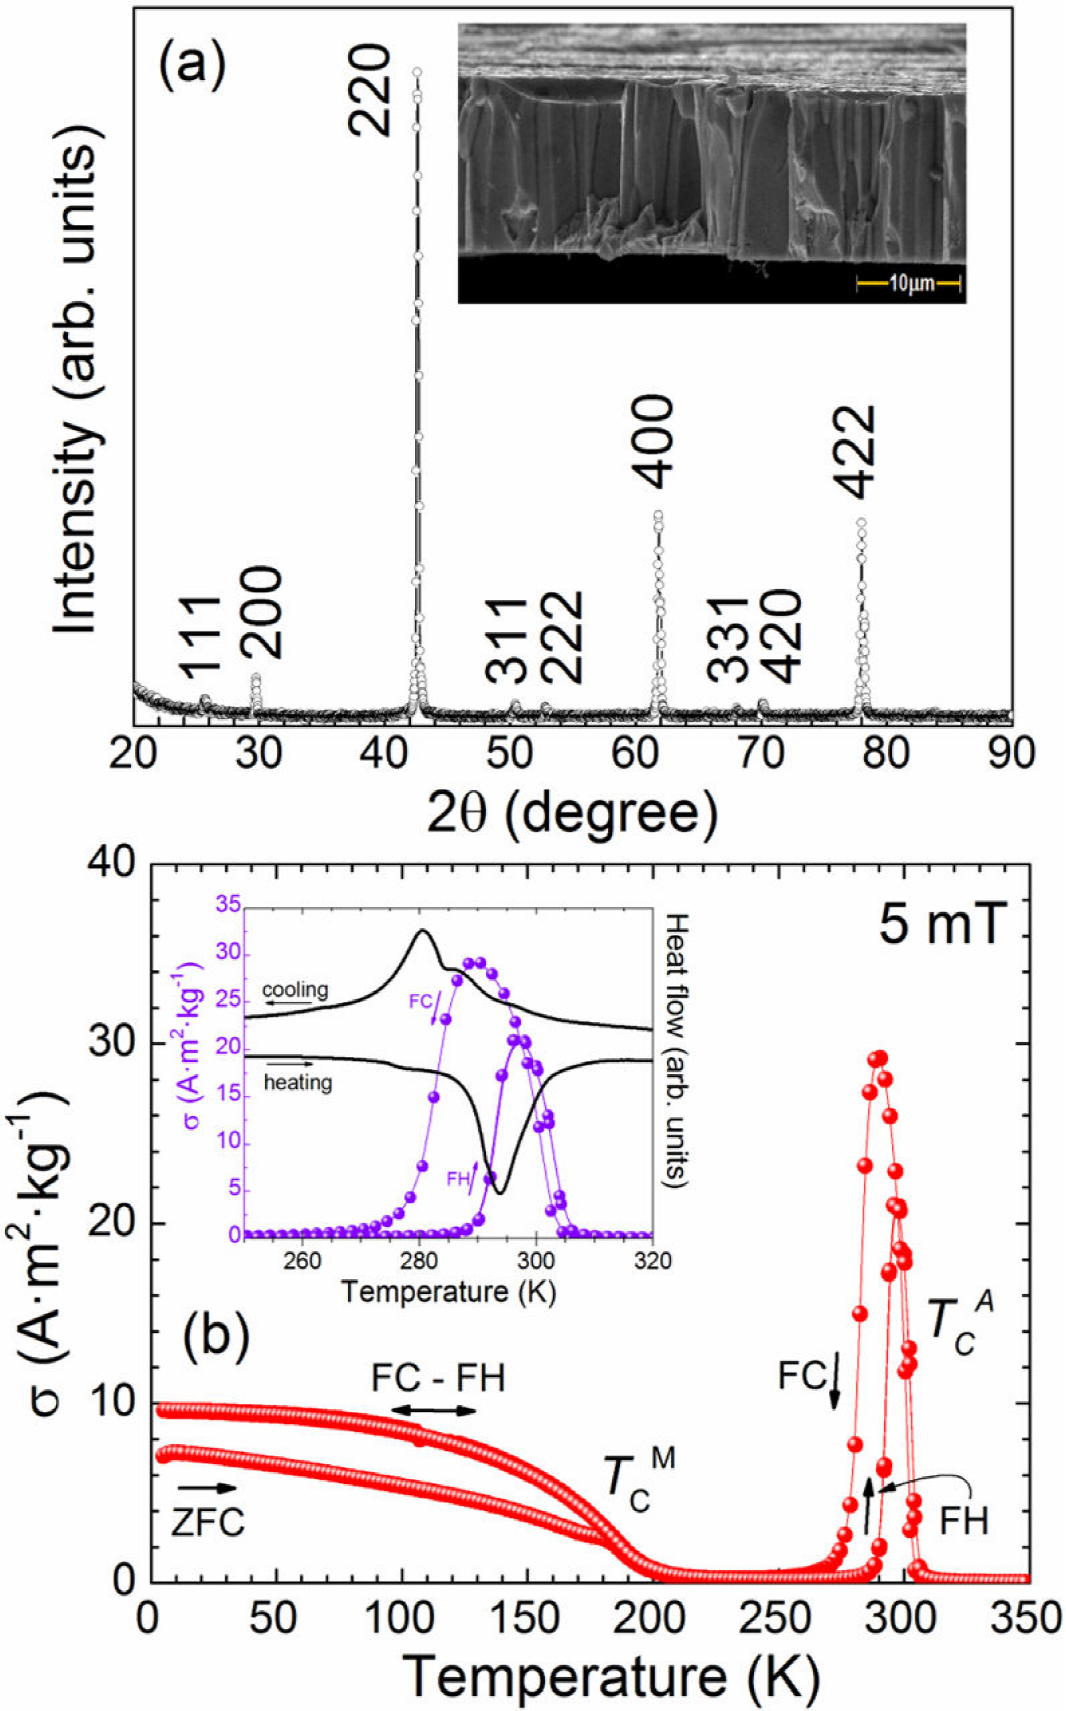
Figure 7. Room temperature XRD pattern (a) and heating and cooling σ(T)5mT curves (red dots) and DSC scans (black line) (b) for annealed ribbon samples. Inset in (a): typical cross section microstructure. 

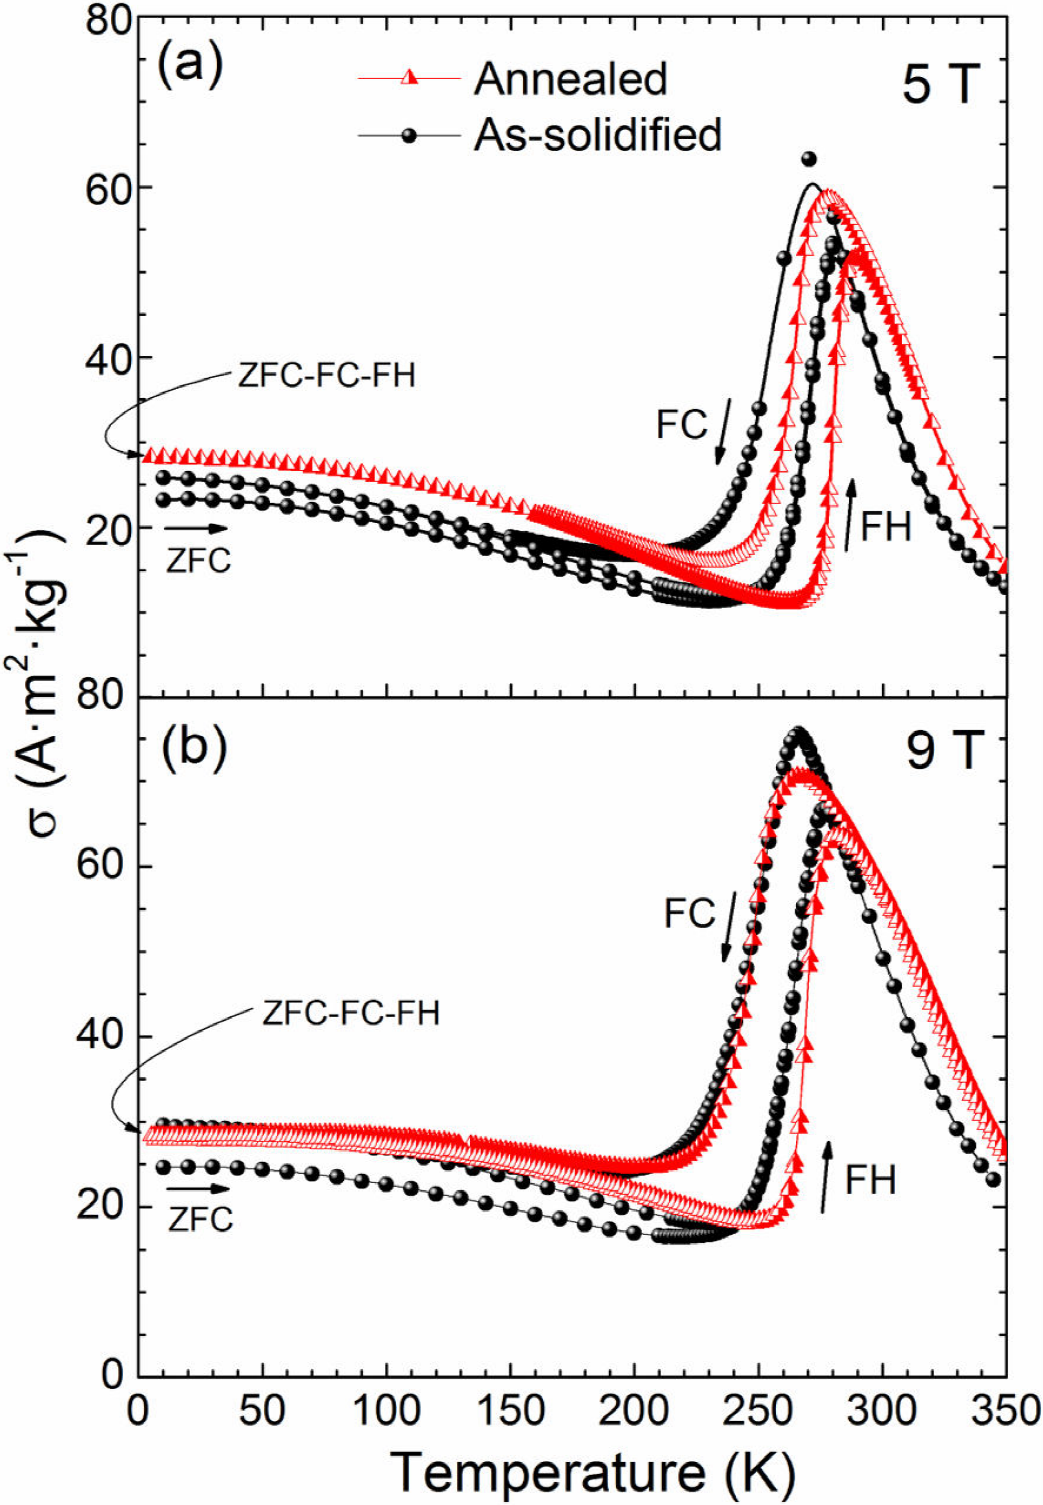
Figure 8. Comparison of the ZFC, FC, and FH σ(T) curves measured under static magnetic field of 5 T (b) and 9 T (b) for assolidified (black circles) and annealed (red triangles) ribbon samples. 

The observed increase in the structural phase transition temperatures for annealed ribbons caused by the crystal and chemical change suggests that martensite is more stable than in as-solidified samples. Comparing the low-field thermomagnetic curves of Figs. 1(b) and 7(b), one can notice that, in contrast with the observed for the as-solidified sample, no delay in temperature for the MT. Besides, the increased thermal hysteresis of the transformation (determined as ΔThyst=Af-MS) in the annealed with respect to the as-solidified one, estimated as 12 and 18 K, respectively, indicates the more thermoelastic nature of the MT in the annealed sample (i.e., the driving force for the transformation is lower) and, again, that martensite is more stable than in the as-solidified samples. This suggests that the improved structural and chemical order change attained upon the B2 L21 ordering transition increases the mobility of the interfaces between AST and MST (habit plane) allowing the martensite plates grow in a more favorable energy environment. In the as-solidified samples with B2 order, the mobility of the interfaces should be lower giving rise to kinetic arrest of the MT (as observed in Co-containing Ni-Mn-In alloys 48).

At last, the possible formation mechanism of the retained AST into the martensitic matrix in Ni-Mn-In and Ni-Mn-Co-In melt-spun ribbons alloys has been recently explored by in-situ observations using optical microscopy and EBDS orientation maps of the microstructure 49; the author found that large lattice discontinuities between AST and MST (which are indirectly related to the lattice parameters of both phases), play an important role in the occurrence of this phenomenon. The difference is larger for Co-doped quaternary alloys than in Ni-Mn-In; this could explain why larger, or total, KA at a lower applied magnetic field has been reported for the former 9,14,48. Our results suggest a reduction of lattice discontinuity between both phases when the parent phase shows the L21-type crystal structure.

4. Conclusions

We have performed a dc magnetization study of the partial kinetic arrest of martensitic transformation found in as-solidified Ni52.2Mn34.3In13.5 melt-spun ribbons. The effect is observed for a magnetic field above 1 T and the volume fraction of B2 austenite frozen into the martensitic matrix is proportional to the applied magnetic field strength.

The metastable character of the non-equilibrium field-cooled magnetic glassy state was revealed by the decreasing behavior of magnetization over temperature cycling and time dependence. The magnetization change determined from the thermo-remnant and zero-field cooled magnetization isotherm measured at a given temperature shows irreversible and reversible components; the former decreases as the temperature decreases. This is in contrast with that observed in other alloys that exhibit this abnormal phenomenon such as Ni50Mn34In16 and Mn50Ni40In10 for which the fraction of AST frozen into the MST matrix is entirely metastable. This arrested metastable state was no longer observed in the thermally annealed samples because of an increase in the stability of martensite in the new L21 austenitic matrix.

Acknowledgments

Present investigation was financially supported by CONACYT, Mexico, under grant CB-2012-01-183770. The authors also acknowledge the support received from Laboratorio Nacional de Investigaciones en Nanociencias y Nanotecnología (LINAN, IPICyT). F.M. Lino-Zapata is grateful to CONACYT for supporting his Ph.D. studies. The technical support received from Dr. Gladis Labrada and M.Sc. B.A. Rivera-Escoto is gratefully acknowledged.

References

1. T. Krenke, E. Duman, M. Acet, E.F. Wassermann, X. Moya, and L. Mañosa, Nat. Mater. 4 (2005) 450. [ Links ]

2. A.K. Pathak, I. Dubenko, H.E. Karaca, S. Stadler, and N. Ali, Appl. Phys. Lett. 97 (2010) 062505. [ Links ]

3. J. Liu, T. Gottschall, K.P. Skokov, J.D. Moore, and O. Gutfleisch, Nat. Mater. 11 (2012) 620. [ Links ]

4. T. Gottschall , K.P. Skokov , B. Frincu, and O. Gutfleisch , Appl. Phys. Lett. 106 (2015) 021901. [ Links ]

5. R. Kainuma et al., Appl. Phys. Lett. 88 (2006) 192513. [ Links ]

6. R. Kainuma et al., Nature (London ). 439 (2006) 957. [ Links ]

7. V.K. Sharma, M.K. Chattopadhyay, K.H.B. Shaeb, A. Chouhan, and S.B. Roy, Appl. Phys. Lett. 89 (2006) 222509. [ Links ]

8. V.K. Sharma , M. Chattopadhyay, and S.B. Roy , Phys. Rev. B. 76 (2007) 140401. [ Links ]

9. W. Ito et al., Appl. Phys. Lett. 92 (2008) 021908. [ Links ]

10. V.K. Sharma et al., J. Phys. Cond. Mater. 22 (2010) 486007. [ Links ]

11. W. Ito, R.Y. Umetsu, R. Kainuma, T. Kakeshita, and K. Ishida, Scripta Mater. 63 (2010) 73. [ Links ]

12. Y. Lee, M. Todai, T. Okuyama, T. Fukuda, T. Kakeshita , and R. Kainuma , Scripta Mater. 64 (2011) 927. [ Links ]

13. A.K. Nayak, K.G. Suresh, and A.K. Nigam, J. Phys. Cond. Mater. 23 (2011) 416004. [ Links ]

14. R.Y. Umetsu et al., J. Alloys Compd. 509 (2011) 1389. [ Links ]

15. M.K. Chattopadhyay et al., J. Appl. Phys. 111 (2012) 053908. [ Links ]

16. A. Lakhani, A. Banerjee, P. Chaddah, X. Chen, and R.V. Ramanujan, J. Phys. Cond. Mater. 24 (2012) 386004. [ Links ]

17. A. Banerjee , S. Dash, A. Lakhani , P. Chaddah , X. Chen , and R.V. Ramanujan , Solid State Commun. 151 (2011) 971. [ Links ]

18. F. Chen, Y.X. Tong, Y.J. Huang, B. Tian, L. Li, and Y.F. Zheng, Intermetallics 36 (2013) 81. [ Links ]

19. D.M. Raj Kumar et al., Def. Sci. J.: 66 (2016) 403. [ Links ]

20. J.L. Sánchez Llamazares, B. Hernando, J.J. Sunñol, C. García, and C.A. Ross, J. Appl. Phys. 107 (2010) 09A956. [ Links ]

21. X. Xu, W. Ito , R.Y. Umetsu , K. Koyama, R. Kainuma , and K. Ishida , Mater. Trans. 51 (2010) 469. [ Links ]

22. V. Siruguri et al., J. Phys. Cond. Mater. 25 (2013) 496011. [ Links ]

23. M.A. Manekar, S. Chaudhary, M.K. Chattopadhyay , K.J. Singh, S.B. Roy , and P. Chaddah , Phys. Rev. B. 64 (2001) 104416. [ Links ]

24. S.B. Roy et al., Phys. Rev. Lett. 92 (2004) 14. [ Links ]

25. M. Chattopadhyay, S. Roy, and P. Chaddah , Phys. Rev. B. 72 (2005) 180401. [ Links ]

26. K. Kumar et al., Phys. Rev. B. 73 (2006) 184435. [ Links ]

27. R. Rawat, P. Chaddah , P. Bag, P.D. Babu, and V. Siruguri, J. Phys. Cond. Mater. 25 (2013) 066011. [ Links ]

28. S.B. Roy et al., Phys. Rev. B. 74 (2006) 012403. [ Links ]

29. S.B. Roy , and M.K. Chattopadhyay , Europhys. Lett. 79 (2007) 47007. [ Links ]

30. X. Xu , W. Ito , M. Tokunaga, R.Y. Umetsu , R. Kainuma , and K. Ishida , Mater. Trans. 51 (2010) 1357. [ Links ]

31. A.K. Nayak , M. Nicklas, C. Shekhar, C. Felser, J. Appl. Phys. 113 (2013) 17E308. [ Links ]

32. Ö. Çakir, M. Acet , M. Farle, E. Dias, and K. Priolkar, J. Magn. Magn. Mater. 390 (2015) 96. [ Links ]

33. R. Rawat , K. Mukherjee, K. Kumar, A. Banerjee , and P. Chaddah , J. Phys. Cond. Mater. 19 (2007) 256211. [ Links ]

34. A. Banerjee , A.K. Pramanik, K. Kumar , and P. Chaddah , J.: Phys. Cond. Mater. 18 (2006) L605. [ Links ]

35. S. Chatterjee, S. Giri, and S. Majumdar, J. Phys. Cond. Mater. 24 (2012) 366001. [ Links ]

36. S.B. Roy , J. Phys. Cond. Mater. 25 (2013) 183201. [ Links ]

37. B. Hernando et al., J. Magn. Magn. Mater. 321 (2009) 763. [ Links ]

38. E.J. Lavernia, and T.S. Srivatsan, J. Mater Sci. 45 (2010) 287. [ Links ]

39. B. Cantor, W.T. Kim, B.P. Bewlay, and A.G. Gillen, J. Mater. Sci. 26 (1991) 1266. [ Links ]

40. F.M. Lino-Zapata, J.L. Sánchez Llamazares , D. Ríos-Jara, A.G. Lara-Rodríguez, and T. García-Fernández, Mater. Res. Soc. Symp. Proc. 1485 (2013) 149. [ Links ]

41. T. Sánchez et al., Mater. Sci. Forum. 635 (2009) 81. [ Links ]

42. J.L. Sánchez Llamazares , H. Flores-Zunñiga, C. Sánchez-Valdés, C.A. Ross , and C. García , J. Appl. Phys. 111 (2012) 07A932. [ Links ]

43. T. Krenke , M. Acet , E.F. Wassermann , X. Moya , L. Mañosa , and A. Planes, Phys. Rev. B. 73 (2006) 174413. [ Links ]

44. P.G. Debenedetti, and F.H. Stillinger, Nature 410 (2001) 259. [ Links ]

45. S.B. Roy , and M.K. Chattopadhyay , Phys. Rev. B. 79 (2009) 052407. [ Links ]

46. X. Du, G. Li, E.Y. Andrei, M. Greenblatt, and P. Shuk, Nat. Phys. 3 (2007) 111. [ Links ]

47. J.L. Sánchez Llamazares , A. Quintana-Nedelcos, D. Ríos-Jara , C.F. Sánchez-Valdes, C. García , and T. García-Fernández , J. Magn. Magn. Mater. 401 (2016) 38. [ Links ]

48. W. Ito , M. Nagasako, R.Y. Umetsu , R. Kainuma , T. Kanomata, and K. Ishida , Appl. Phys. Lett. 93 (2008) 232503. [ Links ]

49. Haile Yan, Crystal structure, martensitic transformation crystallography, mechanical and magnetocaloric performance of Ni(Co)MnIn multifunctional alloy, Ph.D. Thesis, Université of Lorraine, France, (September 29 2016). [ Links ]

Received: December 09, 2016; Accepted: June 15, 2017

*Tel.: +52 444 8342000. e-mail: jose.sanchez@ipicyt.edu.mx

Creative Commons License This is an open-access article distributed under the terms of the Creative Commons Attribution License