


 nueva página del texto (beta)
 Inglés (pdf)
 Artículo en XML
 Referencias del artículo
 Enviar artículo por email
 Citado por SciELO
  Similares en
SciELO
Similares en
SciELO 
 Permalink
PACS: 81.07.Nb; 81.07.Wx; 42.70.Gi
1. Introduction
Rare earth doped multicomponent oxide phosphors have been extensively studied for several years for applications in display devices, lights and detectors. Metal oxides are attractive host materials for rare earth dopants to develop advanced phosphors due to their good stability and easiness to synthesize 1,2,3. Among rare earths, Dy3+ ions have attracted significant attention because they have tremendous potential for applications in some optical fields, such as phosphors, electroluminescent devices, and optical amplifiers or lasers 4,5,6,7. In the last three decades nanomaterials have attracted the attention due to their different properties compared with the bulk materials. The optical, electrical and magnetic properties suffer drastically changes when the particle size is reduced to nanoscale, size related effects appear when the individual size of the particles is in the nanometric range 8. Luminescence materials are no exception, nanometric sizes phosphors have been studied for specific applications such as biomedical markers 9,10,11 and Solid State Lighting.
Nanoparticles synthesis with luminescent properties has been previously reported, using a variety of techniques such as co-precipitation method 12, reverse microemulsion method 13, Stöber method 14 and spray pyrolysis 15. One approach to producing strongly luminescent nanoparticles is to introduce small quantities of emissive dopants such as Dy3+ and Tb3+ ions. They are well known as activator dopants for many different inorganic lattices producing intense yellow and green luminescence respectively. The yellow color is due to the electronic transitions 4F9/2 to 6H15/2 at 483 nm, 4F9/2 to 6H13/2 at 573 nm, 4F9/2 to 6H15/2; at 667 nm and 4F9/2 to 6H11/2 at 766 nm from Dy3+ ions. These data are well known, since there are many reports about Dy3+ ions as luminescence activators 4,16,17,18. However, just few reports include some data about nanometric scales of particles and synthesis by ultrasonic spray pyrolysis 15,19.
On the other hand, gas phase chemistry processing of nanostructured materials offers significant advantages over liquid phase chemistry such as: the process could be scalable to high production rates; it can yield material of high purity; a wide range of materials can be formed; and the process can be designed to be both environmentally benign, with no toxic by-products, and energetically efficient. The important characteristics of the product include the particle size distribution, composition and morphology; in order to achieve these characteristics is important to take on account multiple variables in the design and operation of gas phase synthesis processes and have developed an appropriate formalism for treating this problem numerically 20.
In this work, synthesis and characterization of Dy and Dy-Li-activated yttria are reported. They were synthesized by ultrasonic spray pyrolysis, some adjusts were made in this technique in order to achieve phosphors and nanophosphors, and are also reported. The highlights of this report are the high luminescence intensity of phosphors and their nanometric sizes; SEM and TEM measurements were carried out in order to evaluate morphological and structural properties of the nanopowders, PL measurements were also carried out in order to estimate the luminescent properties of these nanophosphors.
2. Experimental details
The ultrasonic spray pyrolysis technique is widely used for synthesis of films or coatings of different materials, mainly high quality metallic oxides, since the technique is used under atmospheric pressure conditions. The spray pyrolysis technique is considered an inexpensive and scalable technique to obtain films and coatings with excellent properties. However, as it was mentioned above, this technique is mainly used to make metallic oxides into thin film shape; and it has to be modified in order to synthesize oxide nanoparticles with excellent properties, this was the case since the heat source and a cyclonic trap to collect the nanopowders. The technique consists in supplying an aerosol from a chemical solution which undergoes, through an oven using a quartz pipe, a pyrolytic decomposition, and then a trap is used to catch the nanopowders. A schematic picture of this arrangement is presented in Fig. 1. It could be observed the modified spray pyrolysis technique is composed of three zones, A) generation zone: it is the zone where the aerosol is generated from a chemical solution and then it is transported out by a carrier gas to the second zone; B) pyrolysis zone: at this part of the process, the transported aerosol is heated (by a hot wall furnace) until solvent in the aerosol drops is evaporated and a pyrolytic reaction occurs at this zone and finally some solid particles (oxides) are formed and are transported out to the third zone; C) collection zone: the powders (oxides) generated are trapped using a cyclonic trap, and the hot carrier gas is let out. The cyclonic trap, was designed in order to catch the nanopowders, it is capable to catch the powders even if they are warm and mixed with hot nitrogen (carrier gas) and separate them extracting the nitrogen and capturing the dust. Its design fosters the cooling of the nitrogen-powders by the use of a cold water cooling system. This capturer produces a cyclone inside the device which leads to separation of (large and small) particles from the nitrogen carrier gas through centrifugal forces. Having been separated the particles from carrier gas, they fall to the bottom by the action of gravity, which allows to capture a big quantity of powders and facilitates the extraction of the nitrogen carrier gas by an extractor hood.

Luminescent Y2O3 powders were prepared using appropriated amounts of YCl3-6H2O, DyCl3-6H2O, and LiCl-H2O (all of them supplied by Sigma Aldrich), and were dissolved in deionized water (18 MΩ-cm), The Dy3+ doping concentration was varied from 0 to 8 atomic %, in relation of Y3+, the optimum light emission was obtained at 2 atomic % of Dy3+. In order to enhance the luminescent emission of this phosphors, lithium was added as co-activator; the Li+ doping concentration was varied from 0 to 4 atomic %, in relation of Y3+, the optimum light emission was obtained at 2 atomic % of Dy3+ and Li+. The thermal energy required to get a pyrolytic reaction at 1000°C was supplied by the furnace and nitrogen (N2), at a flow rate of 50 l/min, was used as carrier gas.
3. Aerosol process
The decomposition of the aerosol in the spray pysolysis process, in order to carry on the synthesis of nanopowders, happens, through different phases, in different zones of the furnace as shown in Fig. 2 two of these are low temperature zones (about 300°C lower than the central zone) and a hot central zone (at about 1000°C), in the first zone (from left to right) the aerosol enters and is heated by the radiative heat propitiating that the solvent starts to be evaporated, in this step the vapors are mixed with the carrier gas. A second important step occurs in the hot central zone, in this area the pyrolytic processes takes place through a gas phase reaction, due to the presence of water vapor, it is possible to synthesize yttrium oxide doped with dysprosium and Li, owing to the size of the aerosol drops is possible to achieve nano-sized powders, and in order to preserve the nano-size and reduce the clusters formation it is important a quickly decrease the temperature, this is the main reason last low temperature zone and the collector cooling by a water flux.
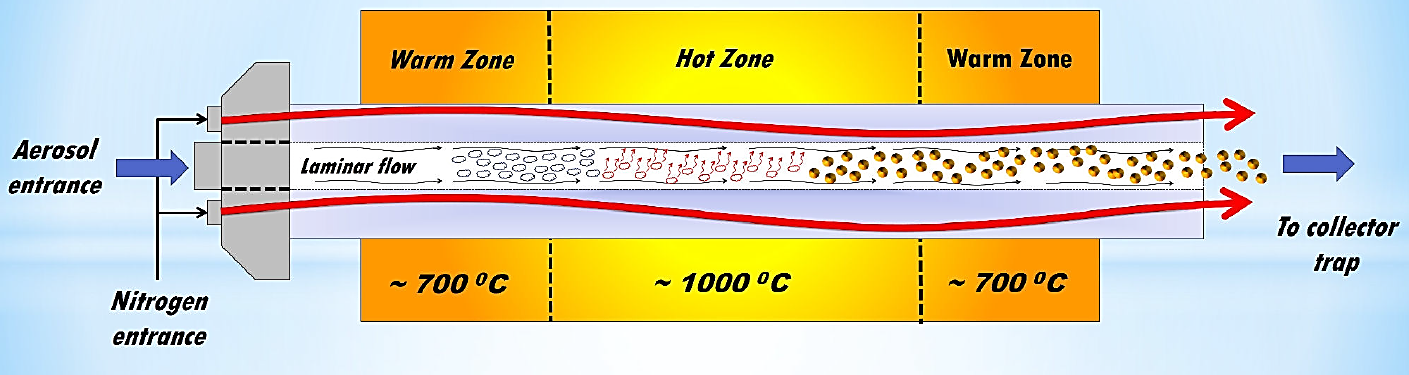
The injection of the aerosol and the carrier gas into the furnace is performed by three laminar flow process; two of them are just carrier gas (in our case nitrogen) and surround the third central flow, which contains the aerosol created from a chemical solution. This is very important in the synthesis process and helps the control of the chemical reaction in time to be coupled with the cyclonic trap device.
4. Cyclonic Trap
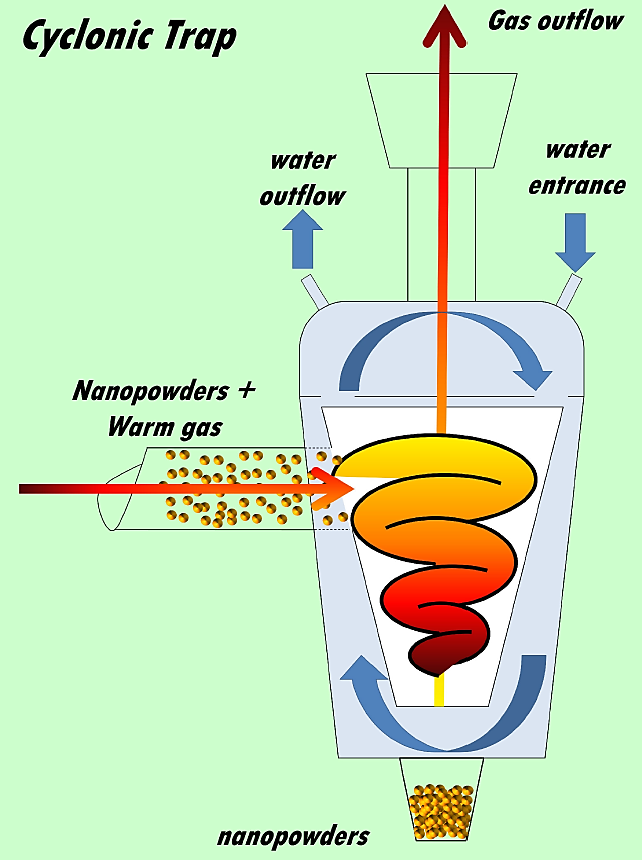
In order to catch the largest amount of nanopowders from the mixture of gas-powder exiting the furnace, a cyclonic trap was designed for this purpose. A high speed rotating (gas) flow is established within a conical container sealed within a water flowing chamber. In this case carrier gas-powder mixture flows in a helical pattern beginning at the top (see Fig. 3) of the conical container and ending at the bottom (narrow) end before exiting the cyclone in a straight stream through the center of the cyclone and out the top. As it could be appreciated in Fig. 1 an extraction chamber was used to make easy the extraction of the gas. The biggest size particles in the rotating stream have too much inertia to follow the tight curve of the stream, and strike the outside wall, then fall to the bottom of the cyclone where they can be removed. In this conical system, as the rotating flow moves towards the narrow end of the cyclone, the rotational radius of the stream is reduced, thus separating smaller particles. The conical container geometry, together with flow rate, defines the cut point of the cyclone, this is the size of particle that will be removed from the stream with efficiency close to 70%. Particles larger than the cut point will be removed with a greater efficiency and smaller particles with a lower efficiency. The water flux was added in this design, in order to cool the gas-powder mix, this cooling system is useful to enhance the collection efficiency due to a drastic reduction of kinetic energy of the mix, and on the other hand it is used also to protect the trap, since it was made of glass and oilcloth parts.
5. Powders characterization
Transmission electron microscopy (TEM) images were performed using a JEOL2010 microscope. The surface morphology of the powders was observed with a scanning electron microscope (SEM) using an accelerating voltage of 5 kV. The luminescence measurements were obtained from the powders pressed into pellets (0.5 cm in diameter and 1.5 mm thick). A SPEXFluoro-Max-P spectrofluorometer was used for photo luminescence measurements. All luminescence measurements were performed at room temperature.
6. Results and discussion
6.1. Morphological characteristics
Figure 4 shows the XRD patterns of non-doped Y2O3, the distribution of peaks in the XRD graphs can be associated nicely with the body centered cubic structure of Y2O3, according to the JCPDS 41-1105 diffraction card 21 with a lattice parameter a = 10.5957 Å. The diffraction patterns show reflections centered at values of 2θ of 20.50°, 29.20°, 33.80°, 48.50°, and 57.60° mainly. These values correspond to diffracting planes (2 1 1), (2 2 2), (4 0 0), (4 4 0), and (6 2 2) respectively; where the strongest reflection is related to the plane (2 2 2). This behavior is similar for doped and non-doped samples. However, it is notable that the crystallinity of the samples with no thermal treatment is very low, but it is enhanced after the annealing at 1000°C; this effect has been reported in many previous works 21,22,23. The average nano-crystallite size was calculated from the 22 diffraction peak (in Fig. 1, at 2θ = 29.2) using Scherrer’s formula 24:
Where: T represents crystalline size, λ the wavelength of CuKα (1.5406 Å) radiation, B the half width of the diffraction peak and θB the Bragg’s angle in radians. According to this formula average crystallite size was estimated to be about 28 and 32 nm for doped powders and 35 nm for non-doped samples.
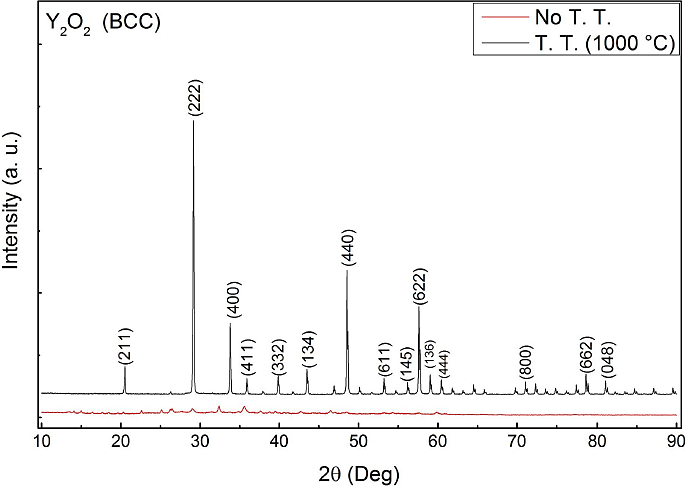
Figure 4 XRD measurements from Y2O3:Dy3+ phosphors with thermic (black line) and non-thermic treatment (red line).
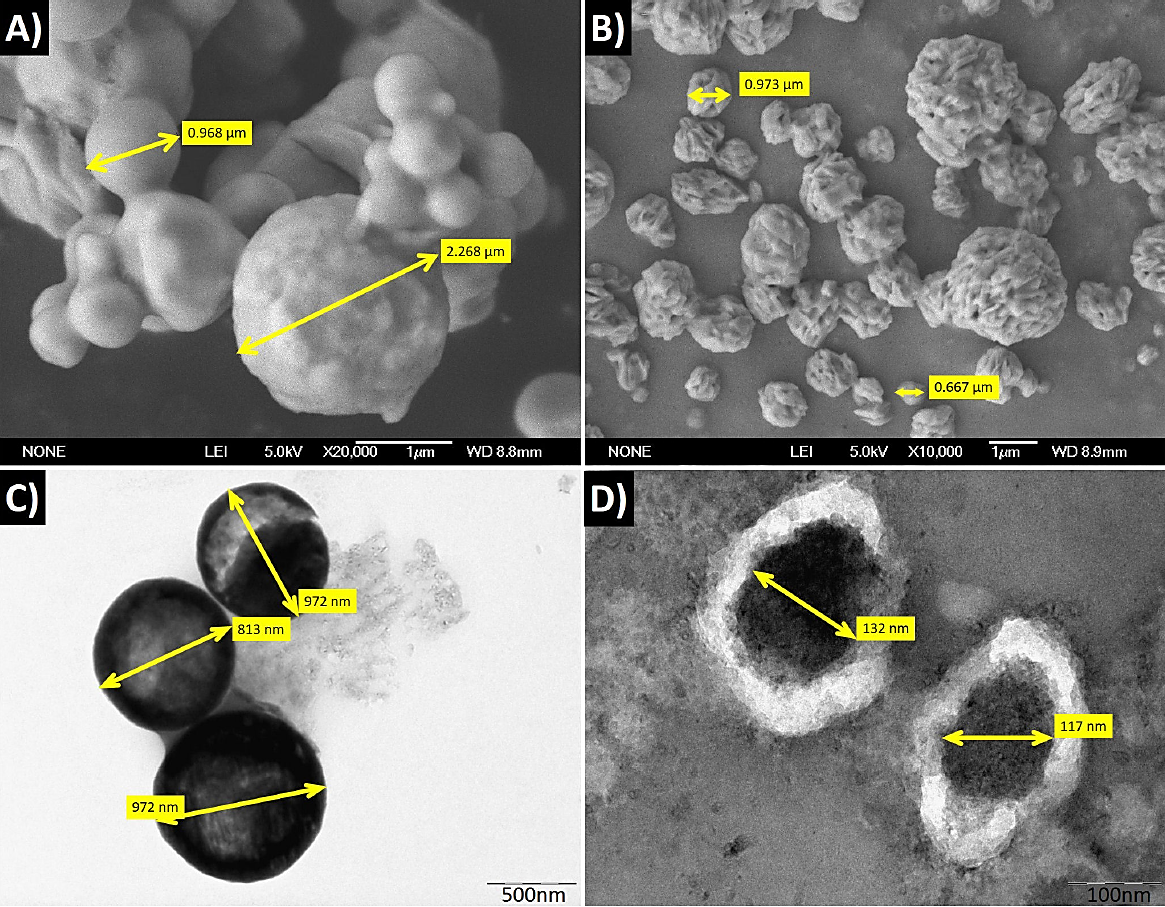
SEM micrographs, shown in Fig. 5a) and b), illustrate the typical morphology of the powders corresponding to Y2O3:Dy3+ (2 at %) powder annealed at 1000°C and Y2O3:Dy3+ (2 at %): Li+ (2 at %) powder annealed at 100°C respectively. It is observed that the powder consists of agglomerated particles with quasi-spherical shape with an average diameter of 175 nm. However, in the case of Y2O3:Dy3+ (2 at %): Li+ (2 at %) powder, it is also observable that particles present a rough texture, this effect is associated to the presence of lithium, this type of effect was previously reported in other works 25. TEM micrographs are shown in Fig. 5c) and d) for similar samples at two different magnifications, according to them, it is evident that nano-crystallites cluster together in large aggregates (of up to 140 nm). The size of the nano-crystallites, as it was mentioned above, determined by Sherrer’s formula from the X-ray diffraction data (∼32 nm).
6.2. Luminescent Properties
Figure 6 illustrates the room temperature photoluminescence excitation (A) and emission (B) spectral characteristic of the synthesized nanopowders, the spectra shown correspond to the Y2O3:Dy3+ (2 at %) and Y2O3:Dy3+ (2 %):Li+ (2 at %) powders annealed at 1000°C. The excitation spectra were measured in the 200-500 nm range for the 573 nm emission peak associated with a Dy3+ radiative transition, and show several peaks located at 298, 353, 400 and 413 nm. The peak centered at 353 nm corresponds to the transition 6H15/2 to 4M15/2, 6P7/2. The localized peaks at 400 and 413 nm are associated with transitions within the electronic energy levels of the Dy3+ dopant ion (6H15/2 to 4F7/2+4I13/2 and 6H15/2 to 4G11/2, respectively), these peaks are similar in both cases; however, in the case of lithium-doped powders, the luminescence intensity is higher than that for observed on samples without lithium (the intensity is around 20 % higher). Similarly, the PL emission spectra, obtained with an excitation wavelength of 351 nm, exhibit four distinct emission peaks located at 573 nm, 485 nm, 667 nm and at 766 nm associated with Dy3+ inter-electronic energy levels transitions from 4F9/2 to 6H13/2, 4F9/2 to 6H15/2, 4F9/2 to 6H11/2 and from 4F9/2 to 6H9/2 respectively. The overall luminescence intensity dependence with Dy and Li doping density was monitored by plotting the 573 peak intensity as a function of each of these parameters (Fig. 6C) and 6D).

The PL intensity was found to increase monotonically with increasing annealing temperature up to the highest temperature (considered in this work 1000°C). This behavior is correlated with the crystallinity improvement with annealing temperature shown in Fig. 4, therefore it is likely that the increase in luminescence emission is due to a stronger and better defined crystalline field on the Dy3+ ion within the Y2O3 host. The Fig. 6 C) shows the photoluminescent emission of the powders annealed at 1000°C for different dopant concentrations. It is possible to observe that the best emission efficiency is associated with a dopant concentration of 2 at %. When the Dy concentration is more than a 2 at % the PL emission decreases. At higher dopant concentrations the mean distance between dopant ions is much shorter; therefore these ions can interact by an electric multipolar process leading to energy migration and to an increase of the probability of a non-radiative recombination 26,27. A similar effect is reported for the lithium ions, in the Fig. 6 D), the photoluminescent emission of the powders annealed at 1000°C for different lithium concentrations is presented; it is possible to observe that the best emission efficiency is associated with Li+ concentration of 2 at %. According to this fact, the optimum luminescent emission achieved in this work is Y2O3:Dy3+ (2 at %) : Li+ (2 at %).
7. Conclusions
In conclusion, spray pyrolysis method was used to synthesize uniform near-spherical Y2O3: Dy3+ and Y2O3:Dy3+-Li+ nanopowders. The morphology and the crystal structure of thermally treated phosphors were characterized by XRD, SEM and TEM measurements. The synthesized phosphors had near spherical morphology. It was found that the luminescence properties depended on the dopant concentration, the lithium concentration and heat treatment temperature of the phosphors. Luminescence quenching was observed around 2 at % equivalent of Li+ and Dy3+-doped Y2O3, which is considered to be the optimal dopant concentration. A strong yellow emission due to the 4F9/2 to 6H13/2 transition is visible with the naked eye and is expected to find applications in wide areas of industry

