SciELO - Scientific Electronic Library Online

 
vol.63 número2Experimental multi-scroll attractor driven by switched systems índice de autoresíndice de materiabúsqueda de artículos
Home Pagelista alfabética de revistas  

Servicios Personalizados

Revista

Articulo

Indicadores

Links relacionados

  • No hay artículos similaresSimilares en SciELO

Compartir


Revista mexicana de física

versión impresa ISSN 0035-001X

Rev. mex. fis. vol.63 no.2 México mar./abr. 2017


Research

Optimization for maximum Raman frequency conversion in supercontinuum sources using genetic algorithms

F.R. Arteaga-Sierraa  b  * 

C. Miliánb  c  d 

I. Torres-Gómeze 

M. Torres-Cisnerosa 

H. Plascencia-Moraa 

G. Moltód 

A. Ferrandob  f 

aGrupo de NanoBioFotónica, DICIS, Universidad de Guanajuato, Salamanca, Guanajuato, 36780, México.

bUniversidad Politécnica de Valencia, Grupo de Modelización Multidisciplinar Intertech, Valencia, 46022, Spain.

cCentre de Physique Théorique, École Polytechnique, CNRS, F-91128 Palaiseau, France.

dInstituto de Instrumentación para Imagen Molecular (I3M), Centro mixto CSIC-Universitat Politècnica de València-CIEMAT, camino de Vera s/n, 46022 Valencia, España.

eCentro de Investigaciones en Óptica, A.C., León Gto. 37150, México.

fDepartament d’Óptica, Universitat de València, Burjassot (València), 46100, Spain.


Abstract

A frequency convertor based on the soliton self-frequency shift by the supercontinuum generation is obtained by optimization of only three parameters of a Ti:Sapphire laser pulse, namely, carrier wavelength, peak power and time duration. The frequency conversion is performed and calculated by simulating the propagation of the pulse in a simple piece of 25 cm long commercial photonic crystal fiber pumped by the femtosecond Ti:Sapphire laser, whose only pre-requisite is to exhibit the standard supercontinuum. The resulting spectral broadening has a maximum spectral conversion in the anomalous region just by playing with the three realistic controllable parameters. Optimization is performed using pre-defined functions of genetic algorithms. Our results indicate that the efficiencies of Raman conversion achieved by merely optimizing the pulse parameters in a commercial fiber are comparable with those obtained in more elaborated Raman convertor devices.

Keywords: Solitons in optical fibers; nonlinear optics; optical frequency converters

PACS: 42.65.Tg; 42.79.Nv

1. Introduction

The Soliton self-frequency shift (SSFS)1,2 has been demonstrated as an important mechanism for the supercontinuum (SC) generation with femtosecond pulses in optical fibers 3,4. Specifically, many effects implied in SC generation would not be possible without the SSFS 5,6,7,8,9,10,11. Its characteristic large frequency shift has been exploited for the fabrication of infrared (IR) sources 12,13,14, even its optimization has been reported 15,16,17.

In previous works, we have shown that a fs-pulse can simultaneously generates several pre-defined spectral peaks by means of dispersive waves in the normal GVD18 or by soliton self-frequency shift in the anomalous GVD19. It is useful for potential applications of optical coherence tomography (OCT). Now, regarding the same kind of applications, we present a computational optimization with the use of a genetic algorithm (GA) to obtain not only a tunable frequency convertor (see, e.g., Refs. 20,21), but also achieving the maximum spectral conversion possible in the fixed channel regarding the scope of the initial set of input pulse parameters. This frequency convertor is useful for applications where high power is demanded.

We simulate pulses propagation in a commercial highly nonlinear photonic crystal fiber, NL-2.4-800 PCF (see Ref. 19 for details of cross sectional geometry), exhibiting SC generation at the Ti:Sapphire laser wavelengths. This method finds the optimal input pulse parameters, namely central wavelength, λ0, temporal width, T0, and peak power, P0, that maximize the output SC power in a spectral channel of fixed width and selected central frequency, ωc. Our typical channel width chosen here narrow enough so the optimal ωc will be around the carrier frequency of the most powerful, i.e. firstly ejected Raman soliton in the IR spectral region 22. The inverse problem, i.e. the design of PCFs to optimize the SC has indeed been previously solved satisfactorily in a wide range of situations 23,24,25,26,27. Our interest in the IR region is motivated specifically by applications in OCT 28,29,30,31,32,33,34.

2. Pulse propagation and genetic algorithms

Using a Fourier split-step method, we simulate the propagation of optical pulses with complex amplitude A(z, t) by integrating numerically the GNLSE 3,

-izA(z,t)=q2βq(ω0)q!(it)qA(z,t)+γA(z,t)-+dt'R(t')|A(z,t-t')|2, (1)

where z is the axis coordinate along the fiber propagation, the dispersion coefficients βq’s (up to q = 10 in this work computed with a FEM solver) account for the linear fiber dispersion at the pump frequency ω0=2πc/λ0. Nonlinearity is included through the parameter γ and the response function RT1-fR Δ(T)+fRhR(T)Π(T), where fR=0.18, hR is the commonly used Raman response of silica 35, and Δ(T), Π(T) are the Dirac, Heaviside functions, respectively. The dispersion coefficients βq were computed using Optiwave36.

The input pulse used in this work belong to a realistic laser source, the form is A(z=0,t)=P0 sech (t/T0), where the intensity full width at half maximum TFWHM=2T0ln1+2 and P0 as the peak power. The soliton order is computed by N=T0γP0/ |β2|.

Optimization algorithms have been developed in order to solve problems involving multiple variables in which solution seems to be non trivial (see Refs. 37,38,39 for reviews on the topic). A GA is a evolutionary computational algorithm for optimization which makes evolve an initial population of individuals in order to find global minima when a number of generations is generated 40,41. Each individual is the result of the evaluation of a set of parameters (λ0, P0 and T0 in this work) and applies a minimization strategy to find the solutions taking the minimum value of the fitness function ϕ. The use of GAs in the fiber-design context is not new 23,24. Previously, some works have made use of GAs for the optimization of the dispersion management 26,27, even the design of PCF structural parameters for SC generation 25. We use a GA using pre-defined functions of Matlab 42. In the first stage, the GA starts generating a randomly initial population of p = 50 individuals. In the second stage, the most promising individuals generated in the first stage are allowed to reproduce to determine the next generation of individuals according to the pre-established evolution rules of Mutation M^, Cross-over X^ and Random R^. The Mutation operator M^ [5%in this work] makes possible the change of one chromosome of the promising individuals. The Cross-over operator X^ [95% in this work] acts as a parent selection method, i.e. a mix of two promising individuals (parents) and their rates to obtain the offspring for the next generation. Most parent selection methods are stochastic in order to keep the diversity of the population, preventing premature to a sub-optimal convergence solution. The Random operator R^ is selected if population is smaller than the threshold value c (c < p) and by the genetic operator M^ for chromosome changes. At the end (after m = 150 in our case), the best individual is picked of the evolved population and chosen as optimal solution. The optimization process is depicted in Fig. 1.

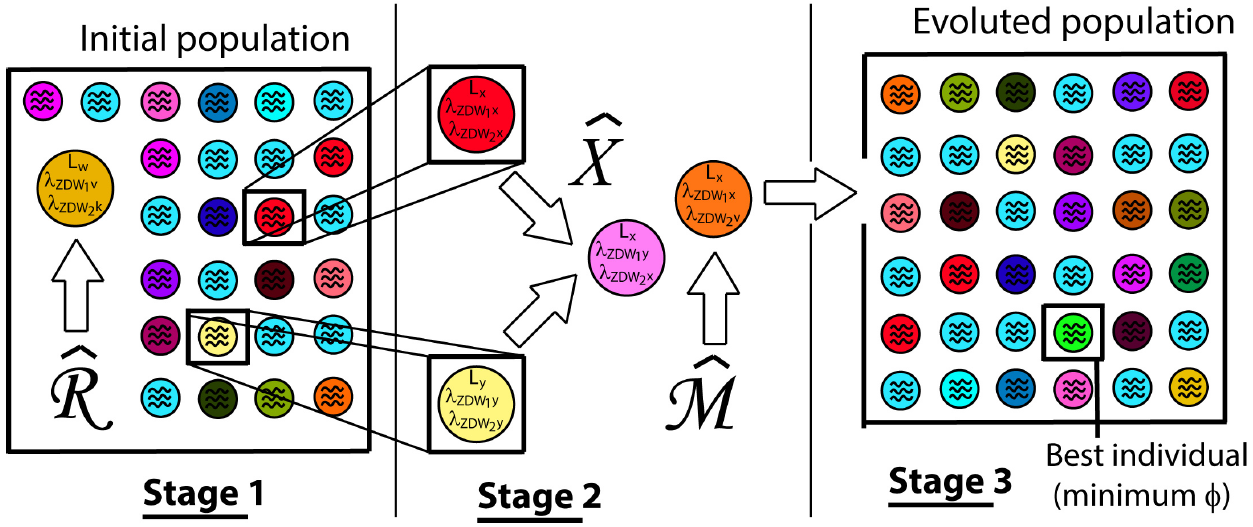
Figure 1. Diagram of the operation of the GA. In first stage a population of possible solutions is generated randomly. In the second stage, new individuals are created by M^, X^ or R^ and each one is compared with the worst solution created in the initial population, if the new individual is better, then it is selected as a new individual in the next generation instead the worst solution, otherwise is dismissed. The process causes the mean fitness improvement in the population. At Stage 3 (after m = 150 in our case), the best individual is picked of the evolved population and chosen as optimal solution. 

3. Raman frequency conversion

It has been proved that high axial resolution in OCT systems is aimed in the spectral region of 800 nm to 1400 nm 43,44. Aditionally, the NIR II light decrease in scattering and increase in transparency of the biological tissues over the NIR range 45. Moreover Gaussian spectral shapes avoid spurious structures in OCT images 46. For these reasons, IR-Raman soliton can be considered a very good option to OCT applications.

In Sec. 3.1, we search the optimal parameters, λ0, T0 and P0, by implementing the fitness function defined as

ϕ(ωc;δ)ωc-δωc+δdω'|Ã(ω')|2-1, (2)

where |Ã(ω')|2 is the output pulse power amplitude, 2δ=50 nm is the chosen spectral channel width, and ωc is the central frequency, determined by inspection of the output spectrum, to minimize ϕ(ωc;δ) and, consequently to increase the efficiency of conversion given by

η=ϕ-1-+dω'|Ã(ω')|2. (3)

In order to prove the convenience of our method, it is made an exhaustive search of the best fitness value by scanning the entire ranges of parameters. It is shown in Sec. 3.2

3.1. Optimal solution using genetic algorithms

The optimization consisted in the search of parameters that originate the maximum output power in each selected spectral channel on the NIR II using the GA to vary the pulse parameters P [1, 15] kW, λ [750, 850] nm and T [30, 110] fs. The range of values used in this work are attainable in realistic Ti:Sapphire lasers. In this particular optimization problem, each individual evaluation typically required 90 s what amounted for about 3.75 h of CPU time to perform a single run of the GA with 150 individuals. The set of all the individuals generated by the GA in each channel optimization is shown as a example in a 3Dcloud" graphic in the space of parameters in Fig. 2(a).

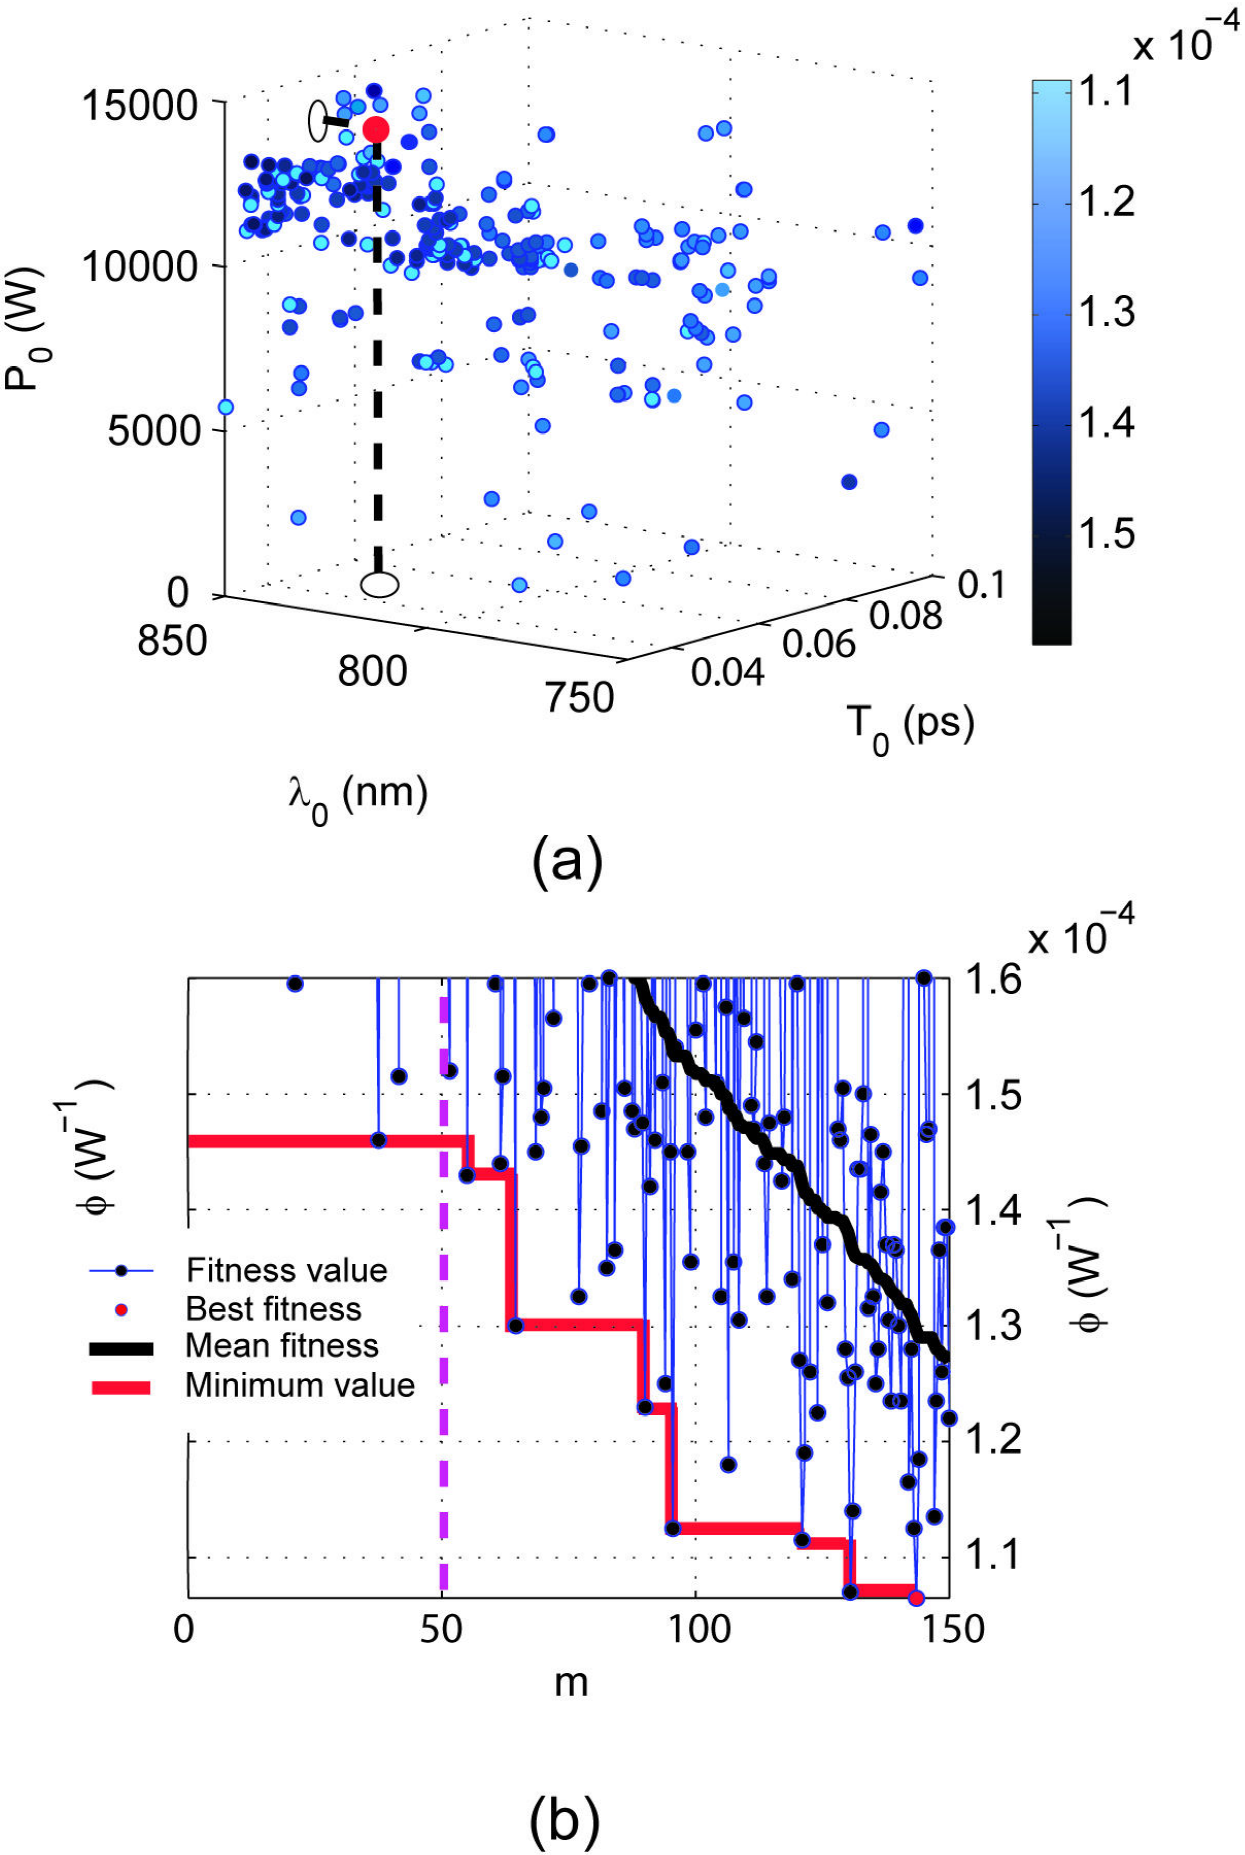
Figure 2. (a) Cloud of m = 150 individuals generated by the GA for a channel of λc = 1225 nm. The color of the points shows the fitness ϕ value of each individual, lighter points have smaller (thus, better fitness values) and the optimal individual is represented as the red point sited in the coordinates of the three optimized parameters. (b) Typical fitness value evolution of executions in chronological order of generation during the optimization procedure with its mean fitness value (black line) and the minimum global value (red line), dashed magenta vertical line separate the best individual within the first random individuals (m = p th = 50) generated in the stage 1 of the process. 

This “cloud" of individuals corresponds to all solutions generated by the GA, their fitness function being represented by the color code bar. Lighter points have smaller fitness values (thus, better) than darker ones. We observe that there exists a zone where the GA tends to accumulate points. It is precisely in this region where the best fitness value (red point) is found. It is worth mentioning that in general these regions could contain more candidates to optimal solutions than those eventually selected by the GA. Thus, keeping track of these “quasi-optimal" individuals can also be of great interest from the physical point of view since they can provide extra-local minima of the fitness function not considered in a preliminary physical analysis of the optimization scenario. Once the local minima have been detected, a more accurate search around them combining GA strategies and other optimization techniques can be performed in order to find a better minimum of the fitness function.

Figure 2(b) shows clearly the “dynamical" improvement in the fitness value as the GA evolves [referred to in Fig. 1]. The initial “optimized" value is obtained in the stage 1, when the initial population of 50 individuals is randomly generated (delimited by the vertical dashed line). After the 50th evaluation, the stage 2 of our algorithm initiates, when genetic operators start to act on the previous population. A significant improvement in the fitness of the population is apparent, the mean fitness value of the population is monotonically decreasing as new individuals are generated, as the black continuous curve. The red line shows the minimum global value until the instant of the last individual is generated in the process. Our GA has not a tendency to converge towards local optima or arbitrary points rather than the global optimum of the problem, this is caused because the operator M^ gives a lower probability of occurrence than crossover operator, this combination gives a good diversity in the generation of new individuals with the better probability to conserve the best properties of its predecessors ensuring the good convergence of the GA. The set of optimized parameters for each λc within the NIR II region and under the mentioned conditions are shown in Table I.

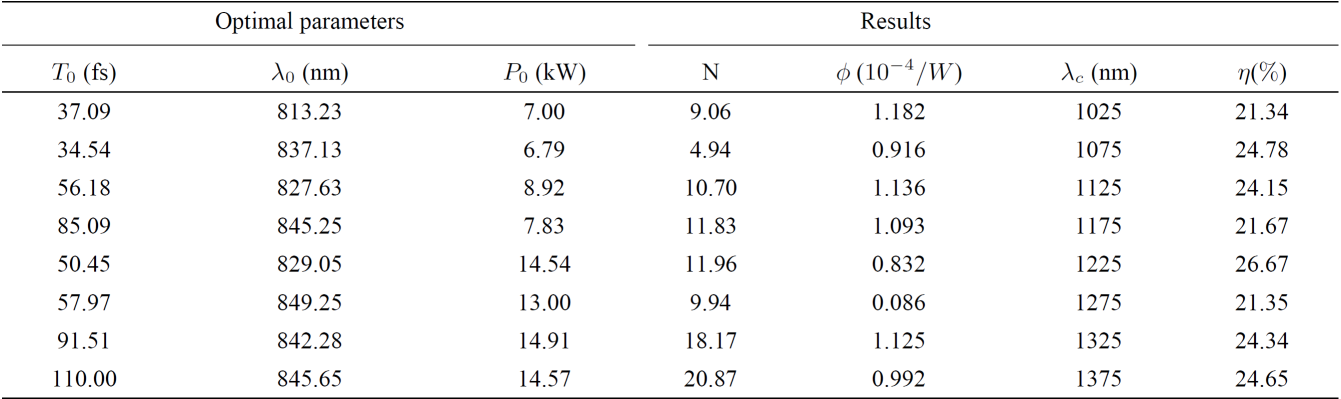
Table I. Optimal parameters, T0, λ0, and P0, obtained using the GA. The soliton order, N, fitness value, ϕ, output central wavelength, λ0, and efficiency of frequency conversion, ƞ, are shown as the obtained results. 

The spectral and temporal evolutions of the best individual found in the optimization process (see Fig. 1) are shown in Figs. 3(a)-(b) respectively. It clearly demonstrates the optimality of the result provided by the GA: the spectrum of the first Raman soliton (the reddest one) is accurately centered in the targeted channel (delimited by the dashed lines).

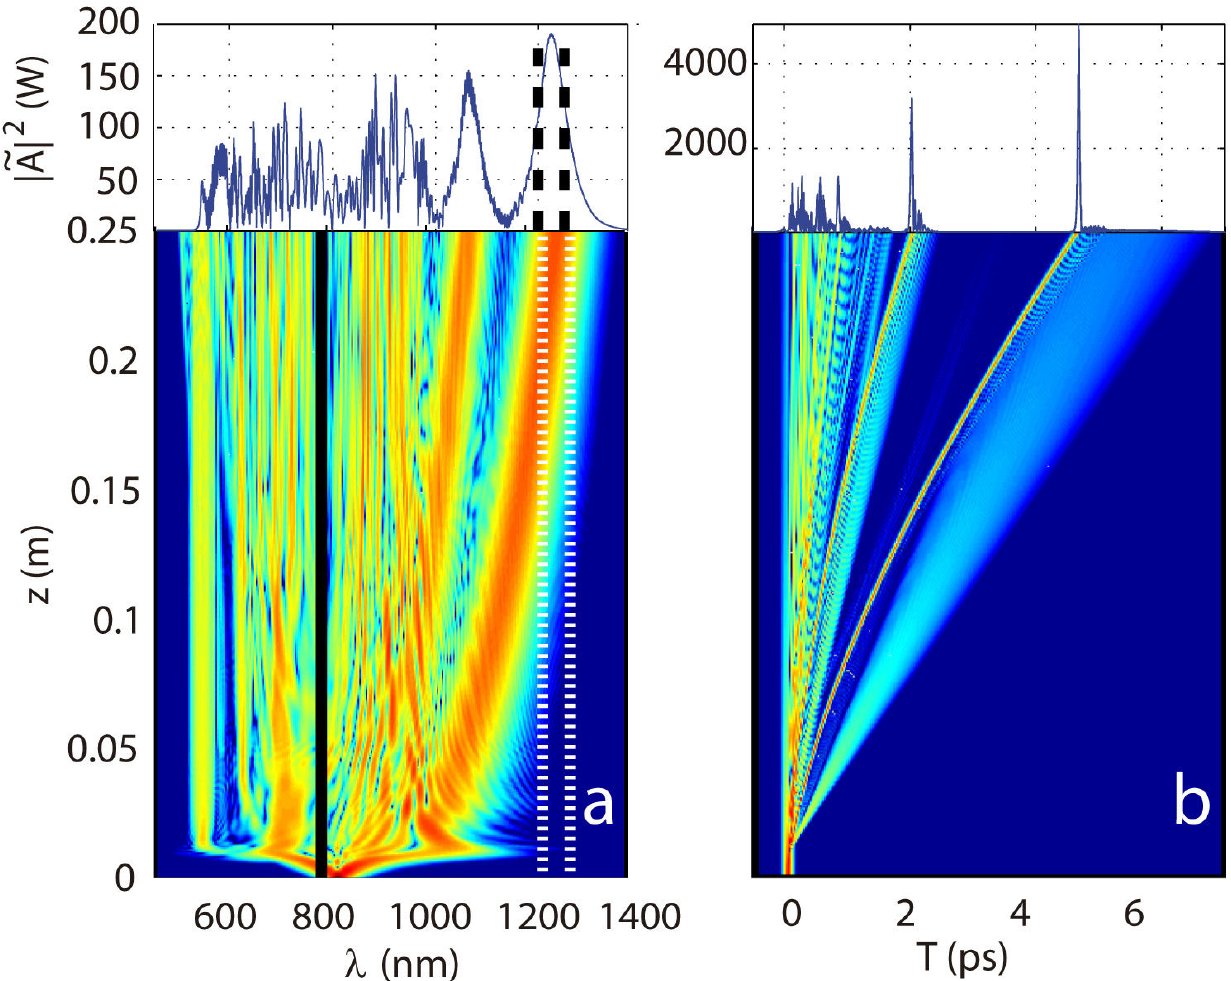
Figure 3. Spectral (a) and temporal (b) evolutions on distance z corresponding to optimized parameters T 0 = 50.45 fs, λ0 = 829.05 nm and P 0 = 14.54 KW for a channel centred in λc = 1225 nm (as in Table ). In the spectral window, dashed vertical lines shows the channel with maximum spectral power obtained by the GA. The black continuous line represent the zero GVD. 

The maximum spectral power found for each channel results very approximate to the Kodama and Hasegawa predictions for the soliton amplitude22.

It is known that SSFS can be made large by propagating shorter pulses with high peak powers inside highly nonlinear fibers and that the fission of higher-order solitons generates frequency-shifted pulses in form of Raman solitons 1,35.

In order to validate of our method, it is made an exhaustive search of the best fitness value by scanning the entire ranges of parameters. It is shown in Sec. 3.2.

3.2. Optimal solution using exhaustive search

Now, a searching method is implemented to check the reliability of our results. It consists of picking the individual with the best fitness value from a systematic evaluation of all possible combinations of parameters (m = 675) within the defined ranges with defined steps. It is worth mentioning that this process requires larger capabilities of time-machine (16.5 h) than the shown using GAs in the previous section. The set of optimized parameters by this method is shown in Table II.

Table II. Best parameters, T0, λ0, and P0, obtained by exhaustive search with m = 675. The soliton order, N, fitness value, ϕ, output central wavelength, λc, and efficiency of frequency conversion, ƞ, are shown. 

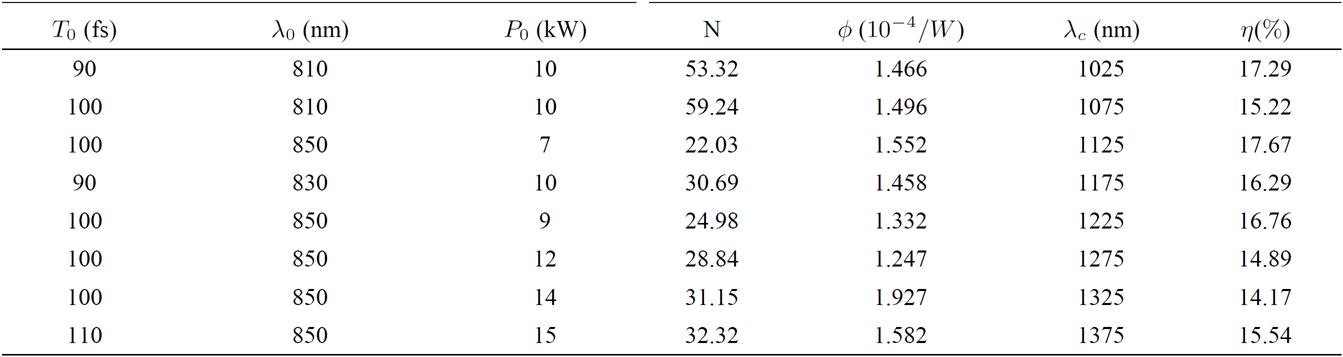
The chart of different values for the λc=1225 nm case is shown in the Fig. 4(a). The black polygonal-line shows how the best individual of fixed power jumps randomly in the case when the use of a GA is avoided. Figure 4(b) shows the fitness value evolution in chronological order for the exhaustive search. A sawtooth behavior of the fitness value evolution is because the fitness value becomes better and worse by repeating the parameter values for each individual while they are evaluated in the search.

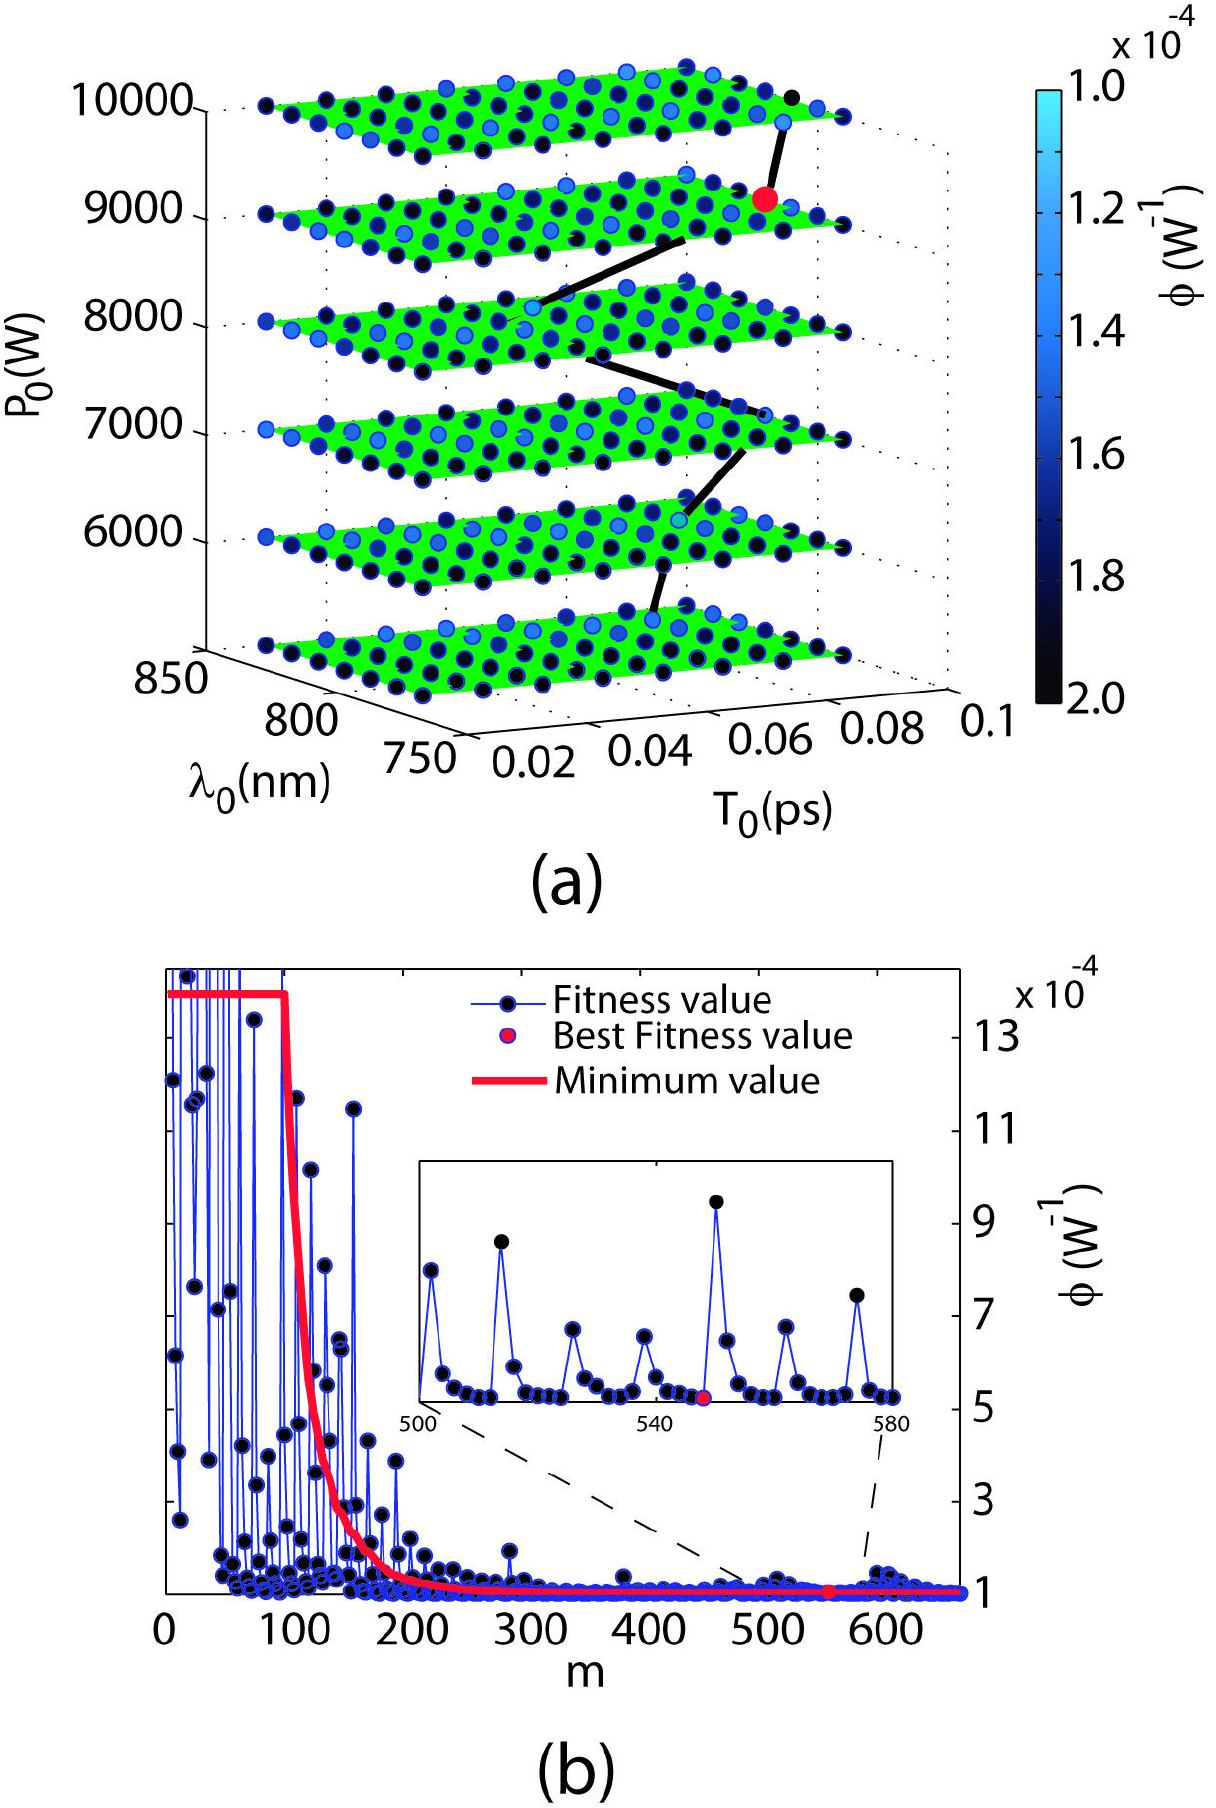
Figure 4. (a) Fitness value charts for different P 0 values with m = 675 generated for λc = 1225 nm without the use of the GA (see Table ). The color of the points shows the fitness (ϕ) value of each individual, lighter points have smaller (thus, better fitness values) and the best individual is represented as the red point sited in the coordinates of the three parameters. The black polygonal-line sorts the best individuals for the specific P 0 . (b) Fitness value evolution of executions in chronological order of generation during the optimization procedure with the minimum global value (red line). The sawtooth behavior of the fitness value evolution is shown in the inset. 

By comparing Tables and , we can see that the efficiency obtained in the optimization using the GA is better than the search made without using the GA, even using more executions in the exhaustive search. We perform a new search level by focusing on a smaller region around the neighbourhood of the previously optimized results in Table . The new conditions are: PP0±0.5 kW, TT0±5 fs and λλ0±5 nm. The results of the “zoom-in” for each channel are shown in Table . The efficiency of conversion based on the exhaustive search zoom-in is still not better than the efficiency obtained using GA (see Tables and ). Although, it is possible to perform a new search level, the time required will be considerably longer (48 h compared with 3.75 h using the GA). However, this new search level still does not ensure to find the best solution like GA does.

Table III. Best parameters, T 0 , λ0, P 0 , obtained in the zoom-in by exhaustive search with m = 675. The soliton order, N, fitness value, ϕ, output central wavelength, λC, and efficiency of frequency conversion, ƞ, are shown. 

4. Conclusions

We have presented a well defined and efficient optimization procedure of a Ti:Saphire laser pulse parameters to obtain the maximum frequency conversion using a simple device by means of solitonic red-shift in the anomalous region. This optimization is achieved with the use of GAs. Therefore, it has been shown that efficient spectral conversion based on SSFS can be achieved using a simple PCF as a medium of generating spectral broadening pumped by a Ti:Sapphire laser just by properly controlling the input parameters of the input pulses. This scenario typically involves soliton fission and emission of dispersive waves into the normal GVD regime, situation in which precise analytical estimates are not available and therefore the use of numerical simulations in combination with GA is of great usefulness. In summary, this work results in a tool with great potential for optimization of the output of SC spectra for practical OCT applications in the NIR II region.

Acknowledgements

F.R.A.S. thanks the SEP-Prodep posdoc grant. Also, M.T.C. would like to thank for the partial funding provided through the projects; CONCyTEG GTO-2012-C03-195247, “Apoyo a la Investigacion UG-DAIP 16-17” and “Convocatoria CIO-UG 2015”. I.T.G. acknowledge CONACyT for partial support, project: 106764 (CB-2008-1). The work of A.F. was supported by the MINECO under Grant No. TEC2010-15327.

References

1. J.P. Gordon, Opt. Lett. 11 (1986) 662-664. [ Links ]

2. F.M. Mitschke and L.F. Mollenauer, Opt. Lett. 11 (1986) 659-661. [ Links ]

3. J.M. Dudley, G. Genty and S. Coen, Rev. Mod. Phys. 78 (2006) 135-1184. [ Links ]

4. D.V. Skryabin, and A.V. Gorbach, Rev. Mod. Phys. 82 (2010) 1287-1299. [ Links ]

5. A.V. Gorbach and D.V. Skryabin, Nat. Photon. 1 (2007) 1749-4885. [ Links ]

6. A. Hause, T.X. Tran, F. Biancalana, A. Podlipensky, P. St. J. Russell and F. Mitschke, Opt. Lett. 35 (2010) 2167-2169. [ Links ]

7. A. Hause and F. Mitschke, Phys. Rev. A 82 (2010) 043838. [ Links ]

8. T.X. Tran, A. Podlipensky, P. St. J. Russell and F. Biancalana, J. Opt. Soc. Am. B 27 (2010) 1785-1791. [ Links ]

9. A.V. Gorbach and D.V. Skryabin, Opt. Express 16 (2008) 4858-4865. [ Links ]

10. C. Milián, D.V. Skryabin and A. Ferrando, Opt. Lett. 34 (2009) 2096-2098. [ Links ]

11. C. Milián, A. Ferrando, and D.V. Skryabin, J. Opt. Soc. Am. B 29 (2012) 589-593. [ Links ]

12. S. A. Dekker et al., Opt. Express 18 (2011) 17766-17773. [ Links ]

13. J. Rothhardt, A.M. Heidt, S. Hädrich, S. Demmler, J. Limpert and A. Tünnermann, J. Opt. Soc. Am. B 29 (2012) 1257-1262. [ Links ]

14. A.M. Al-kadry and M. Rochette, J. Opt. Soc. Am. B 29 (2012) 1347-1355. [ Links ]

15. A.C. Judge et al., J. Opt. Soc. Am. B 26 (2009) 2064-2071. [ Links ]

16. S. Pricking and H. Giessen, Opt. Express 18 (2010) 20151-20163. [ Links ]

17. R. Pant, A.C. Judge, E.C. Magi, B.T. Kuhlmey, M. De Sterke and B.J. Eggleton, “Characterization and optimization of photonic crystal fibers for enhanced soliton self-frequency shift,” J. Opt. Soc. Am. B 27 (2010) 1894-1901. [ Links ]

18. F.R. Arteaga-Sierra, C. Milían, I. Torres-Gómez, M. Torres-Cisneros, A. Ferrando, and A. Dávila, Opt. Express 22 (2014) 2451-2458. [ Links ]

19. F.R. Arteaga-Sierra, C. Milían, I. Torres-Gómez, M. Torres-Cisneros, G. Moltó, and A. Ferrando, Opt. Express 22 (2014) 23686-23693. [ Links ]

20. G. Moltó, M. Arevalillo-Herráez, C. Milián, M. Zacarés, V. Hernández and A. Ferrando, “Optimization of supercontinuum spectrum using genetic algorithms on service-oriented grids,” in Iberian Grid Infrastructures Conference proceedings (2009) 137-147. ISBN 978-84-9745-406-3 [ Links ]

21. A. Ferrando et al., Proc. SPIE 7839 (2010) 78390W. [ Links ]

22. Y. Kodama and A. Hasegawa, IEEE J. Quantum Elect. 23 (1987) 510-524. [ Links ]

23. E. Kerrinckx, L. Bigot, M. Douay and Y. Quiquempois, Opt. Express 12 (2004) 1990-1995. [ Links ]

24. W.Q. Zhang, J.E. Sharping, R.T. White, T.M. Monro and S. Afshar V., Opt. Express 18 (2010) 17294-17305. [ Links ]

25. W.Q. Zhang, S. Afshar V. and T.M. Monro, Opt. Express 17 (2009) 19311-19327. [ Links ]

26. R.R. Musin and A.M. Zheltikov, Opt. Commun. 281 (2008) 567-572. [ Links ]

27. Y. Guo-Bing, L. Shu-Guang, L. Shuo and W. Xiao-Yan, Chinese Phys. Lett. 28 (2011) 064215. [ Links ]

28. J. Wang et al., J. Am. Coll. Cardiol. 39 (2002) 1305-1313. [ Links ]

29. Y.M. Wang et al., Opt. Express 11 (2003) 1411-1417. [ Links ]

30. J.G. Fujimoto, Nat. Biotechnol. 21 (2003) 1361-1367. [ Links ]

31. A. Unterhuber et al., Phys. Med. Biol. 49 (2004) 1235-1246. [ Links ]

32. G. Humbert et al., Opt. Express 14 (2006) 1596-1603. [ Links ]

33. F. Spoeler et al., Opt. Express 15 (2007) 10832-10841. [ Links ]

34. S. Ishida and N. Nishizawa, Biomed. Opt. Express 3 (2012) 282-294. [ Links ]

35. G.P. Agrawal, Nonlinear Fiber Optics, 4th ed. (Academic Press. 2007). [ Links ]

36. http://www.optiwave.comLinks ]

37. X. Yang, Nature-Inspired Optimization Algorithms (Elsevier. 2007). [ Links ]

38. E. Zitzler, K. Deb, and L. Thiele Comparison of Multiobjective Evolutionary Algorithms: Empirical Results (MIT Press Journals. 2000). [ Links ]

39. C.A. Coello, G.B. Lamont, and D.A. Van Veldhuizer Evolutionary Algorithms for solving Multi-Objective problemas, 2nd ed. (Springer. 2007). [ Links ]

40. U. Mahlab, J. Shamir and H. J. Caulfield, Opt. Lett. 16 (1991) 648-650. [ Links ]

41. R.L. Haupt and S.E. Haupt, Practical Genetic Algorithms, 2nd ed. (John Wiley & Sons, 2004). [ Links ]

42. http://www.mathworks.comLinks ]

43. J.G. Fujimoto , C. Pitris, S.A. Boppart and M.E. Brezinski, Neoplasia 2 (2000) 9-25. [ Links ]

44. Y. Wang, Y. Zhao, J.S. Nelson, Z. Chen, R.S. Windeler, Opt. Lett. 28 (2003) 182-184. [ Links ]

45. A.N. Bashkatov 1, E.A. Genina, V.I. Kochubey, and V.V. Tuchin, J. Phys. D: Appl. Phys. 38 (2005) 2543-2555. [ Links ]

46. R. Tripathi, N. Nassif, J.S. Nelson, B.H. Park and J.F. de Boer, Opt. Lett. 27 (2002) 406-408. [ Links ]

Received: September 19, 2016; Accepted: October 28, 2016

Creative Commons License This is an open-access article distributed under the terms of the Creative Commons Attribution License