


 nueva página del texto (beta)
 Inglés (pdf)
 Artículo en XML
 Referencias del artículo
 Enviar artículo por email
 Citado por SciELO
  Similares en
SciELO
Similares en
SciELO 
 Permalink
PACS: 52; 78.30.-j
1. Introduction
Carbon exists in various possible forms, such as graphene, graphite, diamond, amorphous carbon and derivatives of these in the presence of other constituents, e.g. hydrogen, forming possibly hydrogenated amorphous carbon. Thus, researching on carbon materials is facilitated by using a technique that provides a unique finger-print for each of these phases. Further, to be appealing, a characterization tool must be non-destructive?, fast, with high lateral resolution and provide as much structural and electronic information as possible. All these requirements are embodied by Raman spectroscopy. Hence, Raman spectroscopy has been of distinguished importance in recent years when, e.g. investigating the electronic structure and optical properties of single walled carbon nanotubes1 and graphene2.
Synthesis of carbon nano-particles (CNPs) using different techniques has attracted increasing interest ever since the buckey-balls were discovered3. The synthesis of a range of different CNPs and their applications are the subject of research and development within a range of disciplines, such as biotechnology4 and nanotechnology5. Presently, a particularly interesting technique for synthesizing high pressure phases is laser ablation in liquid (LAL)6. The laser beam induces a high temperature and a high pressure where the liquid provides the additional pressure gain compared to laser ablation in vacuum7. The high temperature of the ablated plume during laser ablation of graphite in water was confirmed by the work of Saito (2003) et al8, where the plume temperature was determined to be between 4000-6000 K during the first 1000ns. Soon after LAL became known nano-crystalline diamond nano-particles (NCDNPs) were synthesized by LAL9. According to Yang’s10 theoretical predictions the range of sizes of NCDNPs are limited and depends on temperature and pressure. While several investigations have confirmed, by Raman spectroscopy and electron microscopy, the co-synthesis of NCDNPs and carbon allotrope NPs by LAL, using visible11,12,13 and near-UV14 nanosecond and near-infrared femtosecond15 laser pulses, limited studies have so far investigated the distribution of grain size and its possible relation to carbon phases for CNPs formed by LA in water. Here, we show that Raman spectroscopy can provide detailed structural and mesoscopic information of the CNPs formed, which is not only a requirement to understand the complex process of LA (of graphite) in water but serves also to show the versatility and importance of the technique.
2. Material and Method
Laser ablation of CNPs was performed by irradiating a bulk polycrystalline graphite sample immersed in water and in sodium dodecyl sulfate (SDS) aqueous solution (1 weight %) using laser pulses with a width of 8 ns from a Nd:YAG laser (1064 nm). The laser pulse propagation direction was vertical with respect to the air/water surface, where the water level was normally about 3-5 mm above the graphite surface. Assuming a Gaussian beam profile, the characteristic waist of the laser beam,
The CNPs were allowed to sediment for about 30 min before 10
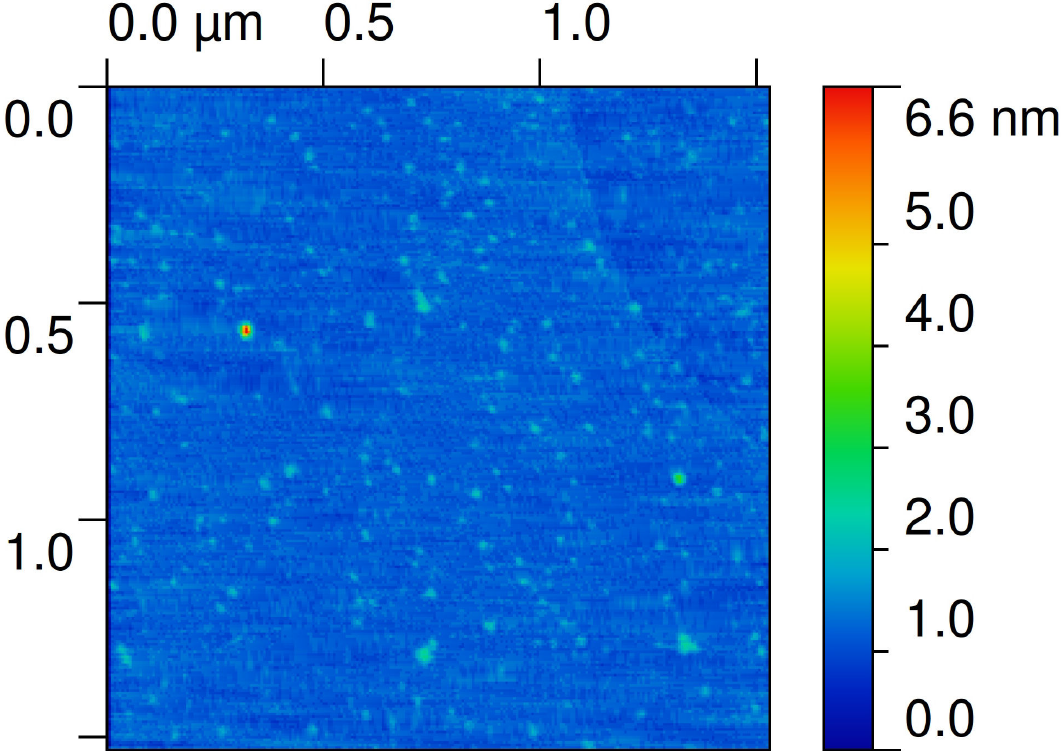
Figure 1. AFM image of CNPs (from the supernatant) on mica. Note that most particles are 1 nm heigh.
Moreover, 1.5 ml of the supernatant (5 min after synthesis) were poured into a standard plastic cuvette (with a 1 cm trajectory) for subsequent standard light transmission measurements as a function of time after the LAL.
Furthermore, after having allowed the dispersion to sediment for about 2-4 hrs the sedimented CNPs and the supernatant were deposited onto optical glass slides for subsequent Raman spectroscopy analysis. Raman spectroscopy was performed using a Renishaw “InVia" spectrometer, a laser excitation wavelength of 532 nm, an objective of x 20 and approximately 0.3 mW at the sample spot. The fitting of the Raman bands was performed using Lorentzian functions for all peaks, where the peak ratios correspond to integrated intensity ratios (if nothing else is specified). Further, the raw spectra for the non-sedimented CNPs reveal a background, which increase with Raman shift and has been subtracted before peak fitting.
3. Results and discussion
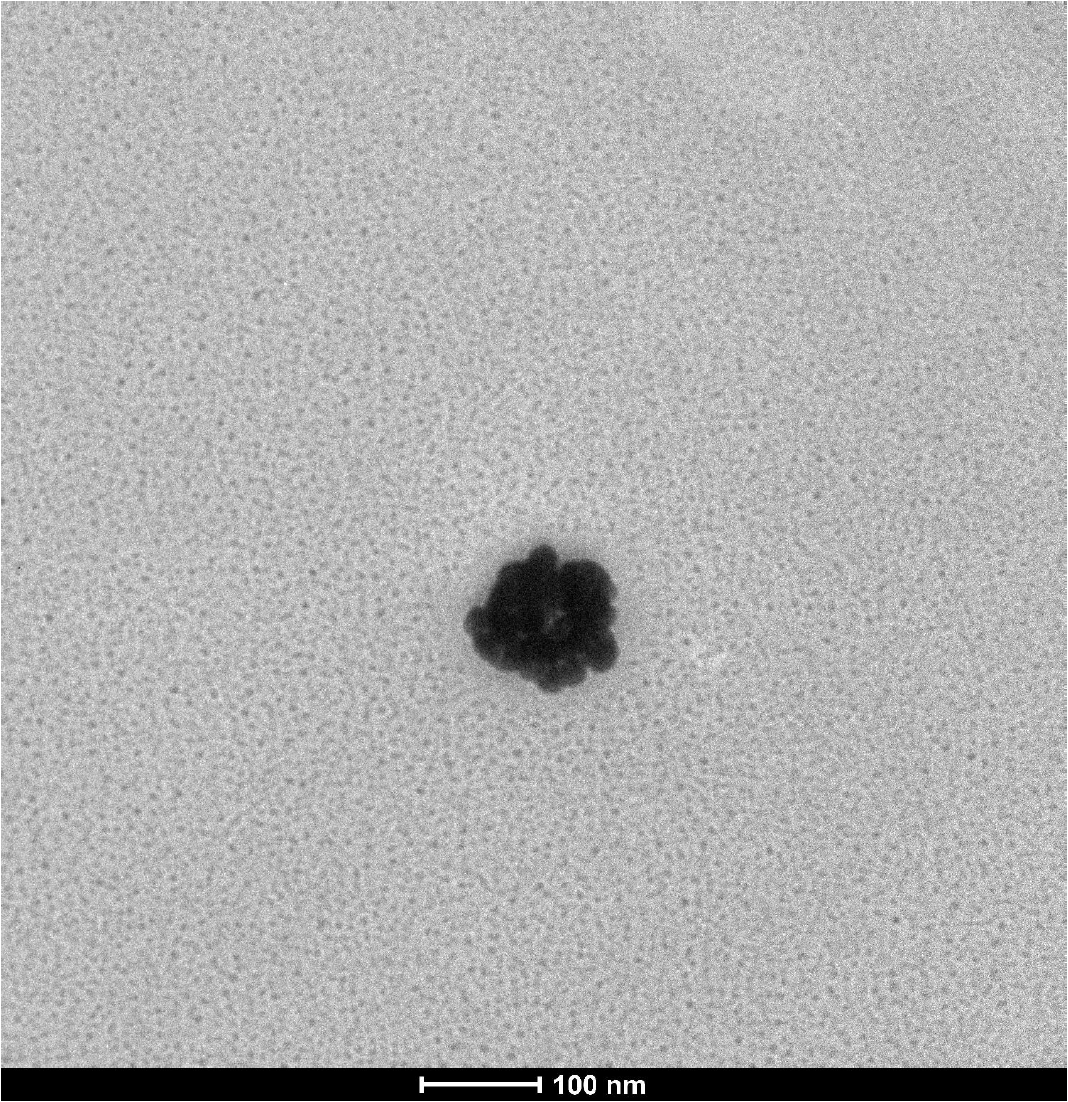
As revealed in Fig. 1, most CNPs deposited on mica (spin coated sample) exhibit a height above the mica surface of the order of 1 nm, although there are some CNPs with heights on the order of 10-30 nm. Quantification of the AFM images reveals a shift of the height distribution towards larger particle heights in sequential order for the samples prepared by spin coating, air drying and air dried after 24 hrs aging. It should be mentioned that heights less than 3 nm are not incorporated in the analysis presented in Fig. 2, because quantification of the number of image pixels that represents real particles was difficult to perform for heights below 3 nm since noise is of the same order of magnitude. Despite this complication, it is possible to semi-quantitatively identify the range of heights for most particles. The second moment (variance) of the height distribution describes the width of the distribution and should increase with aggregation. Hence, the variances for the distributions associated with the spin coated, air dried and aged 24 hrs/air dried samples are 66, 77 and 119 nm2, respectively. It is expected that particles will aggregate during the air drying process, thus the variance for the air dried sample is expected to be larger than for the spin coated sample. If, in addition, the carbon particles are allowed to aggregate for 24 hrs before being deposited on mica, and subsequently allowed to air dry, the particles will have a higher degree of aggregation and the variance is thus expected to be larger (as observed). Moreover, Fig. 3 shows a TEM image of CNPs deposited (2hrs after LA) on a membrane, which reveals an aggregate consisting of particles with sizes of about 20 nm surrounded by many smaller particles
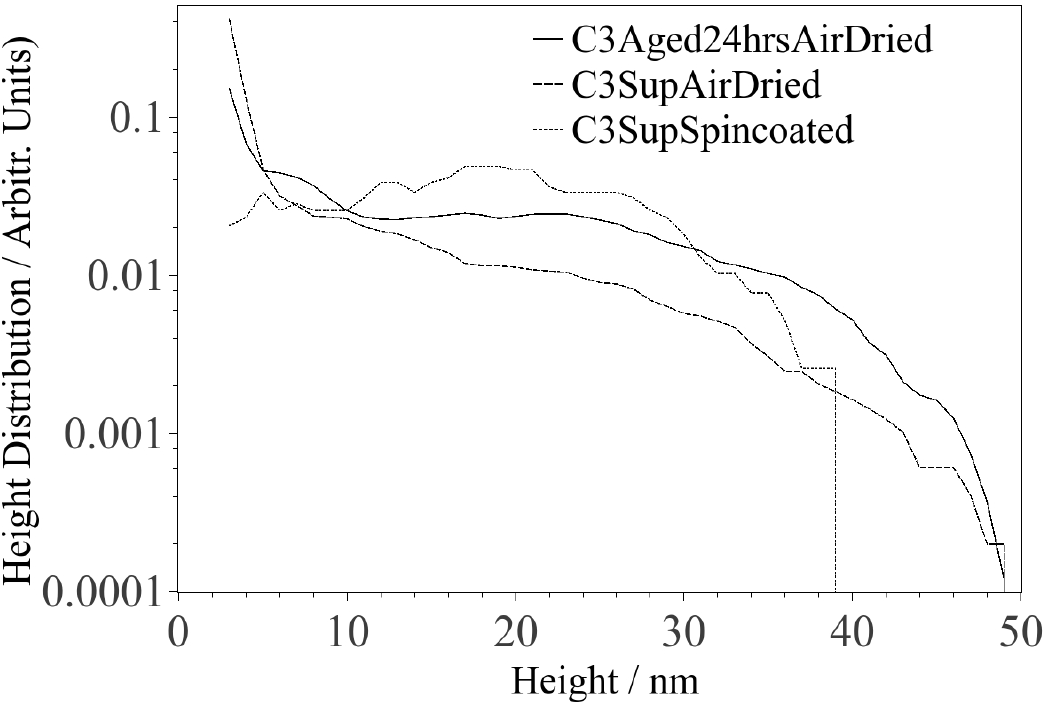
Figure 2. Height distributions of CNPs deposited on mica by spin coating, air drying and air drying after 24 hrs aging.
Optical transmission measurements of the CNPs in water, Fig. 1 (supporting information), were performed for different times (after synthesis): 15 min, 45 min, 24 hrs and 5 days. A relatively rapid increase in transmission with time is observed over the whole range of wavelengths. Thus, we attribute the increase of transmission to aggregation of small particles into larger ones, which eventually undergoes sedimentation. Normally, the presence of surfactants delays or inhibits the aggregation of nano-particles, which also is the case for graphite17, NCDNPs18 and nano-horn19 CNPs. Indeed, when synthesizing CNPs by LAL in the presence of SDS, the increase in transmission is delayed, Fig. 2 (supporting information), although eventually aggregation appears to occur (as confirmed also by sedimentation). The inability to inhibit aggregation and subsequent sedimentation could be due to the small particle sizes (
The G-band (1500-1600 cm-1) in the Raman spectra, is due to the presence of sp2 carbon networks and the D-band (
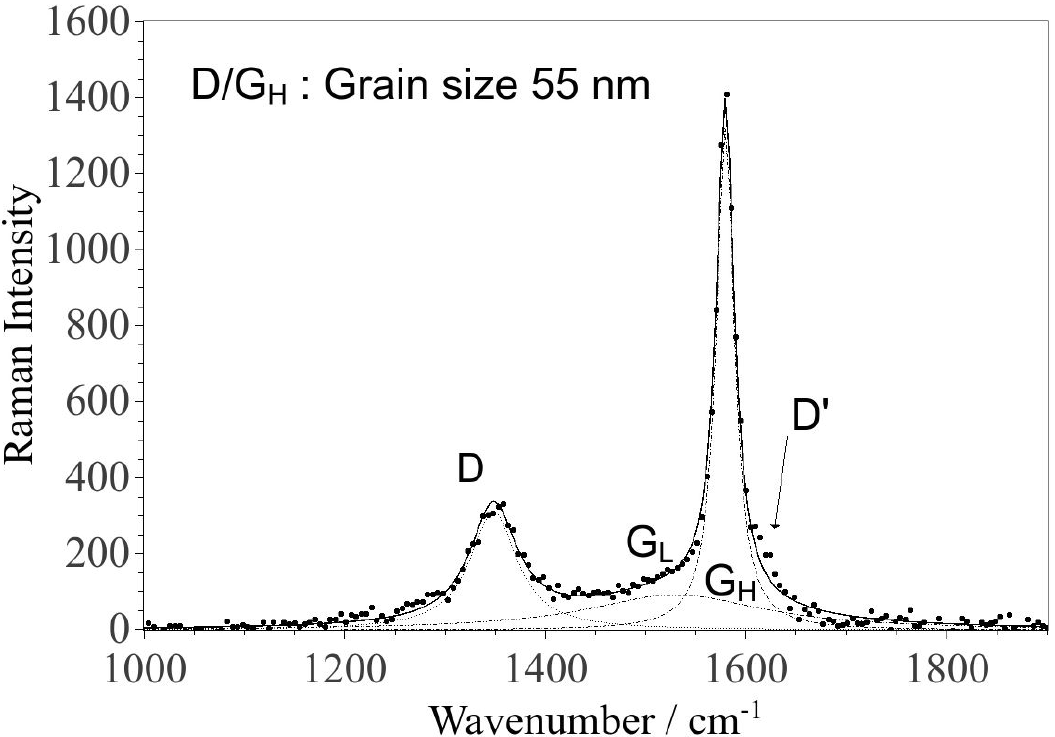
Figure 4. Raman spectrum of the sedimented CNPs deposited on glass. The fitting was performed using three Lorentzian functions. The parameters for each component are given in Table I.

The G-band of the particles in the supernatant (Fig. 5) is significantly different from the sedimented particles and is well fitted with two components with frequencies of 1535 and 1577 cm-1 (and a peak at
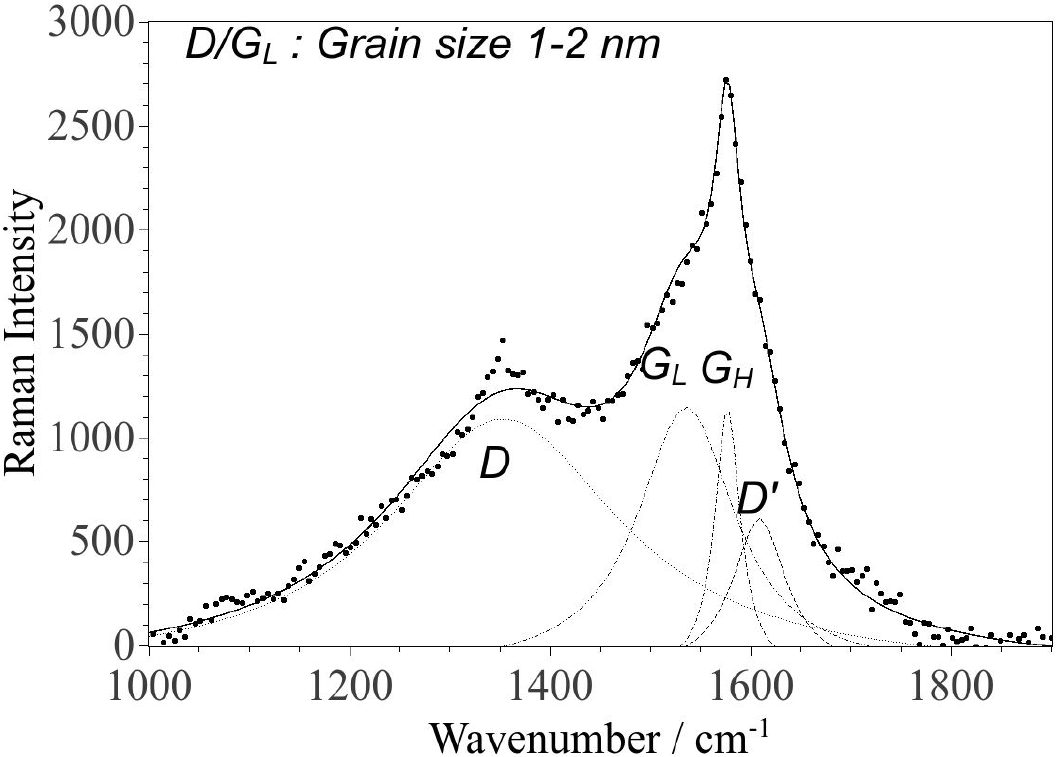
Figure 5. Raman spectrum of the CNPs from the supernatant deposited on glass. The fitting was performed using four Lorentzian functions. The parameters for each component are given in Table II.
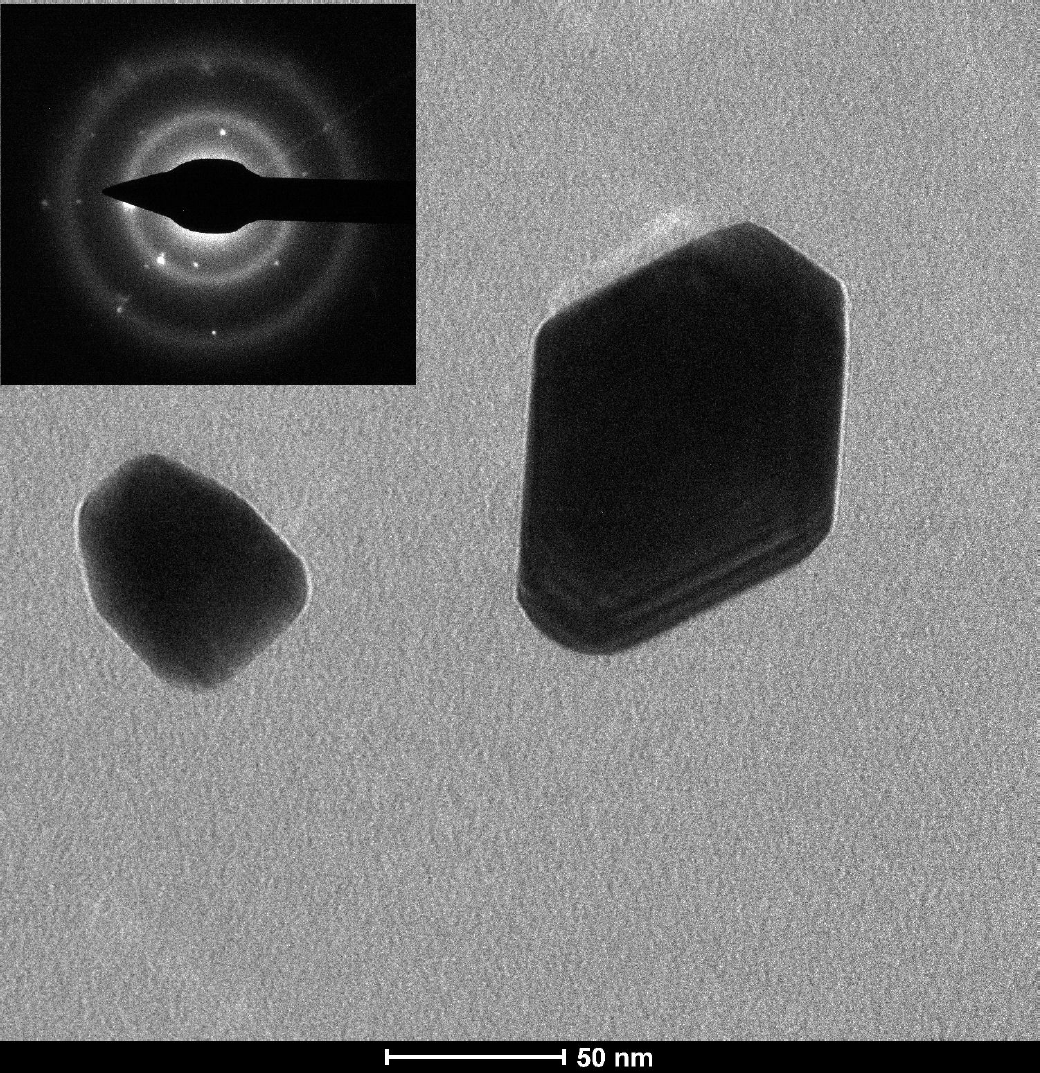
Figure 6. TEM image of a graphite CNPs from the supernatant. The inset depicts a SAED image from the large particle.
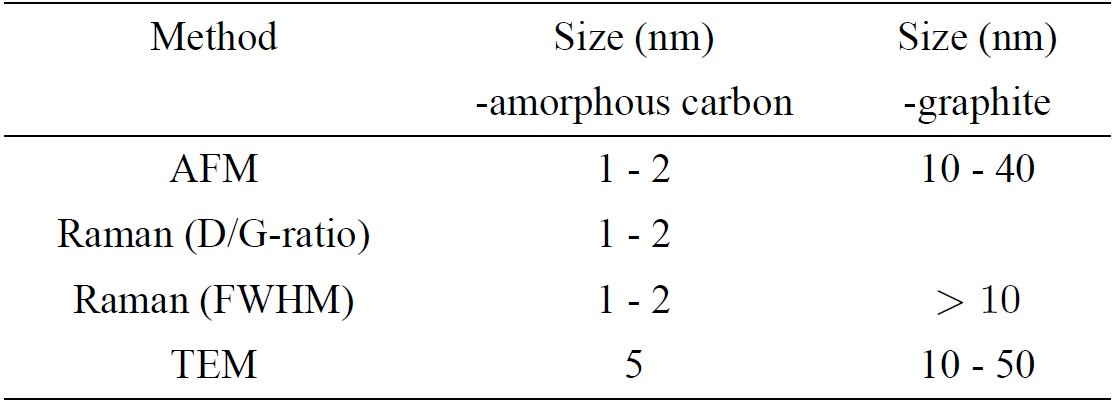
The FWHMs of the GL and GH components (Table II) suggest an sp2 grain size of the order of 1-2 nm (in agreement with the D/GL- ratio of 2.2) and at least 10 nm, respectively21. This analysis of the Raman spectrum (Fig. 5/Table II) is in good agreement with the AFM images (spin coated sample in Fig. 1 and Fig. 2) and the TEM images (Fig. 3, 6) for the particles in the supernatant, where most particles are in the 1-2 nm range (AFM) and 5 nm (TEM). This size range is in agreement with similar recent observations of LA of graphite in liquid26. Note that the TEM images suggests larger sizes, but the size ratio between the smaller and larger particles coincides with AFM and Raman observations, which could be explained if the particle shapes have a tendency of being oblate with their major faces oriented towards the supporting mica/membrane. The observed larger grain size associated with the GH component correlates well with the height distribution of the deposited CNPs on mica (Fig. 2) and TEM images (Fig. 6), in particular for the spin coated sample. Hence, small particles (1-2 nm) consisting of amorphous sp2-rings coexist with larger particles consisting mostly of graphite-like carbon and possibly some amount of carbon with sp2-chain configuration with small D-band contribution. In Table III the characteristic particle size determinations, for CNPs in the supernatant, by the different methods are shown. It should be mentioned that the G-band varied slightly depending on where the incident laser spot (from the excitation laser) was positioned on the sample with particles from the supernatant, i.e. the relation between the four Lorentzian peaks varied slightly with position, which implies the presence of two or more phases among the non-sedimented particles (consistent with the presence of both GH and GL components).

Table III. Characteristic size parameter from data analysis of CNPs obtained by different methods for particles in the supernatant. Note that AFM do not reveal structure, although we have attributed the two particle ranges to different phases according to Raman and TEM observations.
The formation of CNPs in water could possibly result in hydrogenation of amorphous carbon (a-c:H). The Raman bands for the CNPs in the supernatant reveal an increasing background (subtracted in Fig. 5) with Raman shift due to photoluminescence, which normally occurs for a-C:H. However, based on previous work on a-C:H27, we conclude that the FWHM and peak-position for the components in Table II are not consistent with a-C:H (in any known form). Note that, luminescence has been observed from acid functionalized CNPs with a graphite-like structure28. Furthermore, evidence for a transition from normal vaporization to phase explosion has been obtained for laser ablation of several materials (including graphite in vacuum), showing a dramatic increase in the ablation rate at the threshold fluence of 22 J/cm2 for graphite29. This suggests that the large particles that undergo sedimentation in the present work could be the result of phase explosion and the smaller particles a result of normal vaporization. However, further work is required to confirm this hypothesis.
4. Conclusions
Raman spectroscopy has been used to investigate CNPs synthesized by laser ablation of graphite in water. Large graphite-like particles of a size between 10 and 100

