


 text new page (beta)
 English (pdf)
 Article in xml format
 Article references
 Send this article by e-mail
 Cited by SciELO
  Similars in
SciELO
Similars in
SciELO 
 Permalink
PACS: 61.43.Fs; 66.30.-h; 66.30.jj; 66.55.Nq; 82.80.Ms
1. Introduction
In 1960 Friedman and Smith1 suggested a new method for dating of obsidian artifacts. The original obsidian hydration dating method relies upon measuring the water diffusion depth in a freshly created obsidian surface and converting thickness measurements to an age. The hydration rim can be examined in an optical microscope or by the Secondary Ion Mass Spectrometry (SIMS) method 2,3. As an “archaeological equation” relating the artifact age t and the hydrated layer L, Friedman and Smith suggested the parabolic equation 1:
where D is the diffusion coefficient that depends on the temperature in the local site and on the obsidian composition.
Obsidian artifacts are widely distributed in Mesoamerica, USA, Japan, Oceania, and for this reason the obsidian hydration dating method (OHD) was met with great enthusiasm. However, it was difficult or even impossible to explain serious discrepancies between experimental facts accumulated during the last 55 years by the original OHD model. Serious discrepancies between the OHD results and the chronological data obtained by other methods were reported 4,5,6. The diffusion coefficients obtained in laboratories by the intrinsic rate method 7,8 were found to differ from the coefficients calculated for archaeological artifacts by the radiocarbon calibration9. Some authors noted discrepancies between their experimental data and Eq. (1) 9,10. All this gave rise to doubts in the physical basis of the OHD method 4,9,10. Among other alternatives, penetration of atomic hydrogen rather than water into obsidian was suggested 10,11.
We performed hydration of obsidians at different temperatures and during different times in vapors of isotopic water 1H2
18O with 97% of the 18O isotope. The idea of this experiment is evident: if there is water diffusion into the obsidian, as the conventional model suggests, the depth distributions of hydrogen and 18O measured by SIMS should strongly correlate or coincide. Our experimental temperature range was chosen to be from 75 to 200°C; i.e., high enough to accelerate the hydration process and get an adequate hydration experiment time, but far from the obsidian transition temperature of
2. Experimental
Experimental obsidian samples about 3 x 5 x 2 mm in size were cut by a diamond saw from a big obsidian rock found in Cerro de las Navajas, Central Mexico (see Fig. 1A). Then the samples (Fig. 1C) were polished by the standard technique; we used sequentially meshes of 800 grits, 1200 grits, and 1600 grits, and then finished with a cloth and a 1-micron diamond paste. The sample hydration was performed in standard 1.33-inch conflate nipples sealed with copper gaskets which supported heating up to 250°C (see Fig. 1B). The top flange was drilled, a hole was threaded, and a stainless steel screw was used to hang up the obsidian samples with a Teflon wire. Therefore, any contact of the samples with water and with the walls was avoided. Before tightening the screws, thus fixing the top flange with the samples, approximately 500 milligrams of isotopic water with 97% of the 18O isotope from Sigma Aldrich (p/n 329878-1G) was poured on the nipple bottom. Then the nipple with the obsidian sample was loaded vertically into an oven with a digital temperature controller pre-heated to the desired temperature where it was kept for the time from 2 days (200°C) and up to 5 months (90°C). After hydration the sample was withdrawn from the nipple, cleaned in alcohol in an ultrasonic bath during 5-10 minutes, and dried in a dry nitrogen flux. Then the sample was fixed in a special sample holder and loaded into a load-lock camera of the SIMS instrument for more than 8 hours and pumped down to 10-6 Pa. The hydration experiments were repeated for each temperature to confirm a reproducibility of the method. The list of the experimental samples with the time and the temperature of hydration anyone can find in the Table I.
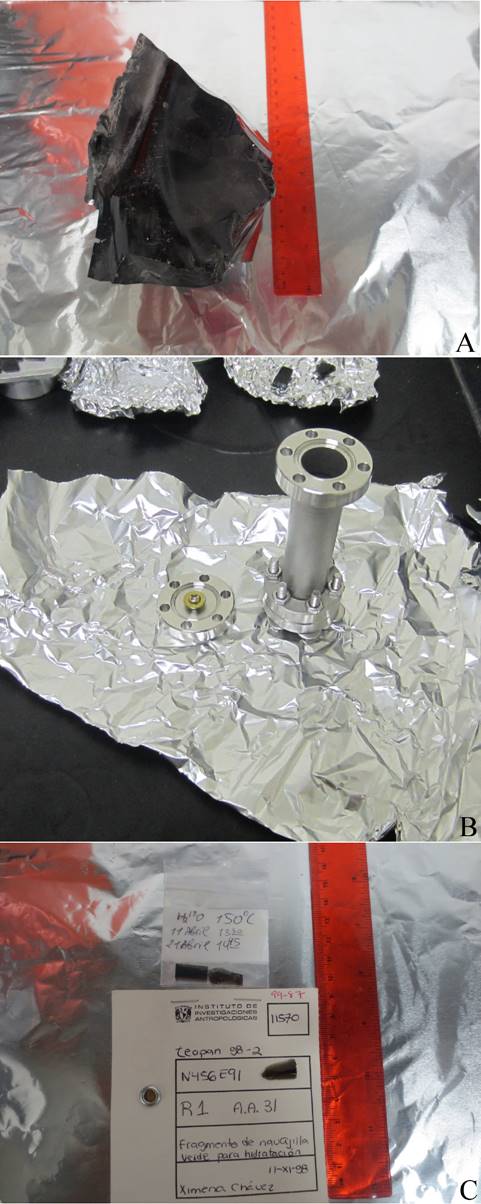
Figure 1. Photos of obsidian rock (A); 1.33” Conflate nipples (B) used for sample preparation; archaeological (above) and hydrated in laboratory (below) experimental samples (C).
The chemical composition of the obsidian samples was analyzed independently by the XRF method at the Geoarchaeological XRF Laboratory, NM, USA. Table II shows concentrations of the main components detected by XRF.
Table II. Chemical composition of the obsidian rock used for laboratory hydration determined by XRF, in weight percent. Only the main oxides are listed in the Table.

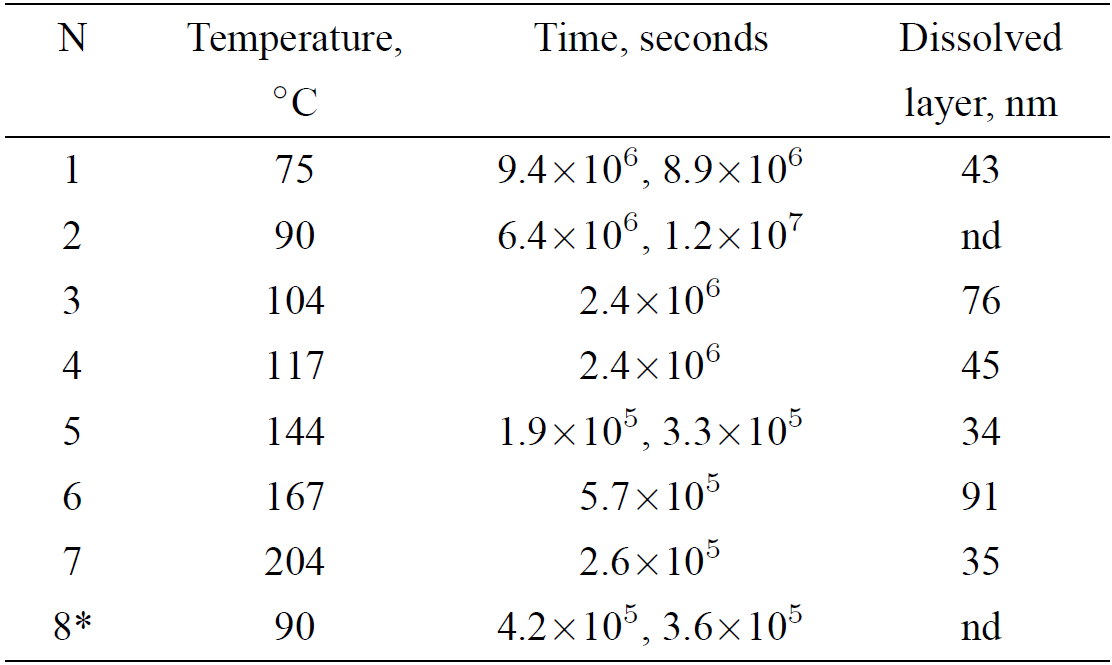
It is well known that the water-obsidian interaction results, among other effects, in dissolution or weathering of the obsidian surface. We examined the dissolution of obsidian during our hydration experiment by covering a part of the experimental sample surfaces with a 100 -nm gold film. In our experiments with different temperatures the dissolved layer did not exceed 91 nm at 167°C (see Table I), which was negligibly small as compared with the few-micron depth of penetration of 18O and 1H observed in our experiments.
We performed as well a “de-hydration” experiment. One set of obsidians was hydrated at 90°C during two months and another set was hydrated at 200°C during two days. And then the first set of obsidians was heated in vacuum during two months at 0.08 MPa, and the second one was heated during 8 hours under a high vacuum of 10-6 Pa.
Several obsidian artifacts found in Teopancazco (Teotihuacan, Mexico) were analyzed by SIMS to compare with the laboratory hydrated samples.
The depth profiling analysis of the hydrated obsidians was carried out with a TOF-SIMS V instrument from Ion-TOF GmbH. A double ion beam irradiation regime was used for the measurements. Ion sputtering of the sample surface was performed by a 2 keV cesium ion beam at 45° with respect to the surface normal. The ion current reached 150-170 nA. The SIMS analysis was performed with a pulsed Bi+ ion beam with an ion energy of 30 keV and angle of incidence of 45° with respect to the normal incidence. The bismuth ion current was varied from 0.2 to 1.2 pA. The cesium beam sputtered a raster of 300x300 microns; whereas the bismuth beam scanned a 100x100 micron raster at the center of the cesium sputter crater. Secondary negative ions emitted from this 100x100 micron area were separated by mass during their flight in a reflectron-type mass analyzer. The ion irradiation of obsidians (as well as any dielectric) resulted in the surface charging effect, which did not allow us to continue the analysis. To compensate for the arising positive surface charge, we used a flood electron gun with an electron beam current of 10-20
After hydration and SIMS depth profiling experiments we measured the experimental craters as well as gold steps by a surface profiler Dektak-XT from Bruker with an experimental error of 4%.
3. Experimental Results and Discussion
Figure 2A-F shows depth distributions (concentration vs. depth) of 1H and 18O in several obsidians hydrated at different temperatures. Figure 2G shows 1H and 18O depth distributions in the archaeological obsidian artifact found in Teopancazco with an estimated age of around 300 A.D.
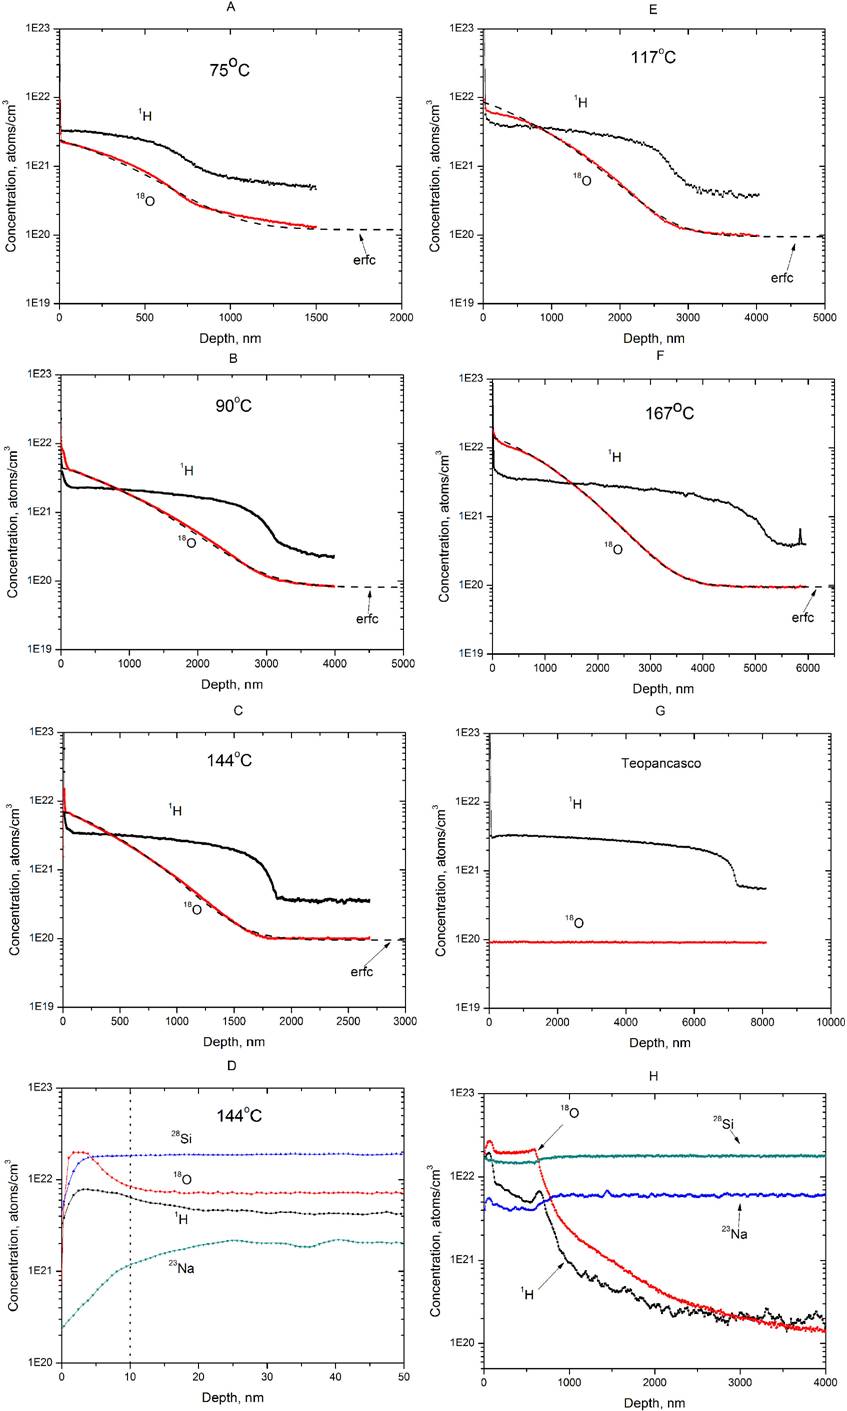
Figure 2. SIMS depth profiles for 1H and 18O in the obsidians hydrated in vapors of isotopic H2 18O water at different temperatures. SIMS depth profiles for 1H and 18O in the obsidians hydrated in vapors of isotopic H2 18O water at 75°C (A), 90°C (B), 144°C (C and D), 117°C (E), and 167°C (F) in comparison with the “naturally” hydrated archaeological obsidian artifact from Teopancazco (G) and with a soda-lime glass sample hydrated at 90°C (H) during two months.
First of all, we note radically different distributions of hydrogen and 18O, which result, in our opinion, from two different physico-chemical processes. The hydrogen distribution, called the S-curve, is similar to those observed by other authors for laboratory-hydrated samples and for different archaeological samples3,9,12. The 18O distribution is well fitted by the complementary error function presented in Fig. 2A-F by dashed lines. This function is the solution of the Fick’s equation for a semi-infinite volume in the case of diffusion from a thin layer with a constant diffusion coefficient13:
where C 1 is the 18O isotope concentration in the top surface layer saturated with the isotopic water, and C o is the 18O concentration in the obsidian volume due to an intrinsic oxygen.
Second, there is a top surface layer with a thickness of about 10 nm with high 18O and hydrogen (or, probably, water) concentrations (see Fig. 2D). A slight leaching in this layer is observed (see the sodium depth distribution in Fig. 2D).
The experimental SIMS data can be interpreted if we assume that water molecules penetrate into the top surface layer alone, and then water molecules decompose into oxygen and hydrogen atoms due to chemical reactions14,15, and (or) due to the water electric dipole interaction with local charges in obsidians reported by Morita et al.16. After this the atomic hydrogen and 18O isotope penetrate into the obsidian. The difference between the hydrogen and 18O distributions increases with temperature; the top surface concentrations of 1H and 18O increase with temperature as well. These facts suggest that (i) the water concentration and also water decomposition at the obsidian surface grow with temperature, (ii) the two processes involved in the penetration of 18O and 1H atoms into the obsidian volume have different activation energies. Thus, we arrive at the conclusion that the original obsidian hydration model is incorrect. Atomic hydrogen rather than water penetrates into the obsidian and forms a hydrogenated layer which has been identified so far as a “hydrated” layer.
We repeated the hydration experiment for a soda-lime glass sample. The hydration was performed at 90°C during 2 months. Similar depth distributions of 1H and 18O in this sample are presented in Fig. 1 H, therefore the hydrated layer formation up to approximately 1-micron depth is observed. As demonstrated earlie17,18, water penetrates into the soda-lime glass due to the ion exchange reaction between alkali oxides and water molecules.
The 18O self-diffusion coefficients were obtained for different temperatures by approximating the experimental 18O distribution by Eq. 2. Figure 3A shows a linear fit of experimental diffusion coefficients by the Arrhenius equation:
where T is the temperature, E
act
is the activation energy; D
o
is the pre-exponential coefficient; and
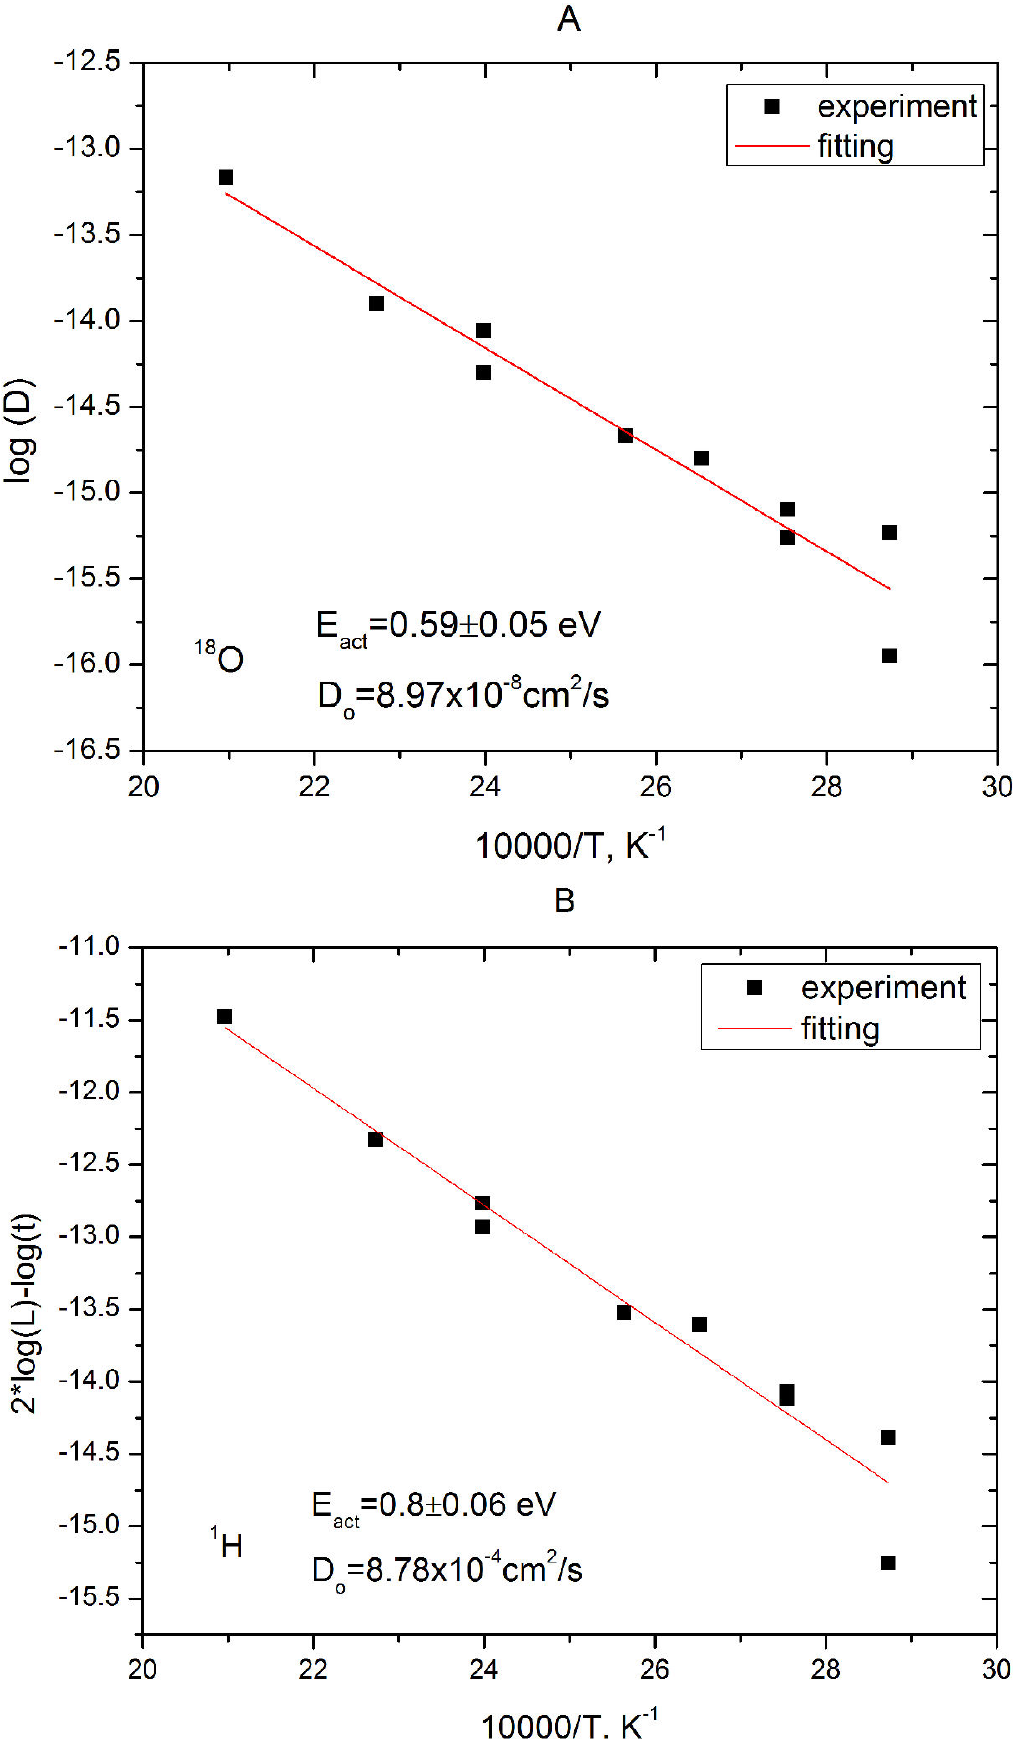
Figure 3. Arrhenius plot for 18O (A) and 1H (B) diffusion coefficients at temperatures from 75 to 204°C.
In the case of hydrogen we obtained hydrogen diffusion coefficients from the SIMS data by using Eq. (1). The hydrogenated layer thickness was defined as the depth of the inflection point, where a minimum in the first derivative of the hydrogen profile was observed10. This point was observed at the depth where the hydration curve changed from being concave downward to concave upward. Figure 3B shows the Arrhenius plot for the hydrogen diffusion coefficients. The activation energy for the hydrogen diffusion was found to be 77.6 kJ/mol, i.e., it was in a reasonable agreement with the earlier reported activation energies for “water diffusion” in obsidians which varied for different obsidians from 80 kJ/mol to 90 kJ/mol8. The pre-exponential coefficient for the hydrogen diffusion was D 0 = 8.78 x 10⁻⁴ cm2/s, which was four orders of magnitude higher than for 18O. The obtained differences in the activation energies and the pre-exponential coefficients for hydrogen and 18O confirm that different physical-chemical processes occur for these elements.
Thus we established that the water-obsidian interaction results in the obsidian hydrogenation rather than hydration. But it is still unclear: what is the mechanism of hydrogen penetration into the obsidian? There are at least two possibilities: (i) a complex diffusion of hydrogen with the diffusion coefficient depending on the H concentration; and (ii) a solid state reaction between atomic hydrogen and a glass network. At the moment we have two arguments speaking in favor of a chemical reaction. The first is the absence of hydrogen effusion from hydrogenated obsidians. Riciputi et al.10 mentioned that when hydrogenated obsidians were kept over 300 hours under ultrahigh vacuum (<10-6 Pa) at room temperature, only a slight change in the hydrogen concentration in the top surface layer of less than a 100 nm depth occurred. In our study the heating of preliminarily hydrogenated obsidian in vacuum during two months at 90°C and eight hours in UHV at 200°C led to a slight change in the hydrogen concentration in a top surface layer of 0.5-2
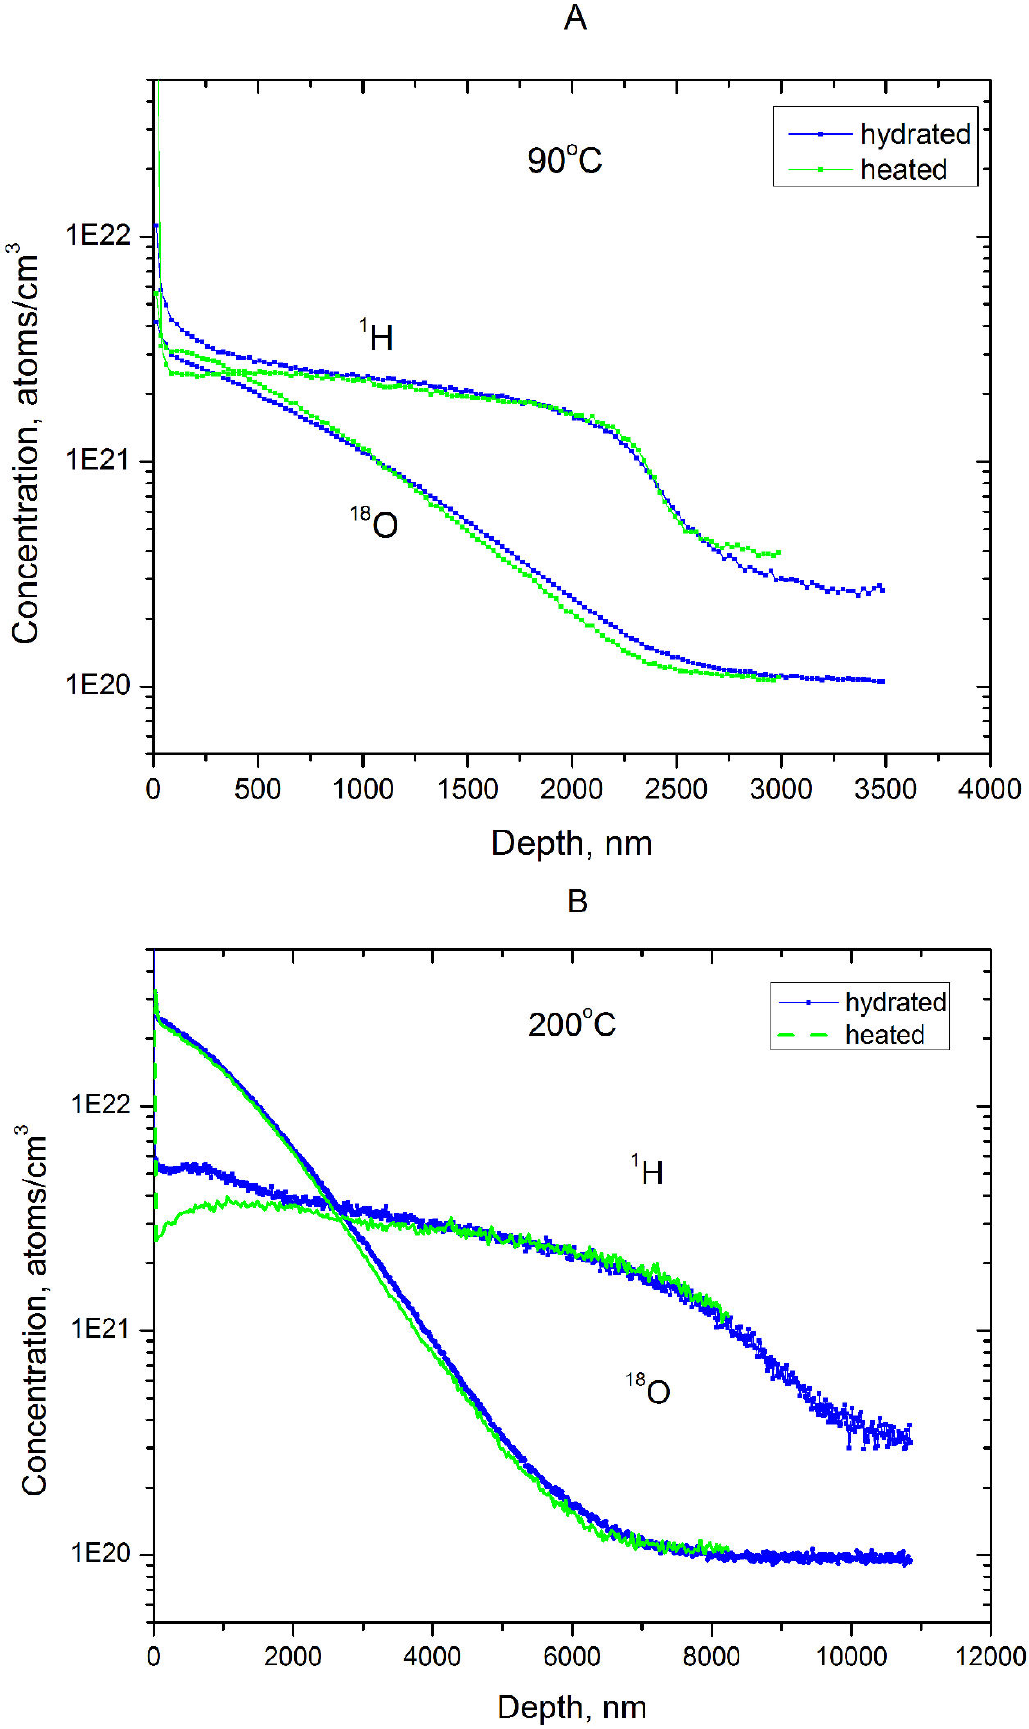
Figure 4. SIMS depth profiles of 1H and 18O in the obsidian sample hydrated in vapors of isotopic H2 18O water at 90°C during two months and then heated in vacuum (0.08 MPa) at 90°C during two months (A). The same for another sample hydrated at 200°C during two days and heated at 200°C in high vacuum (< 10-6 Pa) during 8 hours (B).
Second, many scientists use IR spectroscopy to analyze obsidians and demonstrate a growth in the O-H and H-O-H signals in the IR spectrum with hydration time19. After Doremus 20, the interaction of water with silicate glasses is considered in terms of the diffusion-reaction model, which addresses water molecule interaction with silicon oxide with the formation of silicon hydroxide. In our case it could be the reaction of atomic H with those O2- ions of the glass network that are shared (bridging) between adjacent (Al,Si)O4 tetrahedra to produce OH- ions21. From other hand we should take into account a possible interaction of NaAlSiO x (KAlSiO x ) complexes with H atom resulting in formation of hydroxide of sodium and potassium22. We observed a growth in the hydrogen concentration in the hydrogenated layer with temperature. In our opinion, this indicates that a change of the reaction type of hydroxides formation occurs at elevated temperatures (>100°C).
We have found that the water-obsidian interaction is a more complex process than that suggested earlier. During the initial period of the water-obsidian interaction the hydrogenation rate should strongly depend on the water splitting reaction and atomic hydrogen formation in the top hydrated layer of the obsidian. In this case the hydrogenated layer thickness should be linearly proportional to the time of treatment. Whereas for a long enough time the hydrogenation reaction becomes limited by the hydrogen diffusion to the hydrogenated layer - obsidian volume interface, and the growing layer thickness should be proportional to the root square of the treatment time23. So, the “archaeological equation” for the obsidian hydrogenation can be drawn as a linear-parabolic equation:
where k v is the constant characterizing the diffusion-limited reaction of atomic hydrogen with a glass network; and k s is the constant characterizing the surface water - glass reaction kinetics and efficiency of the atomic hydrogen formation in the top surface layer. Equation (4) is well known in the chemical community after Evans24; it is applied effectively, among others, to the oxide growth kinetics description. It is important to note here that the linear-parabolic equation was already suggested for obsidian “hydration” dating25,26. Riciputi et al.10 demonstrated that the linear-parabolic equation fitted very well their experimental obsidian dating for Chalco obsidians. This is, no doubt, an important and reassuring result from the point of view of perspectives of the new “archaeological equation” (4) for OHD.
The last but not the least remark is as follows. We observed experimentally the low-temperature water decomposition at the obsidian surface and hydrogen accumulation inside the obsidian up to a concentration of about 10 atomic %. These two experimental facts indicate that alkali-aluminosilicate glasses can be regarded as promising materials for hydrogen fusion cells due to their low cost as compared with rare-earth oxides and noble metals used at present.
4. Conclusions
In conclusion we would like to summarize the obtained results. We experimentally confirmed decomposition of water molecules at obsidian surface and atomic hydrogen penetration inside the obsidian with formation of the hydrogenated layer. However, contrary to the conventional model this hydrogenation layer is a result of a solid-state chemical reaction between hydrogen and glass network. We found experimentally the activation energy for the hydrogenation process, as well as for 18O self-diffusion in obsidian. And finally, we suggest the linear-parabolic equation as the new archaeological equation for Obsidian Hydrogenation Dating method.

