


 text new page (beta)
 English (pdf)
 Article in xml format
 Article references
 Send this article by e-mail
 Cited by SciELO
  Similars in
SciELO
Similars in
SciELO 
 Permalink
1. Introduction
The study of diluted magnetic semiconductors has been the subject of interest in recent years, because of their potential use in spin electronic (spintronic) devices1. ZnO is a salient semiconductor compound having a wide and direct energy gap of the order of 3.36 eV, equivalent to that of GaN. Work on ZnO predicted ferromagnetism with Curie temperature, Tc above room temperature in p-type GaN and ZnO doped with a metal of transition by means of field theory2. ZnO is a famous semiconductor belonging to the family II-VI, is known for its excellent semiconducting properties, ZnO doped with a transition metal combines properties magnetics, opticals and electrics being a potential candidate for the creation of novel devices. FM properties have been observed in Ni-doped ZnO (at concentrations of 3-25%) at temperatures below 30 K, however, superparamagnetic behavior was observed up to 300 K3. Experimental results of magnetic and optical properties in nanoparticles Ni doped ZnO is not completely understood and thus needs more investigation4,5.
We present in this work, a study of the magnetic and optics properties of Ni doped ZnO, nanopowders obtained by sol-gel self-combustion by using citric acid as fuel6.
2. Experiment
Nanoparticles of Ni doped ZnO, Zn (1−x) Nio 𝑥 O (𝑥=0−0.05) was synthesized by sol-gel combustion method, using the nitrates of Zn (Zn(NO 3 ) 2 6H 2 O) and (Ni(NO 3 ) 2 6H 2 O) taken in the right ratio using citric acid (C 6 H 8 O 7 ) as the fuel. The precursors, nitrate of Zn and nitrate of Ni were taken in stoichiometric amounts and dissolved separately in distilled water; later on both solutions were mixed under constant stirring during 20 min at room temperature. To the above mixed solution a water solution of citric acid was added. This final solution was kept over a hot plate at 80 ∘ C during about four hours, after the complete evaporation of water the solution was converted into “gel”. This “gel” was introduced in a furnace previously heated at 500 ∘ C where the autoigniting process occurred.
The microstructures of the as-synthesized powder samples were characterized by the power X-ray diffraction (XRD) analysis using a PHILLIPS diffractometer, model PW1250/25 with Cu K𝛼 radiation. Fourier transmission infrared spectra were taken by using a Fourier Perkin-Elmer Spectrometer in the range of 350 to 4000 cm −1 . The microstructure was characterized by a FEI TECNAI T20, transmission electron microscope. The room temperature absorption spectra were recorded in the 350-525 nm ranges by using a Spectra Pro-500 Acton Research Co. spectrometer. Magnetic behaviors were measured in a commercial MPMS XL, Quantum Design magnetometer.
3. Results and discussion
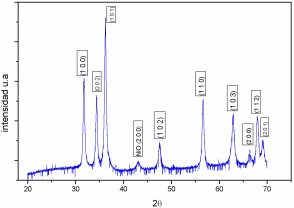
The powder XRD pattern of Zn 1−𝑥 Ni 𝑥 O (𝑥=0.05) sample is shown in Fig. 1. The XRD analysis reveals that this sample exhibits the wurtzite structure that is known ZnO structure. This result confirms that the ZnO wurzite structure has not been modified with the Ni-doping. An reflection (200) of NiO crystalline structure was detected, indicating that Ni-doped ZnO was formed along with NiO phase. The lattice parameter obtained by the program NBS-L gives: 𝑎=3.250 (6) Å, 𝑐=5.200 (2) Å, values very closed to previous reported values7,8,9.
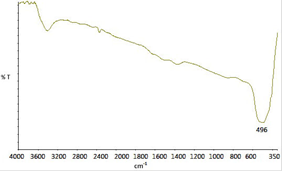
Infrared transmittance spectra were employed to study that vibration bands due to Zn-O bond and the changes due to Ni substitution in its structure. The absorption band observed at 496 cm −1 is attributed to the stretching mode of Zn-O in the tetrahedral coordination. Two more significant bands are at 3570 cm −1 and 2400 cm −1 , the first one could be assigned to O-H vibration modes, and the second to absorption energy by the bonding in CO 2 molecules10,11. Some others bands at around 3000 cm −1 and 1500 cm −1 could correspond to asymmetric and symmetric to C=O stretching modes12.
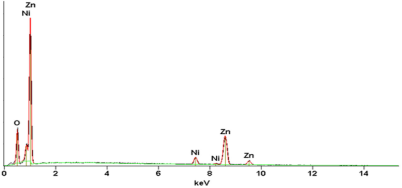
The EDS analysis of Ni doped ZnO it was carried out to establish purity of the sample and confirm presence of Ni. The observed EDS pattern is shown in Fig. 3. It is noticed that the sample prepared contain only Zn, Ni and O. Thus the nanocrystals are found to contain no spurious contamination. The ratio of the atomic percentage of the elements present in the sample complies with the quantity taken for their synthesis.
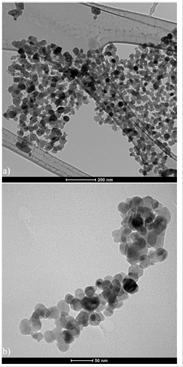
In order to learn more about the microstructure of Ni doped ZnO prepared by sol-gel autocombustion, transmission electron microscopy was done. TEM bright field images of Ni doped ZnO are shown in Fig. 4(a) it can be seen that the nanoparticles are rounded, presenting some degree of agglomeration due to the dipole-dipole interactions. In Fig. 4(b) it is possible to see nanoparticles of undoped ZnO. The shape looks also to be rounded. Grain size distribution was estimated using the program IMAQ-vision builder and characterized by a distribution Log Normal type (solid line) in Fig. 4(a) with an average grain size of 31 nm and standard deviation of about 35%. For the sample undoped ZnO the obtained average size was 26 nm.
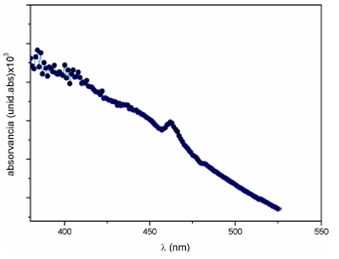
The optical absorption spectra of the Ni doped ZnO sample, obtain by an UV-visible spectrophotometer in the range 330-525 nm is shown in Fig. 5.
Figure 5 represents the variation of absorbance with wavelength of Ni doped ZnO nanoparticles. It is evident that absorbance decreases in the visible region and increases in the ultraviolet region. But in the visible region it is possible to see an strong absorption peak which may be due to absorption by Ni 2+ present in the doped sample13.
The energy band gap is determined by using the relationship: 𝛼=𝐴(ℎ𝜈−𝐸𝑔 ) 𝑛 where: ℎ𝜈: photon energy, 𝛼: absorption coefficient (𝛼=4𝜋𝑘/𝜆); 𝑘 is the absorption index or absorbance, 𝜆 is wavelength (in nm), 𝐸𝑔: Energy band gap, 𝐴: Is a constant, 𝑛=1/2 for allowed direct band gap.
Exponent 𝑛 depends on the type of transition and it may have values of 1/2, 2, 3/2 and 3 corresponding to the allowed direct, allowed indirect, forbidden direct and forbidden indirect transitions respectively14. The room temperature spectra (𝛼ℎ𝜈) 2 vs. photon energy (ℎ𝜈) of the Ni doped ZnO nanoparticles presented in Fig. 6(a) could be compared to the spectrum obtained for the undoped ZnO reference sample 6(b). The value of band gap was determined by extrapolating the straight line portion of (𝛼ℎ𝜈) 2 = 0 axis, as shown in Fig. 6. The obtained band gap for the doped ZnO is about 2.54 eV while Fig. 6(b) shows the band gap value for undoped ZnO, 2.76 eV for R.T.
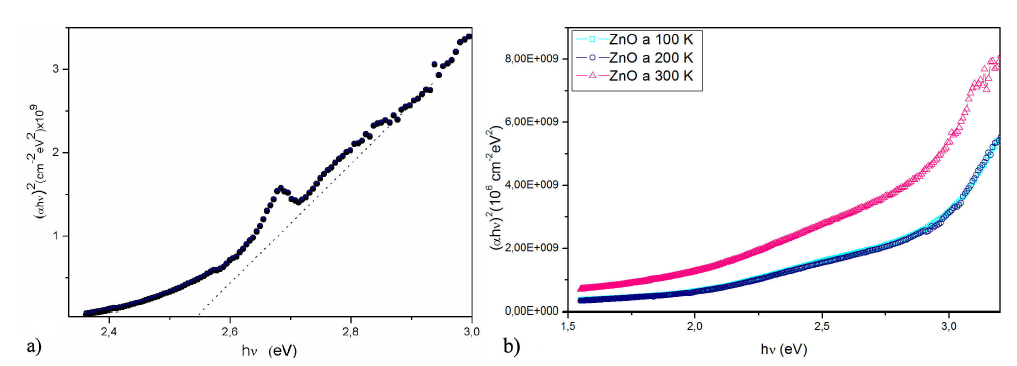
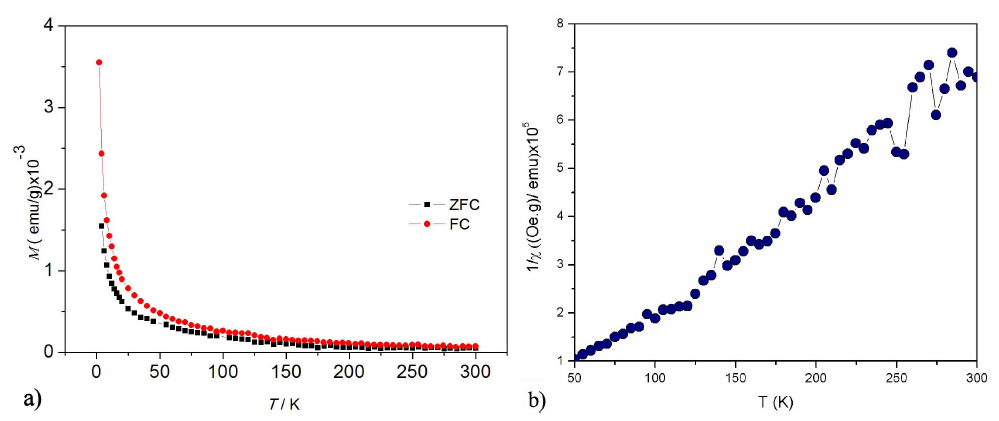
Figure 7 (a) The temperature dependence of magnetization at a field of 50 Oe and (b) The reciprocal magnetic susceptibility Vs. Temperature for the Zn0:95Ni0:05O.
The temperature variation of the magnetization of Zn 0.95 Ni 0.05 O is shown in Fig. 7(a). The applied magnetic field was 50 Oe, a rapid increase in the magnetization is observed below 50 K for the both magnetic cycles ZFC and FC. The inverse of the magnetic susceptibility of the doped sample is shown in Fig. 7(b). From the nature of the inverse susceptibility curve, it is likely that the sample is either ferrimagnetic or ferromagnetic at very low temperatures and paramagnetic at higher temperature than 50 K.
In fact, a typical Curie-Weiss behavior 𝜒=𝐶/(𝑇−𝜃) is observed in Fig 7(b) above 50 K for the sample Zn 0.95 Ni 0.05 O15. A least squares fit of the linear portion of that curve above 50 K gave a positive Weiss temperature 𝜃=52.40 K, suggesting a predominant paramagnetic behavior with ferromagnetic interactions between the magnetic ions. The calculated Curie constant 𝐶=0.32× 10 −3 K/(Oe g), obtained from the slope of 1/𝜒 vs 𝑇 curve above 50 K as shown in Fig. 7 (b) allow us to obtain the effective magnetic moment for Ni +2 ions by considering that the C constant is given by 𝐶=(𝑁 𝜇 eff 2 /3𝑘). The effective paramagnetic moment ( 𝜇 eff ) per Ni mol is 𝜇 eff =1.9 𝜇 𝛽 , this value is derivedfrom the last relation and is slightly lower than reported by other authors, possibly by the second phase previously observed by XRD5.
4. Conclusions
Nanocrystalline Ni doped ZnO powders are successfully synthesized by sol-gel combustion method. The phase hexagonal wurtzite structure of ZnO is obtained. The optical absorption study reveals that the red shift in the band gap from 2.8 eV to 2.5 eV after doping, confirms that the Ni 2+ ions were incorporated into the ZnO lattice by substituting Zn 2+ ions. Magnetization measurements show that the sample Zn 0.95 Ni 0.05 O is paramagnetic at room temperature and the susceptibility data give evidence for strong ferromagnetic interactions.

