PACS: 75.75.-c; 75.75.Cd; 61.46.-w; 61.46.Df; 61.46.Hk.
1. Introduction
Cerium oxide with different valence states and various crystalline structures have been explored for various applications such as electrical, electronic, catalytic, adsorption, optical, electrochemical, batteries, functional materials, energy storage, magnetic data storage and sensing properties 1,2,3,4,5. However, to enhance various properties of nanomaterials to meet the increasing needs for different applications, it is needed to reduce the particle size and increase the active surface area of nanomaterials. Decrease in the particle size enhancing conductivity, electrical, sensing and catalytic properties of nonomaterial 6,7,8. Ceria (CeO2) is a cubic fluorite-type structured ceramic material that does not show any known crystallographic change from room temperature up to its melting point (2700°C) 9. Most of the applications require the use of nonagglomerated nanoparticles, as aggregated nanoparticles lead to inhomogeneous mixing and poor sinter ability. In the recent years, due to the excellent physical and chemical properties of nano-sized particles, which are significantly different from those of bulk particles, there is considerable interest in enhancing catalytic activity, sinterability, and other properties by decreasing the grain size into a nanometer range 10,11. A remarkable property of CeO2 is the number of effective redox Ce4+/Ce3+ sites and their ability to exchange oxygen 12,13. CeO2 nanopowders have been reported to be synthesized by different techniques, such as hydrothermal 14, mechanochemical 15, sonochemical 16, combustion synthesis 17, sol-gel 18, semi-batch reactor 19, microemulsion 20 and spray-pyrolysis 21. Among the chemical processes, precipitation method is simple in process, low in cost and saving in time in comparison to the another techniques. In the present work, we focused on synthesis of CeO2 nanoparticles system by co-precipitation route. The aim of this study was to synthesize cerium oxide of low dimension and investigation of morphological properties. This method has novel features which are of considerable interest due to its low cost, easy preparation and industrial viability. In this work, synthesis of the CeO2 nanoparticles is reported by Ce(NO3)3.6H2O precursor by precipitation technique and samples then calcined at 600°C. The structural and optical properties of CeO2 have been studied by XRD, EDS, HRTEM, SEM, FTIR and UV-visible analyses.
2. Experimental details
CeO2 nanoparticles were synthesized by a new approach according to the following manner. In separate burettes, 0.02 M solution of Ce(III) nitrate was prepared by dissolving 2.17 gr, Ce(NO3)3.6H2O in 250 mL distilled water. Similarly, 0.03 M of K2CO3 solution was prepared by dissolving 1.036 gr, K2CO3 in 250 mL distilled water. Aqueous solution of Ce(III) nitrate (50 mL) and potassium carbonate (20 mL) were added drop by drop to a well stirred water (100 mL) to precipitate a white precursor, namely cerium (III) carbonate. The constant Ph=6 was maintained during the precipitation method. Resulting CeO2 were dried at 65°C for 2 hours, cooled to room temperature. Then, the product was aged at 220°C for 2.5 hours without any washing and purification and finally calcined at 600°C for 3 hours. The specification of the size, structure and optical properties of the assynthesis and annealed CeO2 nanoparticles were carried out. X-ray diffractometer (XRD) was used to identify the crystalline phase and to estimate the crystalline size. The XRD pattern were recorded with 2θ in the range of 4-85° with type X-Pert Pro MPD, Cu-Kα: λ = 1.54 A. The morphology was characterized by field emission scanning electron microscopy (SEM) with type KYKY-EM3200, 25 kV and transmission electron microscopy (TEM) with type Zeiss EM-900, 80 kV. The optical properties of absorption were measured by ultraviolet-visible spectrophotometer (UV-Vis) with optima SP-300 plus, and Fourier transform infrared spectroscopy (FTIR) with WQF 510. The Ce and O elemental analysis of the samples was performed by energy dispersive spectroscopy (EDS) type VEGA, 15 kV. All the measurements were carried out at room temperature.
3. Results and discussion
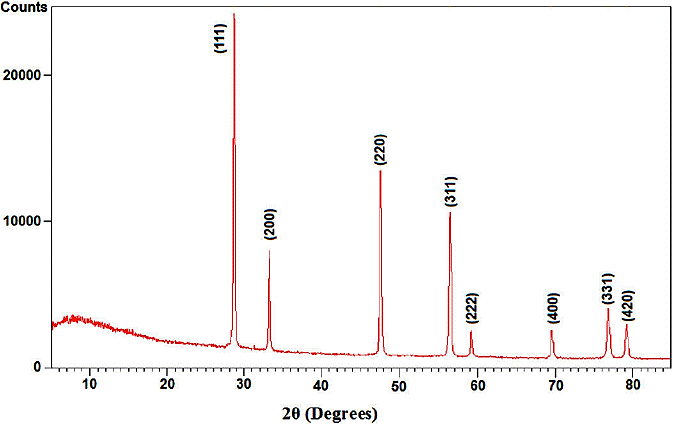
X-ray diffraction (XRD) at 40 kV was used to identify crystalline phases and to estimate the crystalline sizes. Figure 1 shows the XRD morphology of CeO2 nanoparticles annealed at 600°C for 3 hours. The exhibited is peak correspond to the (111), (200), (220), (311), (222), (400), (331) and (420) of a cubic fluorite structure of CeO2 and identified using the standard data 22,23. The mean size of the ordered CeO2 nanoparticles has been estimated from full width at half maximum (FWHM) and Debye-Sherrer formula according to equation the following:
where, 0.89 is the shape factor, λ is the X-ray wavelength, B is the line broadening at half the maximum intensity (FWHM) in radians, and θ is the Bragg angle. The mean size of annealed CeO2 nanoparticles was determined around 20 nm.
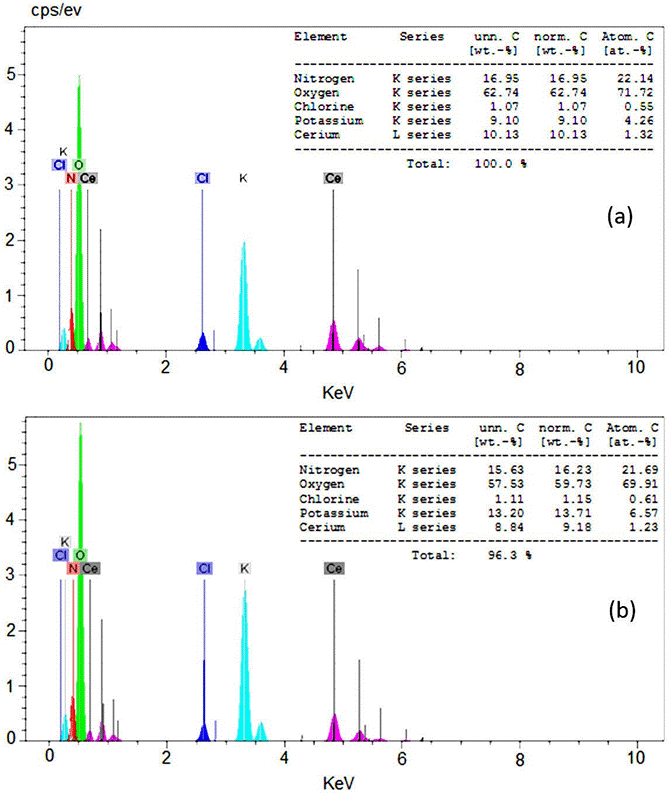
Energy dispersive spectroscopy (EDS) of CeO2 prepared by wet synthesis is shown in Fig. 2 which confirms the existence of Ce and O with weight percent. EDS was used to analyze the chemical composition of a material under SEM. EDS shows peaks of cerium and oxygen of as-prepared sample with less impurity such as K, Cl and N (Fig. 2a). Furthermore, the EDS spectrum of annealed CeO2 samples was done (Fig. 2b) it can be seen that the atomic fraction of the nitrogen and oxygen was decreased because of annealing process.
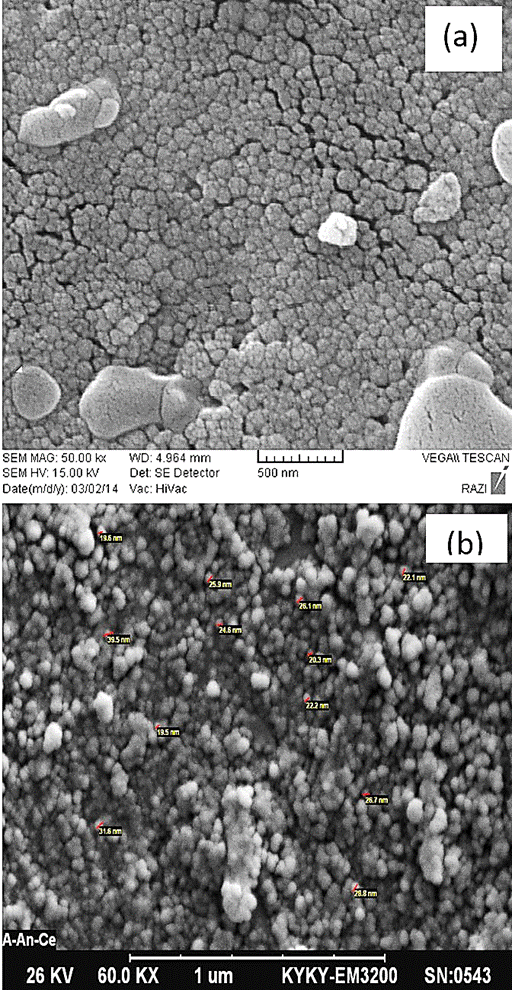
SEM analysis was used for the morphological study of nanoparticles of CeO2. These analyses show that high homogeneity emerged in the samples surface by increasing annealing temperature. The results show that the morphology of the particles changes to the spherical shape with less agglomeration by increasing temperature. Figure 3(a) shows the SEM image of the as-prepared CeO2 nanoparticles prepared by co-precipitation method. In this figure, the particles prepared with formation of clusters. Figure 3(b) shows the SEM image of the annealed CeO2 nanoparticles at 600°C for 3 hours. It can be seen that the CeO2 nanoparticles were not agglomerated. The sphere-like shaped of the particles with clumped distributions are visible through the SEM analysis. The average crystallite size of annealed nanocrystals is about 20 nm.
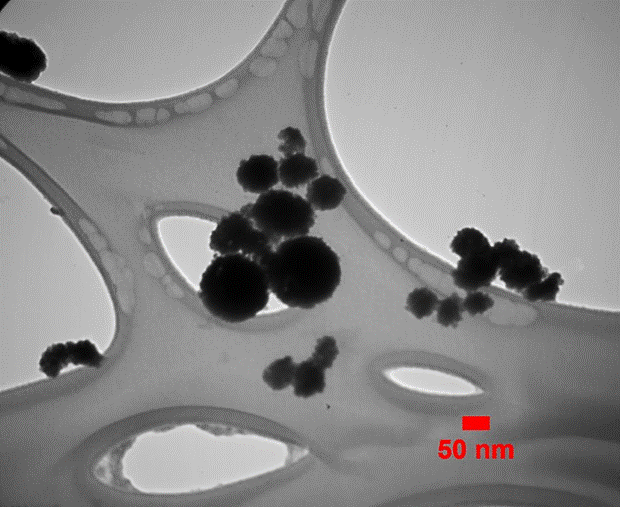
The transmission electron microscopic (TEM) analysis was carried out to confirm the actual size of the particles, their growth pattern and the distribution of the crystallites. Figure 4 shows the as-synthesized TEM image of spherical CeO2 nanoparticles prepared by co-precipitation route with a diameter in the range of 40-80 nm.
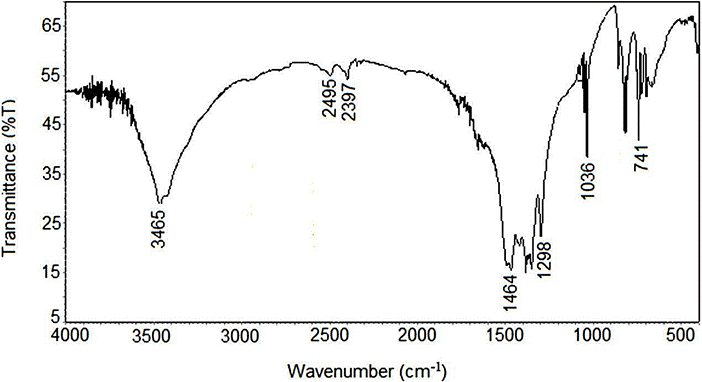
According to Fig. 5, the infrared spectrum (FTIR) of the synthesized CeO2 nanoparticles was in the range of 400-4000 cm−1 wavenumber which identify the chemical bonds as well as functional groups in the compound. The large broad band at 3415 cm−1 is ascribed to the O-H stretching vibration in OH− groups. The absorption is peak around 1464 cm−1 is assigned to the bending vibration of C-H stretching. The intense band at 500 cm−1 corresponds to the Ce-O stretching vibration 24,25. The bands located at around 741, 750, and 1036 cm−1 have been attributed to the CO2 asymmetric stretching vibration,
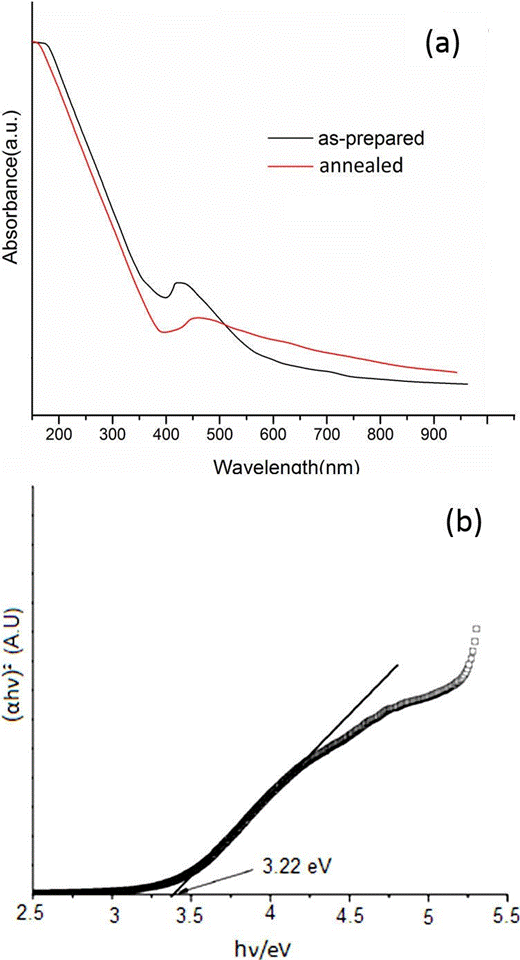
UV-visible absorption spectral study may be assisted in understanding electronic structure of the optical band gap of the material. Absorption in the near ultraviolet region arises from electronic transitions associated within the sample. UV-V is absorption spectra of as-prepared and annealed CeO2 nanoparticles are shown in Fig. 6(a). For assynthesized CeO2 nanoparticles, the strong absorption band at low wavelength near 380 nm correspond to bandgap energy of 3.26 eV (black line) and for annealed one the strong absorption band at low wavelength near 385 nm correspond to 3.22 eV (red line). In comparison with UV visible absorption spectrum of CeO2 nanoparticles reported in the literature 27, band/peak in the spectrum located at around 400-700 nm are observed to be shifted towards lower wavelength side, which clearly shows the blue shift. It indicates the absorption positions depend on the morphologies and sizes of CeO2. The UV absorption ability of CeO2 is related with band gap energy. The UV-absorption edge provides a reliable estimate of the band gap of any system. The band gap energy was estimated by plotting (αhν)m of the microcrystalline materials against the photon energy (hν). Where α is the absorption coefficient, hν is the photon energy, Eg is the band gap energy. The band gap energy fallowed direct transitions of as-prepared CeO2 nanoparticles is 3.22 eV as estimated from the Tauc plot in Fig. 6(b).
4. Conclusion
CeO2 nanoparticles have been successfully synthesized using Chemical precipitation of cerium nitrate hexahydrate and potassium carbonate. XRD spectra showed cubic fluorite structure of CeO2 identified using the standard data. SEM images indicated that with increasing temperature the morphology of the particles changes to the sphere-like shaped with less agglomeration. TEM results exhibited the spherical CeO2 nanoparticles with a diameter in the range size of 40-80 nm. FTIR data exhibited the presence of Ce-O stretching mode of CeO2. The Ceria nanoparticles showed a strong UV-vis absorption at 500 nm with a well-defined absorption peak at 380 nm and finally the direct band gap was determined about 3.26 eV.


 text new page (beta)

