


 text new page (beta)
 English (pdf)
 Article in xml format
 Article references
 Send this article by e-mail
 Cited by SciELO
  Similars in
SciELO
Similars in
SciELO 
 Permalink
PACS: 07.35.+k; 91.60.hg; 87.64.je
1. Introduction
Since its implementation by Rosasco & Roeder 1, the micro-Raman spectroscopy (MRS) has been shown to be a very useful analysis tool in Earth and Planetary Sciences for the identification of mineralogical phases 2,3. Because of the relevance of synthetic and natural gypsum in the construction industry and many other industrial processes, their dehydration process has been intensively investigated at high pressures and temperatures over sub-millimeter samples in diamond anvil cells 4,5.
Form a diffraction X-ray analysis, recently we reported some degree of dehydration in a shock-compressed sample of a natural gypsum ore 6. The refinement of the XRD patterns obtained on the recovered sample, indicates the presence of gypsum and bassanite in almost equal proportions, however, we also detected that this transformation is not an uniform process throughout the sample, as indicated by a preliminary Micro-Raman spectroscopy (MRS) analysis practiced by us in different areas of the sample.
In this article we extended our previous Raman analysis with the aim of providing a complete picture of the phases generated in that shock-compressed sample.
2. Methods
The sample preparation and the MRS measurements were performed as follows.
We employed gypsum powders for the compression experiment formed by fragments (< 50 µm) of irregular shape with jagged edges as a result of a crushing on a face of a gypsum crystal shard from Swords Cave at Naica ore; Chihuahua-Mexico (Fig. 1). Before the impact, these dusts were subjected to a pre-compression in a steel container until they reached a density 2.08 g/cm3, which is roughly 90% of the theoretical density of the gypsum (2.32 g/cm3).
As we described previously in Ref. 6, the shock experiment on powders of the gypsum mineral was carried out using the one stage light gas gun at the High Pressure Laboratory of the Physics Institute at the Universidad Nacional Autonoma de Mexico. The propellant gas employed, in this´ case, was helium. With this arrangement, it is possible to perform planar shock-waves experiments by impacting a stainless steel plate against a target, which consists of three stainless steel capsule chambers hermetically sealed. Each chamber contains a specific cavity volume to locate a powdered compound or mineral under study. In this case, gypsum was tested together with powders of Wollastonite and tri-calcium phosphate mineral (TCP). We employed a stainless steel plate of 106 g with a thickness of 3.46 mm mounted on the nose of a nylon projectile (impact 2000) which in the experiment performed, was accelerated reaching a velocity of 829 m/s; under these conditions, by impedance matching, the peak pressure was estimated to be of the order of 14 GPa in the target.
After the impact, “the recovered sample” whose shape was cylindrically flattened was fractured into two equal sections along its diameter (Fig. 2). One of them was used to make the X-ray analysis as described in our previous article 6. The other one was used for the MRS analysis, practiced at different points along the fractured surface of the sample. The micro-Raman spectra were measured with a Thermo Smart Raman spectrometer (λ = 532 nm) with a spatial resolution spot of 2 to 3 µm, and a wavenumber accuracy and precision of 2 cm−1 and 0.25 cm−1 respectively; in the present study, our MRS measurements were extended from 100 cm−1 to 1250 cm−1. The light was focused on the sample with an optical microscope (50x objective), which also collected the scattered light onto the spectrometer. Laser power density on the sample surface was about 0.2 mW/cm2.
3. Results
The Raman spectrum of pre-compressed sample (labeled PC in Fig. 3) consists of the translational (T) and the rotational (R) lattice modes of Ca, H2O and SO4 group of gypsum and of the internal vibrational modes of the SO4 group (ν1, ν2, ν3, ν4) previously reported in the literature 7,8. After the impact, the Raman features of spectra taken along the fractured surface of the recovered sample, change markedly. We note the absence of the T and R vibrational modes in some of these spectra (see spectra b, c and d in Fig. 3) and in general, the broadening of all bands associated with the internal modes of SO4 group.
Figure 3 Raman spectra of sample before impact (PC) and after impact (a, b, c, d). All spectra were taken along the fractured face of recovered sample (see text).
For instance, when comparing the most intense bands located in the zone of the symmetric stretching mode ν1, we find that the bands of the impacted sample can be matched by two or three lorentzian-shape curves, while in the precompressed sample, only one curve is needed to fit that bands. In Fig. 4 we draw the deconvolution of the band at the ν1 zone of spectrum corresponding to the sample before the impact (PC) and of two spectra taken on the fractured face of the shock-compressed sample (labeled as a and d in Fig. 3). It is evident that the ν1 band of PC spectrum appears to match very well with only one peak whose position (1010 cm-1) and coincides with that reported by Buzgard et al. 9 for gypsum crystals of natural origin, while the ν1 mode equivalent bands of a and d spectra, should be fitted with two and three peaks respectively, whose positions; 1011 cm−1, 1015 cm−1 (for the first), and 1010 cm−1, 1015 cm−1 and 1019 cm−1 (for the second), are located at or next to those reported in the literature for gypsum, bassanite and anhydrite 9. Below, we will extend the analysis of the structure of the other internal modes of SO4 group in all spectra of Fig. 3.
Figure 4 Deconvolution practiced to bands of symmetric stretching mode ν1 of sample before the impact (PC) and after the of impacted (a, d).
3.1. Analysis of band structure of spectrum a
The detection of two peaks possibly assigned to gypsum and bassanite at the zone of ν1 mode of spectrum a, suggests that the whole spectrum could be formed by a mixture of bands associated to these phases. From a deconvolution of the remaining bands associated to the internal vibrational modes (ν2, ν4, and ν3) of that spectrum, we only found peaks associated with gypsum and bassanite. In Table I we give an account of the Raman shift positions of peaks fitted to all bands and a comparison with those reported by Buzgar et al. for gypsum 9 and by Liu et al. for bassanite 10, from a micro-Raman analysis performed in these compounds with the same laser radiation employed in this investigation (i.e. λ=532 nm).
Table I Raman shift positions of internal modes of SO4 group of spectrum a compared with those reported in the literature.
Bassanite - b Ref. 10.
Gypsum - g Ref. 9.
In fact, most of spectra obtained on different points along the fractured face of impacted sample have similar structures as that observed in spectrum a. In Fig. 5 we draw eight of them (a included) together with that of the sample before the impact (PC) in order to make a qualitative comparison.
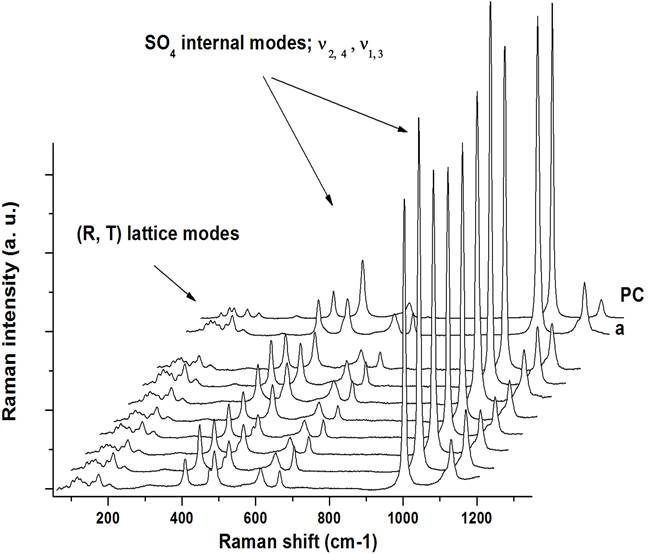
Figure 5 Shape comparison between Raman spectra of precompressed sample (PC) and that of impacted sample (a). Note the similarities between the band-structure of the spectrum a, with the eight spectra (not labeled) taken in other points along the fractured face of “recovered sample”.
Additionally, we perform the deconvolution of bands corresponding to internal vibrational modes of SO4 group (ν1, ν2, ν3 and ν4) of all those spectra (not reported in this work) and, in fact, in all cases we could adjust Lorentzian shape peaks with their maxima located at positions close to those of gypsum and bassanite, just as in the case of spectrum a (see Table I). Then, this seems to confirm that the main effect of impact on the pre-compressed sample was the partial transformation of gypsum to bassanite, which would agree with our previous X-ray diffraction analysis 6.
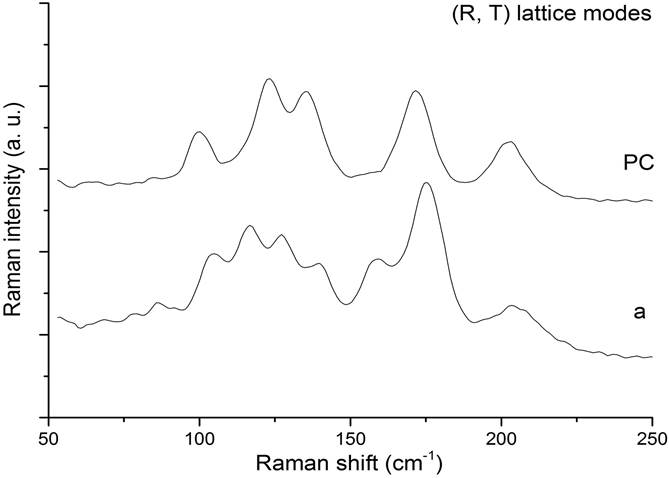
Finally, we must add that in the zone of translational and rotational lattice modes (T,R), additional peaks appear in the Raman spectra of the impacted sample that might be associated with new crystalline structures generated by the impact. In Fig. 6, we draw the structure of spectra on that zone for the sample before (PC) and after (a) impact.
3.2. Analysis of band structure of spectra b, c and d
However, as we saw in Fig. 3, the Raman spectra taken in other points of impacted sample shows broader bands of complex shape (see spectra labeled as b, c and d). Also, the collapse of the bands associated with the vibrational modes of the lattice (T,R) is noticeable in these spectra; this last fact could be related to an amorphization process and a higher level of dehydration induced by the impact in that zones.
Then, it is clear that in some areas of the “recovered sample”, the impact induces phase transformations of greater complexity. To achieve a cleaner picture of these transformations, we extend our analysis through the deconvolution of all bands corresponding to internal modes of SO4 group for the b, c and d spectra. The results appear reported in Table II.
Table II Raman shift positions of internal modes of SO4 group of spectra b, c, and d. A detailed comparison of these positions with those reported in the literature, is given in the text.
3.2.1. Analysis of symmetric and asymmetric stretching modes ν1, ν3
From Table II we can see that as for the spectrum d, the band related with the mode ν1 of the spectra b and c actually are formed by three peaks that are located in positions close to those reported for the gypsum, bassanite and anhydrite (see Fig. 4), this would confirm that in addition to the partial transformation of gypsum to bassanite, in other areas of the “recovered sample” some amount of anhydrite was generated as a result of the impact.
On the other hand, the bands localized in the region of asymmetric stretching mode ν3 of spectra b, c and d appear wide in shape and are the less intense in all spectra. All these bands could be fitted with six peaks, as can be seen in Table II. For example, the matched peaks to mode ν3 of spectrum labeled as d are located in the following positions; 1117, 1131, 1139, 1151, 1168 and 1182 cm−1. Comparing these positions with those of Table I we find that the peaks 1131 and 1139 cm−1 could be assigned to bassanite and gypsum respectively, while peaks located at 1117, 1151 and 1168 cm−1 could be assigned to anhydrite, if we compare this positions with those reported by Chang et al. 11 and Prasad et al. 12 from their studies of gypsum dehydration induced by heating. A similar comparison can be made with the b and c spectra.
In the three spectra (b, c and d) a peak at 1182 cm−1 appears, which could be assigned to a high-pressure polymorph of anhydrite, according to that reported in the literature 4,13.
3.2.2. Analysis of symmetric and asymmetric bending modes ν2, ν4
In the frequency range corresponding to bending modes (400700 cm−1), the Raman spectra of Calcium Sulfates normally shows four single bands 9. The first doublet is assigned to symmetric bending mode ν2 of sulfate group (SO4) and the second to asymmetric bending mode ν4. In the impacted sample, the presence of four bands are also observed in all analyzed points, except that in this case, all appear with a complex structure (see Fig. 3). The deconvolution of those bands showed that in the zone of mode ν2, each doublet of analyzed spectra can be fitted with four peaks, whereas in the zone of mode ν4 only three peaks are needed to match the bands (Table II).
Again, by comparing with Table I we found that most peaks of Table II could be assigned to gypsum or bassanite. Only the peaks at 608 cm−1 and 611 cm−1 are located at positions reported for anhydrite 10,12,13.
4. Discussion
Our identification of phases based on the information reported in the literature seems to be acceptable, however these assignments turns out be approximate if we consider that among many publications consulted on this subject, inconsistencies are frequently found in the assignment of Raman shift positions of different vibrational modes of the hydrous and anhydrous calcium sulfates, (see, for instance, Tables I and II reported by Liu et al. 5 and references therein).
Particularly, these inconsistencies are common when Raman analysis, are performed with laser radiation of different wavelengths (see, for instance, Table I of Potgieter-Vermaak et al. article 14).
Other inconsistencies between the Raman spectra of calcium sulfates reported in the literature, can also be attributed to the fact that the data come from Raman analysis performed on samples of different origin, natural or synthetic, where there is no control over the mono or poly-phase nature as well as on their chemical purity.
In addition, when results come from experiments performed at high pressures and/or high temperatures such as those made in diamond anvil cells, the situation is even more complex, because all the bands suffer displacements in their positions and new peaks can appear that could be assigned, in principle, to new dehydrated or semi-hydrated phases associated with the system CaSO4-H2O 4,5.
From detailed studies by X-ray diffraction, now it is known that there are at least three crystalline phases in the system CaSO4-H2O; gypsum, α-bassanite, β-bassanite and two for the system CaSO4, the soluble and insoluble anhydrite, which have been ascribe to nine different space groups; two in gypsum, four in bassanite and three in anhydrite 15. As far as we know, there are no such rigorous studies through the use of Raman spectroscopy in all types of hydrous or anhydrous calcium sulfates.
In view of the importance of the calcium sulfates in broad fields which goes from earth or planetary sciences to the industrial processes and the cultural heritage, it is necessary to continue the systematic study of these materials through refined and standardized experimental procedures to enable a consistent comparison and interpretation of spectral Raman features from different samples.
5. Conclusions
From the analysis by micro-Raman spectroscopy of a shockcompressed sample of a gypsum mineral, we conclude the following:
The high pressures and temperatures generated by the impact caused the partial transformation of gypsum to bassanite in all analyzed points of the recovered sample. The transformation process was not homogeneous along the sample, since in some points the Raman spectra appear with complex structures. In these cases, the peak fit to Raman modes corresponding to symmetric and asymmetric stretching and bending modes of sulfate group (SO4), confirms the presence of the three calcium sulfates; gypsum, bassanite and anhydrite.

