


 nueva página del texto (beta)
 Inglés (pdf)
 Artículo en XML
 Referencias del artículo
 Enviar artículo por email
 Citado por SciELO
  Similares en
SciELO
Similares en
SciELO 
 Permalink
PACS: 61.80.Hg; 61.46.Hk; 72.15.Eb; 74.25.fc; 61.80.-x
1.- Introduction
Over the past few years, nano-sized Si has been at the focus of researchers in the world and its properties have been theoretically and practically studied 1-10. Micro sizes silicon has wide application field in nuclear technology and cosmic electronics. In the future, these application fields’ to bein nano-scale is inevitable and therefore, study of the influence of neutron irradiation on electrical conductivity of these compounds in the point of interest. Thereby, micro and nano silicon has wide applications in electronic devices employed for neutron and cosmic radiation measurements. The defects appeared due to neutron irradiation make important changes on the electrophysical properties of the samples as it will be reported in the section of results. Firstly, let’s consider the defects formed in nanoparticles exposed to neutron irradiation continuously at different periods. So, Si nanoparticles are composed of Si atoms with cubic modification, that’s why within the neutron flux influence on lattice atoms there can be observed high energy recoils (high energy recoils, primary knock-on) in some atoms. Within energy exchange between Primary Knock-on Atom (PKA) and other atoms displaced atoms from its lattice site by neutron irradiation, point defects or clusters are formed and they are the basis of fundamental defects. The defects formed under neutron flux influence, can be migrated and are real place for storage of any charge at different periods 11-14. These formed defects are as if a “trap” for storing other charges (ex. electrons) occurred under neutrons’ influence. However, there is very little probability that random elements or gases adsorbed from atmosphere may be caught in these traps 14,15. In the submitted work the mechanism of electrical conductivity of the samples has been explained by known methods 16-22.
Silicon is the basis of almost all electronics systems which are used today. So, this material is widely applied in oscillators, sensors, electronics, computers, networks, phones, detectors, etc. and their application in nano sizes in above-mentioned fields in future is real. Considering that the majority of the above-mentioned fields are widely used in used in nuclear and outer space technologies, then it can be clearly seen the importance of studying the electrical properties of Si nanoparticles.
2.- Experimental
The nanomaterial used in the experiment consists of cubic modification silicon nanoparticles which is has, 80 m2/g specific surface area (SSA), 100 nm particles’ size and 0.08 g/cm2 density. Some parameters of oxide form of used samples (silica) have been studied similar experiments 19-26. It has been reviewed the frequency dependencies of electrical conductivity within initial state and after neutron irradiation. The samples have been irradiated at full power mode (250 kW) by neutron flux (2 x 10¹³ n·cm-2s-1) in central channel (channel A1) of TRIGA Mark II light water pool type research reactor in “Reactor Centre” of “Institute Jozef Stefan” (IJS) in the city of Ljubljana, Slovenia. The parameters of neutron flux at full power mode in central channel are as follows: 5.107 x 10¹² n·cm-2s-2 (1 ± 0.0008, En ~ 625 eV) for thermal neutrons, 6.502 x 10¹² n·cm-2s-1 (1 ± 0.0008, En ~ 625 eV ÷ 0.1 MeV) for epithermal neutrons, 7.585 x 10¹² n·cm-2s-1 (1± 0.0007, En > 0.1MeV) for fast neutrons and finally for all the neutrons in central channel flux density is as 1.920 x 10¹³ n·cm-2s-1 (1 ± 0.0005) 27-34. Thus, the average energy of neutrons in central channel is compatible with nearly the energy of epithermal neutrons (En 625 eV ÷ 0.1 MeV). Nano Si particles being pressed at 3 kN/cm2 press machine in special conditions in the “Thin Films and Surfaces F3” department of IJS, was made in the form of tablet with 2.5 mm height and 5.5 mm diameter and then placed in aluminium container appropriate to the channels of the reactor. The prepared samples have been continuously irradiated in central channel for 1, 5, 10 and 20 hours. Activity of the samples has increased up to 3.1 GBq under neutron flux influence. Therefore all the measurements have been carried out approximately 400 hours after neutron flux influence. After irradiation, silver contacts have been fixed on the surface of samples in special condition and examined its quality (Ögussa, Leitsilber 200). It has been used Cr/Au electrodes obtained on the top layer by spray method. Then using platinum top and bottom of tablet form samples and electrical conductivity of the samples has been measured in “Novocontrol Alpha High Resolution Dielectric Analyzer” device for alternating current (AC ~ 0.5 V) at 100-400 K temperature and 1 Hz - 1 MHz frequency range. During the measurements storage accuracy of temperature in any degree was up to 10-2 K and the accuracy was obtained with the bridge method (Pt100 resistor) 35 All of the results compatible with the values obtained from experiments have been graphically depicted employing “OriginPro 9.0” program.
3.- Result and discussions
Within the measurements it has been reviewed the frequency dependencies of electrical conductivity of samples at various constant values of temperature. The experiments have been conducted within the1 -106 Hz frequency range and during the measurements it has been revealed that the frequency dependencies of electrical conductivity are different at various values of temperature. Here firstly, we have reviewed the frequency dependencies of electrical conductivity irradiated at different periods and four values of temperature within the frequency range 1 Hz - 1 MHz. First of all, let’s see the frequency dependencies of electrical conductivity at 100 K and 200 K values of temperature (Fig. 1). As it is seen from figure, at 100 K temperature there is a chaotization in frequency dependence of electrical conductivity.
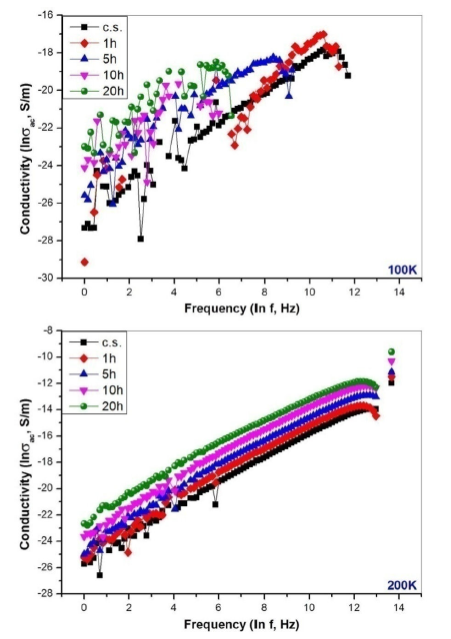
FIGURE 1 Frequency dependencies of electrical conductivity of nano silicon particles at the 100 K and 200 K temperature (control sample (c.s.) and after 1, 5, 10 and 20 hours of neutron irradiation).
However, in general tendency there is an increase in electrical conductivity with increase of effect term of neutron flux. The chaotization can be explained by the theory of cluster formed in the sample under neutron flux influence At 200 K temperature the existing chaotization is relatively eliminated due to the temperature. Under the influence of temperature and frequency the chaotization is almost fully recombined at the frequency range lnf
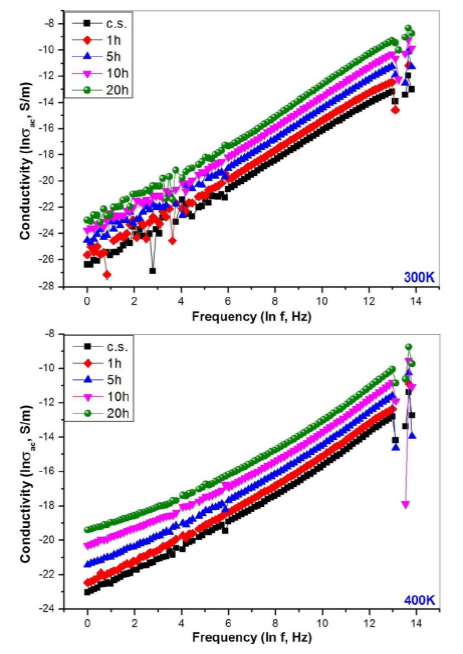
FIGURE 2 Frequency dependencies of electrical conductivity of nano silicon particles at the 300 K and 400 K temperature (control sample (c.s.) and after 1, 5, 10 and 20 hours of neutron irradiation).
However, at low frequency range at 400 K temperature this chaotization is fully recombined with temperature and frequency influence (Fig. 2). In the result of the measurements carried out at all temperatures it has been established that, the frequency dependencies of electrical conductivity are of linear character. As it is seen from Figs. 1 and 2 that, at 200 K, 300 K and 400 K temperatures the electrical conductivity of the samples increase about 20 times under the influence of neutron flux. Its reason is the active participation of the charge carriers or electrons existing in local states in conductivity due to irradiation.
At all temperatures sharp deviations and peaks are observed at high frequency range (Fig. 1-2). It can be explained by resonance phenomenon which appeared in the result of coincidence of intrinsic frequency of measuring device with the frequency of the sample. Thus, in measuring system the resistance or current deviations in inductance can be cause a breakthrough in experimentally recording dielectric data36,37. In this case general impedance can be determined as follows:
where:
in measuring device resonance state in inductance is expressed by the equation ω
2
LC = 1. This resonance state is easily observed at high frequency range in Fig. 1, 2. It should be mentioned that,
The results obtained in quite small resistances of measuring device are explained by dielectric effect in the frequency
known expressions, the permittivity obtained from experiment and
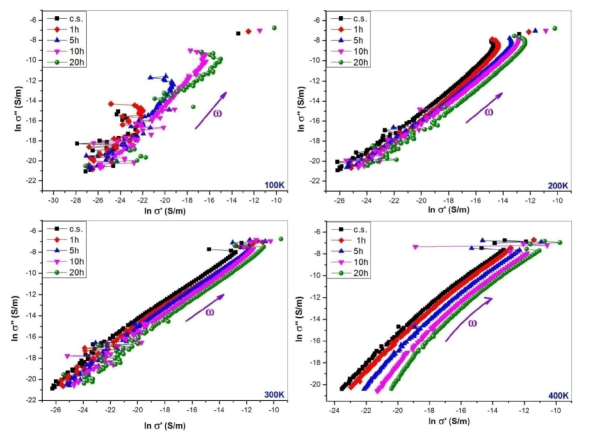
FIGURE 3 Correlations between real and imaginary parts of electrical conductivity of nano Si particles at initial state (control sample-c.s.) and after 1, 5, 10 and 20 hours of neutron irradiation at 100 K, 200 K, 300 K and 400 K temperatures.
These dependencies also confirm the facts depicted in Figs. 1 and 2: decrease of the current chaotization with temperature increase and its fully recombination at 400 K. From interdependence of real and imaginary parts of electrical conductivity it is observed that the real part of the electrical conductivity changes more than the imaginary part due to neutron flux influence. In Fig. 3 it is observed a semicircle-like case at 400 K temperature, and it can be accepted as a part of Cole-Cole diagram 21. In this case, approximately the values 108 - 1010 Hz of frequency correspond to the peak of imaginary extension of the semicircle. Interdependence of real and imaginary parts of electrical conductivity, it has been found out the conductivity is atomic or dipolar ion type.
4.- Conclusions
In the result of comparative analysis of frequency dependencies of electrical conductivity of the samples affected by neutron flux with different periods and initial state, it has been established that, clusters are formed inside the samples under neutron flux influence at 100 K temperature. As a result of the generated clusters it is observed a sharp chaotization at this temperature. At the 200 - 300 K temperatures the clusters are reduced under the influence of temperature and frequency and fully recombined at 400 K. From comparative analysis of frequency dependencies at various temperatures it has been revealed that the value of electrical conductivity increases up to 20 times due to neutron flux influence. From interdependence of real and imaginary parts of electrical conductivity it has been find out those real parts of electrical conductivity has changed more than the imaginary parts after neutron irradiation. The conductivity to be atomic or dipolar ion type, has been found out from interdependence of real and imaginary parts of electrical conductivity.

