1.- Introduction
The compounds of aluminum oxide doped with different elements like Europium 1, Manganese, Cerium 2, Lanthanum 3, Erbium, Praseodymium 4, Terbium 5, Iron, Chromium 6, Carbon 7, Ytterbium 8 and Thulium 9 have been studied carefully because of its excellent physical and chemical properties, such as luminescence, hardness, resistance to ionizing and thermal radiation, high dielectric constant and insulating characteristics. That’s why they can be applied as dielectric materials with high refractive index and a wide bandgap, and in the field of optical coatings and metal-oxide semiconductor devices for next generation devices; those are just a few reasons why alumina has a large potential for its wide variety of applications.
The compounds of aluminum oxide doped with rare earths are obtained by different techniques such as spray pyrolysis 2,5, organic acids combustion 3, sol-gel 4,8, pulverizing-metallurgy 6, laser ablation sputtering 10,11, dissolvent evaporation 1 and other more 12-17. These have been developed for the various compounds Al2O3 that are doped in simple experimental conditions. Oxides doped with rare earths are of the most promising; because the 4f orbitals are protected very effectively by the electrons of the 5s2 5p6 outer layers, this is why the states originating from the different configurations 4fn are only slightly affected by the surrounding ions and remain virtually unchanged for an specific ion in all its compounds, according to this electronic configuration, f-f transitions have narrow and sharp peaks observed in the optical absorption and emission spectra.
The Al2O3 is a material with a great technological importance due to its optical transparency from the ultraviolet to the near infrared; and its excellent mechanical properties and chemical stability, presenting different crystalline phases at different temperatures; the phase α-Al2O3 being the most stable.
In this work optical, structural and morphological characteristics of aluminum oxide powders doped with different concentrations of terbium chloride are presented; the samples were obtained through simple evaporation technique at a temperature of 1100∘C to obtain a luminescent material in the green region of the spectra.
3.- Results and discussion
The crystal structure of the powders was analyzed by X-ray diffraction (XRD)Show in Fig. 1 are the diffraction plot of Al2O3:Tb3+ phosphors. Previous studies have shown that various crystalline phases are present in Al2O3 compounds, these phases α-Al2O3, γ-Al2O3 and δ-Al2O3 appear when this compound has been thermally treated from 800∘C to 1000∘C, whereas phase α-Al2O3 occurs at temperatures above 1000 to 1200∘C 19 The graph shows that powders Al2O3:Tb3+ have the crystal phase α-Al2O3 with peaks located at 2Θ=25.78, 35.34, 37.96, 43.56, 45.8, 52.74, 57.7, 61.5, 66.74, 68.44, 77.12 and 80.94, which are associated with the planes (012), (104), (110), (113), (202), (024), (116), (018), (214), (300), (119) and (220), according to diffraction JCPDS card 81-1667. The α-Al2O3 phase is a hexagonal primitive cell (19,20), with lattice parameters a = b= 4.75999 Å c =12 .99 481 Å 21. In this compound are also identified peaks corresponding to the phase α-Al2O3, in 2Θ=32.82, 45.8, 61.36 and 66.74, associated with the planes (220), (400), (511) and (440) according to JCPS card 50-0741, this phase is cubic with lattice parametera =7.939 Å.
The crystal size was estimated by Sherrer’s formula22:
T=0.9λBsinθB
Where, T represents the crystal size, λ is the wavelength radiation CuKα (1.5406 Å), B is the half width of the diffraction peak and θB the Bragg’s angle measured in radians; sizes calculated for the phase δ-Al2O3, is 32.47 nm in θ=32.72, in θ=37.88 its size is of 40.33 nm, at θ=45.8 its value is 20.8 nm, at θ=61.48 is 26.3 nm, at θ=66.64 is 17.98 nm and at θ=77.1 is 22.22 nm 23. It is important to note, that no significant differences in the XRD patterns among powders Al2O3 and those doped with Tb3+ are detected, probably due to the low percentage of terbium; because of this it is not surprising that there are not large clear differences between Al2O3 powders and α-Al2O3 phase doped with terbium. The EDS measurements indicate the presence of aluminum, oxygen and a minimum part of terbium, EDS results are shown in Table I, in the table the results of the powders correspond to 12 at. % of doped with terbium.
Table I Measurement of percentage and weight of aluminum, oxygen and terbium for EDS the phosphors Al2O3 and Al2O3:Tb3+ at 12% doped.
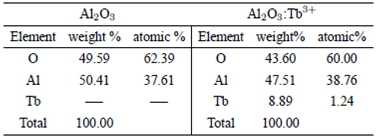
Even though EDS is not a quantitative technique it is useful to estimate the chemical composition of samples, EDS measurements on doped and non-doped phosphors were performed and the results are listed in Table I. In the case of doped samples, it is shown just the 12 at. % of Tb, because is which has the highest luminescent intensity. According to the expected stoichiometry for aluminum oxide (a relation of 3 to 2 of the oxygen to aluminum), a presence of 60% of oxygen and 40% of aluminum, is observed. In the case of doped samples, there is an apparent substitution of Al ions by Tb3+, but in a low quantity, this effect is observed in some previous reports in some host materials, techniques and dopants3,18,20,23.
Figure 2 shows two SEM images of Al2O3 and Al2O3:Tb3+ phosphors annealed at 1100∘C, it can be observed that the powder particles grow in a sheet form, and have the formation of agglomerates of our material with various sizes (between 300 nm to 5 microns) , although smaller powder sizes of about 100 nm are also observed. The size is determined, largely, by the grinding process of the powders. No difference in size or morphology was found between doped and none-doped powders. These micron-sized powders are particularly good for various technological applications like lighting devices.
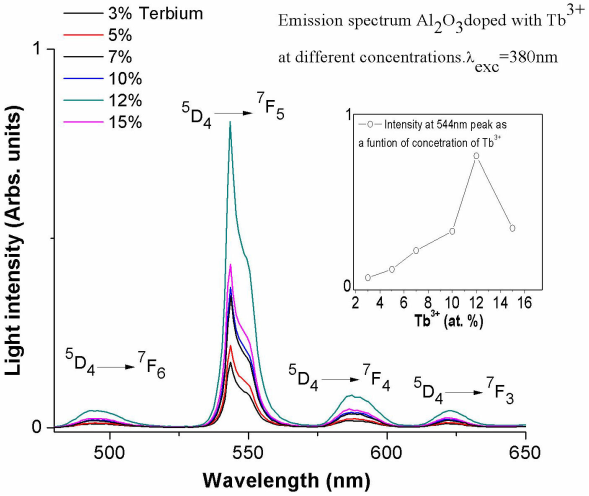
The normalized emission spectra were obtained for the aluminum oxide powders doped with percentages from 3 at. % to 15 at. % of terbium and are shown in Fig. 3. In the graph are shown transitions for the Tb3+ ion, which appear at 494, 543, 587 and 622 nm and corresponding to 5D4
→
7F6,5D4
→
7F5, 5D4
→
7F4 and 5D4
→
7F3
2,5,17,18; respectively, using a continuous excitation radiation of 380 nm wavelength at room temperature, The dominant peak for these spectra is the one associated with the transition 5D4 to 7F5 at 544 nm, which gives the characteristic green light emission identified with the presence of Tb3+ ions. The emission intensity for different terbium doping concentrations are shown in Fig. 3 indicating that this is increased by the increase of doping percentage, the best efficiency is presented with the percentage of 12 at. % is presented the best efficiency, while 14 at. % dopant diminishes in intensity because they present quenching effect associated with energy transfer among dopant ions.
In Fig. 4 the excitation and emission spectra are shown, in the excitation spectra are observed that exist some peaks capable to excite Tb3+ ions, the higher peaks that could excite are 260 and 380 nm; the broad excitation band centered at 260 nm, is commonly ascribed to the O-Tb charge-transfer transition (ligand to metal charge transfer). the general behavior of these results is similar to that reported previously in which a dependence of the photoluminescence intensity is correlated with the incorporation efficiency of the Tb ions into the aluminum oxide matrix; all of them show a band of high intensity at 260 nm, additionally the Al2O3:Tb3+ powder spectrum presents other peaks at 303, 318, 340, 350, 368, 368 and 380 nm. The intensity in 260 nm is significantly more intense than the forbidden transitions centered at 303 nm (5I8
→
7F6, 5F4, 5F5, 5H4), 318 nm (7F6
→
5H5, 5H6), 340 nm (7F6
→
5H7, 5D1), 350 nm (5L78 →
7F6, 5G3), 368 nm (7F6
→
5L9, 5 D2, 5G5) and 380 nm (7F6
→
5L10, 5 G6, 5D3), as can be seen in the Fig. 4, which describes the charge-transfer transition that occurs between the ligand and the metal (O-Al), the most luminescent intensity with 12 at. % of Tb3+ in the powders of Al 2O3:Tb3+, those phosphors have high quantum yield efficiency about 25.97. The fluorescence quantum yield is defined as the ratio of the number of photons emitted to the number of photons absorbed 23.
Figure 5 shows the CL spectrum of Al2O3:Tb3+ powders, during CL measurements the anode voltage and the beam current were kept constant. The spectrum consist of a number of well resolved peaks at 490, 544, 590, and 622 nm, which are assigned to 5D4 to 7F6, 7F5, 7F4 and 7F 3, of the Tb 3+ ion transitions respectively. The most intense emission occurs at 544 nm and is due to 5D 4 to 7F 5 transition. Similar results have been obtained earlier for oxide doped with Tb3+, and the results are consistent with those previously mentioned3,18,24, cathodoluminescence results obtained from all the used concentrations of terbium as dopant, are consistent with the photoluminescence when they were excited using continuous 380 nm wavelength radiation having its maximum at 12 at. %.
Figure 6 shows the CIE diagram (Commission International de l’ éclairage) 25 which defines the three primary colors of color displays, and from these the combination of different colors is obtained to generate secondary colors in its different shades, depending on their individual coordinates (x,y). For Al2O3:Tb 3+ powders, when excited with 380 nm, the coordinates are (x=0.31, y=0.5111), according to the CIE diagram, they are located in the green color, being these results comparable to previous ones reported for Tb 3+ in a variety of different hosts 2,3,16.


 nueva página del texto (beta)
 Inglés (pdf)
 Artículo en XML
 Referencias del artículo
 Enviar artículo por email
 Citado por SciELO
  Similares en
SciELO
Similares en
SciELO 
 Permalink