


 nueva página del texto (beta)
 Inglés (pdf)
 Artículo en XML
 Referencias del artículo
 Enviar artículo por email
 Citado por SciELO
  Similares en
SciELO
Similares en
SciELO 
 Permalink
PACS: 42.70.Qs
1.Introduction
Photonic crystal (PhC) waveguides are the prospective structures for high-speed optical micro-devices. Possessing high-effective light localization, such waveguides allow introducing active materials making additional all-optical signal control possible. The most effective from the technological point of view is embedding the PhC filters with characteristics close to the ones of the background PhC (i.e. with the same refractive index, PhC period, etc.). As has been shown in previous papers1,2 , such filters possess spectral characteristics that allow using them for processing the ultra-short pulses in case of either passive (implemented with linear materials) of active (with nonlinear materials) devices. Moreover, from the technological point of view such PhC waveguides with filters can be easily integrated into the electronic circuit which reduces costs and production time.
Unfortunately, optical losses and back reflection from such a filters makes them unsuitable for high-speed integrated optical circuits.
In this work we propose analysing both density of modes (DOM) and the transmission spectra to optimize the parameters of the PhC filters made of linear or nonlinear material.
Proposed characteristics have been first introduced to optimize the PhC filters used for wavelength division demultiplexing3. However, since waveguiding properties have not been taken into account, the photonic density of states maps as well as transmittance maps can be applied with high accuracy to a bulk PhC but not to confined PhC filter. Taking into account waveguiding properties provides great enhancement to the precision of characterization of the confined PhC filters.
2. Theoretical background
In out work, we investigated the DOM maps of linear and nonlinear PhC wideband filters with varying radiation intensity. The DOM of the waveguides and confined filters is computed similar to photonic density of states of the PhC:
where
To compute the dispersion diagram of the PhC filter confined by PhC waveguide there can be used plane wave expansion (PWE) method or finite difference time domain (FDTD) method. The first one allows fast and accurate determination of the PhC eigen-states while the second one allows considering nonlinear materials.
To obtain the characteristics of the nonlinear filters, we have selected the FDTD method with auxiliary differential equation (ADE) which was successfully used to simulate solitons propagation in Kerr-nonlinear medium4. The method allows solving the system of Maxwell’s equations considering nonlinearity of the material.
Since we investigate 2D PhC presented by the system of holes in non-magnetic materials, we can reduce the Maxwell’s equations to 2D case. Moreover, since such kind of PhC possesses large PBG only in case of TE polarization (as refered to in 5), we consider the following system of equations 6:
where
Particularly, in case of non-saturable Kerr nonlinearity polarization current density is given in following form 4:
where
However, in our work, we consider Kerr-saturable nonlinear materials and nonlinear susceptibility terms. Assuming slowly varying amplitude of the field
and corresponding polarization current takes form:
Applying the FDTD-ADE technique to above mentioned system of Maxwell’s equations with polarization current term taken in form (5) we can compute time-dependent electromagnetic field distribution in nonlinear saturable media. Assuming perfectly-matched layer8 at the boundary of computation region we can characterize nonlinear PhC devices while with periodic boundary conditions we get the data to compute eigen-states of the PhC.
2.1. Band structure computation with FDTD-ADE method
To find eigen-states of a PhC using the FDTD method, it is necessary to define properly the computation region, the boundary conditions and the scanning pulse parameters.
The computation region should consist of unit cell of an infinite periodic structure. Although it puts some restrictions on applications of the method, it allows to reduce significantly the computation time and resources. The unit cell configurations in case of 2D PhC, PhC waveguide and PhC filters are presented in Figs. 1a, 1c, 1e.
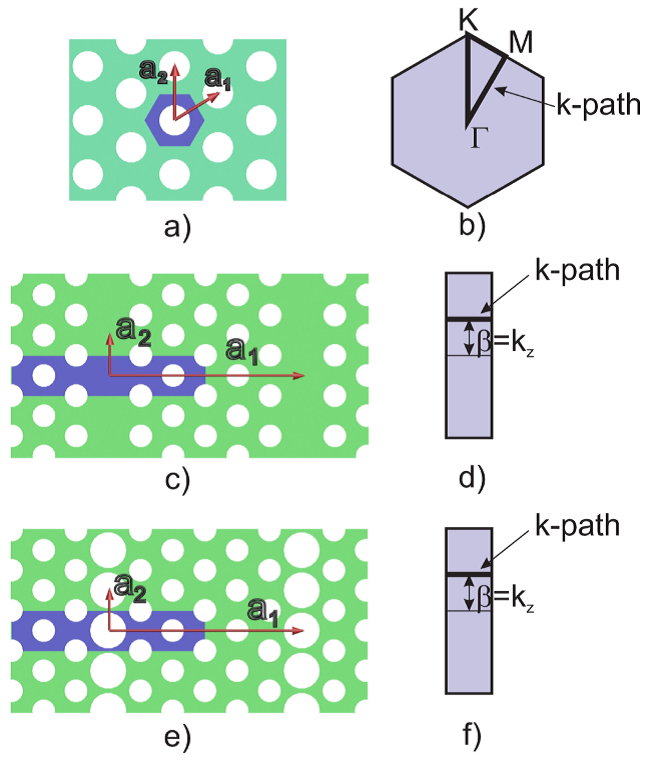
Figure 1 Unit cells, Brillouin zones and k-paths of the regular PhC (a,b), PhC waveguide (c,d) and PhC filter (e,f).
As long as the computation area should take shape and size of the PhC unit cell, the periodicity emulation of the structure should be set manually. It is achieved by setting up periodic boundary conditions at the edges of the computation domain.
A special kind of periodic boundary conditions referred to as Bloch periodic boundary conditions9 allows emulate electromagnetic wave propagation possessing different wave vectors:
where
The wave vector components are usually taken according to the k-path defined for a specific problem. Particularly, in case of 2D PhC, PhC waveguide and filter, the k-path is shown in Figs. 1b, 1d, 1f.
To compute eigen-states of the PhC structure, first it should be obtained temporal response of the structure on the probe pulse. For this reason the probe pulse possessing wide spectrum should be used.
The radiation can be introduced to the structure in various ways. However, we will consider excitation from a single point of the computation region. The pulse shape which provides wide spectrum may also be selected in various ways. The simplest shapes are delta-pulse and Gaussian-shaped high frequency signal. In our work, we investigated the structure response to a delta-pulse introduced in a single moment of time. The excitation function in this case takes following form:
It is widely known that the spectrum of the delta-pulse is infinitely wide so it gives structure response sufficient to find the eigen-states of required frequency range. After the delta-pulse is introduced, the excitation is turned off, however, due to periodic boundary conditions, radiation exists long enough to obtain the structure response.
Spectral analysis of the temporal response can be carried out by fast Fourier transform (FFT). The accuracy of the method achieves its maximum when computation time is infinite. However, it is always limited by finite time and computation resources.
The example of the FFT of the structure response to the delta-pulse excitation is shown in Fig. 2.
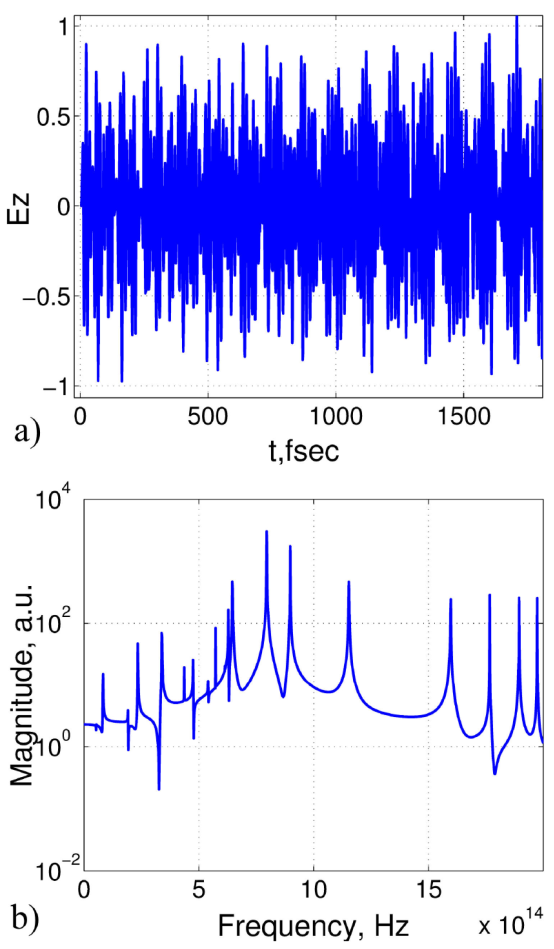
The eigen-states of the structure are searched for as local maxima at the response spectrum. Detailed analysis should be made to avoid spurious solutions.
In Fig. 3a it is shown the example of the band structure computation of 1D PhC. Figure 3 demonstrates result of spectra analysis compared to the results obtained by the PWE method.
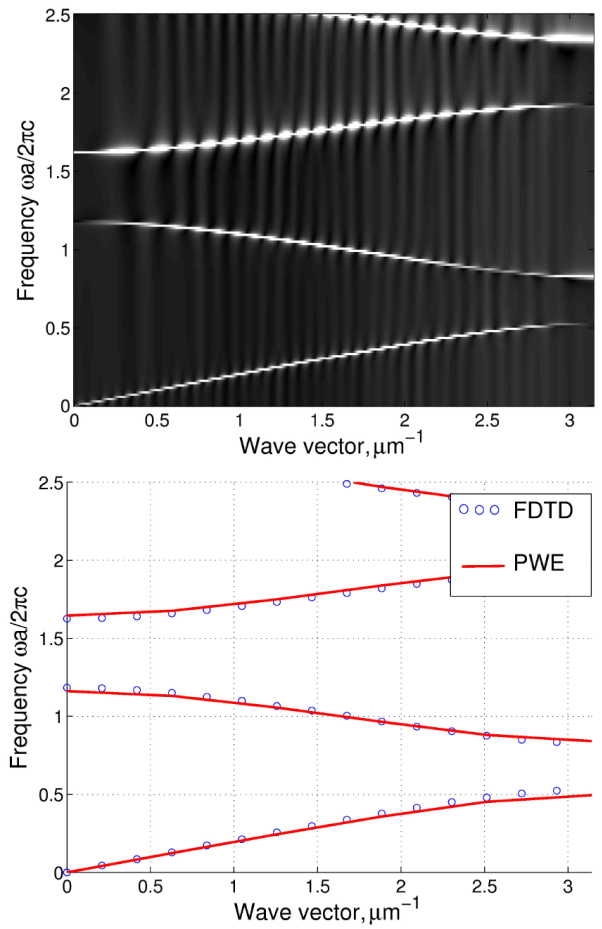
Figure 3 (a) Temporal response spectra and (b) 1D PhC band structure as compared with one obtained by PWE method.
Final representation of the results obtained by the presented method depends on kind of the periodic structure the equation is solved for. In case of regular PhC the results are presented in form of the band structure, i.e. the eigen-frequencies found at different symmetry points. For PhC waveguides and confined filters, the results are found as the eigen-frequencies versus the propagation constant and represent the dispersion diagram of the structure.
2.2. Density of modes
We investigated the density of modes of both linear and nonlinear PhCs. In case of linear ones, we computed DOM by means of both PWE and FDTD methods. However, the FDTD method can only be used in case of nonlinear PhC strcuture.
DOM computation of a PhC by means of the PWE method is quite difficult task since the dispersion diagram of the PhC waveguide is represented as a set of eigen-values. DOM is calculated according to the (1) and, therefore, the best way to compute it is to trace waveguide modes and then to sum up the lengths of the segments within the required frequency range. Moreover, since in PWE method we approximate the waveguide with an infinite periodic structure, we have to separate waveguide modes from the trash. For this, we have to compute the continuum of states and then clear all the eigen-states within the continuum of states.
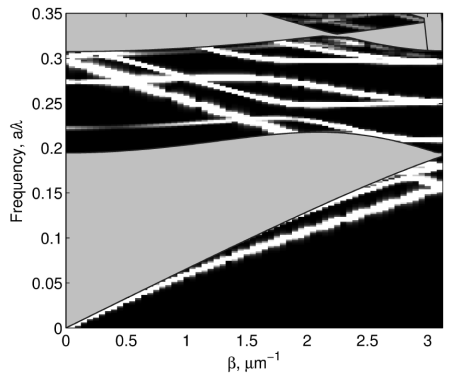
On the other hand, when the FDTD method is used the spectra can be used directly as is shown in Fig. 4. It is only necessary to clean the data according to the continuum of states and then the DOM at specific frequency is computed as a sum of the intensities at all k-points.
3. Results and discussion
In the work, there has been investigated the PhC filter confined with the hexagonal 2D PhC waveguide (see Fig. 5) presented by the system of holes drilled in silica with

First, there have been computed the DOM and the transmission maps of the waveguides W1 to W3 with filters filling all the waveguide space. The DOM maps are obtained both by the PWE (Fig. 6b) and the FDTD (Fig. 6c) methods 10,11.
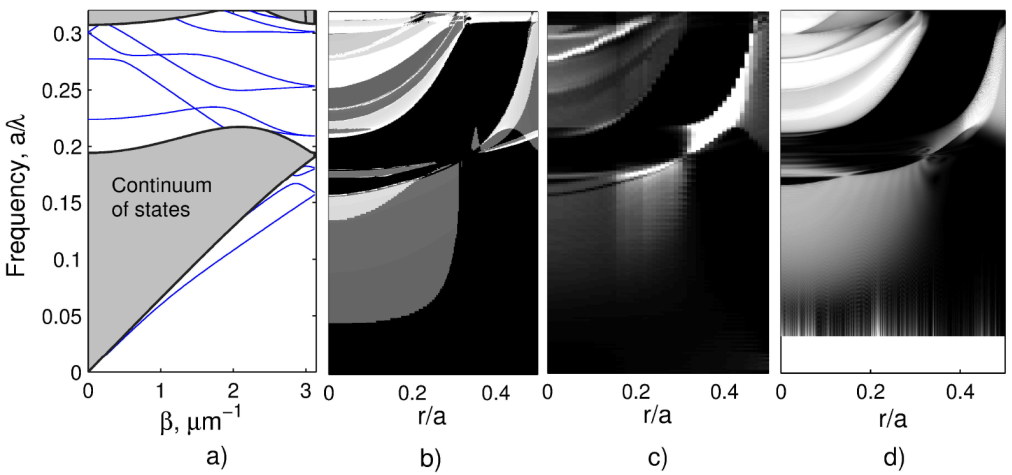
Figure 6 Dispersion diagram, (a) density of modes maps of the waveguide compuded by means of PWE and (b) FDTD (c) methods and transmission map of the W2 waveguide(d).
The transmission map (Fig. 6d) has been obtained by direct computation of the transmission spectra by means of the FDTD method . The transmission spectrum of the PhC filter confined with W2 waveguide has been computed for specific
Both DOM and transmission spectra are obtained for the specific values of the PhC filter parameters. To calculate the map, the parameters are varied within the range
In Fig. 6, the first characteristic is the dispersion diagram of the W2 waveguide without the filter with six modes inside the photonic band gap. It corresponds to
As is seen from the figure, both DOM and transmission map represent similar characteristics allowing to perform the precise parameters selection. However, using the PWE method the DOM maps can be computed much faster than the transmission one. Moreover, unlike the transmission maps, they also cover the lowest frequency range (from 0 to 0.03) which makes them more effective tool for the filters investigation.
Investigating the behavior of the DOM and transmission with growing holes radius of the filter, we can see that transmission at the total internal reflection state vanishes when the radius of the filter PhC becomes larger than the one of the surrounding PhC
On the other hand, the transmission is also absent at the PBG when the filter holes radius is
The growth of the transmittance continues when the holes radius becomes significantly larger than the one of the background PhC.
After this, we have computed the DOM maps for W2 PhC waveguide both in linear (low intensity) and nonlinear (high intensity) cases (see Figs. 7b and 7c). The difference between the characteristics is given in Fig. 7d. As is seen in figures nonlinear DOM shift only appears at large values of
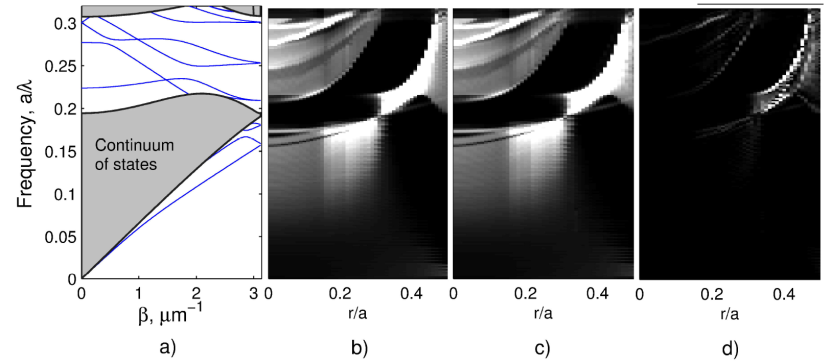
Figure 7 (a) Dispersion diagram and (b) DOM maps of the filter at low and (c) high intensities and (d) their difference.
It should be mentioned that the nonlinear shift is only observed for the PBG modes (higher than the low-frequency continuum of states). This particular observation leads to important conclusion. Namely, in the structures similar to the ones investigated in the work, the total internal reflection modes are not affected by the nonlinear index changes.
Although, linear and nonlinear DOM maps look similar, even such insignificant DOM shift may give raise to interesting nonlinear effects as bistability and optical power limiting.
4. Conclusion
In the paper, there have been computed the density of modes maps which allow to take into account waveguide properties when computing the PhC filter characteristics. This improves significantly the accuracy of parameters selection when designing the devices on their basis.
Comparison between DOM maps obtained by the PWE and FDTD methods demonstrates their full correspondence to the transmission spectra of the filter. The PWE method gives more accurate results and allows investigate in details the eigen-states properties and behavior. On the other hand, DOM computed by means of the FDTD method give better representation of an actual transmission spectra and can be applied for design of the micro-devices.
Computed DOM map of the nonlinear PhC demonstrated significant variation of the DOM at large radii of the filter holes due to a larger fill-factor of the nonlinear material.
Proposed DOM maps allow precise description and optimization of the PhC filter properties with much lower computation time.

