


 nova página do texto(beta)
 Inglês (pdf)
 Artigo em XML
 Referências do artigo
 Enviar este artigo por email
 Citado por SciELO
  Similares em
SciELO
Similares em
SciELO 
 Permalink
INTRODUCTION
Parkinson's disease (PD) is a neurodegenerative disorder that affects adult patients. It is the second most common neurodegenerative disease after Alzheimer's disease. Its prevalence is estimated at 0.3% of the world population, with an incidence of 8-18 cases per 100,000 inhabitants per year. Clinically, PD presents with the motor triad: resting tremor, bradykinesia, rigidity, and postural instability1. Nonmotor symptoms have also been described, including neuropsychiatric, sleep, autonomic, and sensory disorders, as well as apathy, fatigue, and hyposmia2.
PD is diagnosed by clinical examination of the patients using the criteria of the International Parkinson and Movement Disorders Society (MDS) for PD (MDS-PD criteria)3. The disease is staged using the Hoehn and Yahr clinical scale (H and Y); according to the symptoms, this scale estimates the extent of impairment and physical disability in a patient on a 0-5 range4. The MDS unified PD rating scale (MDS-UPDRS) is a classification system designed for longitudinal follow-up of PD cases5.
Alpha-synuclein (α-syn) aggregation is the histopathological hallmark of PD. However, the presence of free radicals and reactive oxygen species, abnormal protein clearance, mitochondrial dysfunction, dysfunction of the ubiquitin-proteasome system, and neuroinflammation are also known to play a role in PD6. It should be noted that the accumulation of α-syn may be due to a genetic predisposition, such as the PARK-1 mutation, or triggered by an unknown environmental agent. Histologically, PD is characterized by neuronal α-syn inclusions in the neuron cell body (Lewy bodies) and processes (Lewy neurites)7. A progressive death of dopaminergic neurons of the nigrostriatal pathway and a consequent decrease in dopamine levels are observed in idiopathic PD8. A loss of 70-80% of dopaminergic terminals in the striatum and more than 50% of dopaminergic neurons in the substantia nigra are common in the pre-symptomatic stage. However, symptoms in this stage are non-specific, so the disorder may go unnoticed9. Once dopamine levels decrease to a critical level – often with 80% of neuronal death in the substantia nigra pars compacta symptoms and signs of PD become evident8.
A definitive diagnosis of PD still relies on postmortem findings10. While there is no cure for PD, early detection and intervention are critical to reduce or slow down neurodegeneration9,10. In this regard, developing sensitive and specific biomarkers for an early and accurate diagnosis and patient follow-up are crucial. Among potential biomarkers, emphasis has been placed on those expressed in blood, given the ease of access and sample collection. DJ-1 isoforms, serum urate, ApoA1, epidermal growth factor (EGF), and α-syn are some of the most promising PD biomarkers11. However, DJ-1 levels do not differ between PD patients and healthy controls12. On the other hand, low serum urate levels are indicative of increasing risk and motor severity of PD13, while lower ApoA1 levels suggest a higher risk of PD14. Lower EGF levels are associated with an increased risk of cognitive impairment11. These biomarkers are useful to gauge disease risk and severity but have little diagnostic value by themselves13.
In turn, α-syn is an accessible but inconsistent biomarker, because peripheral cells, especially erythrocytes and platelets, produce it abundantly9. A possible alternative to avoid interference is the use of α-syn in exosomes as a biomarker of PD. This is justified, on the one hand, because α-syn accumulation is the hallmark of PD and, on the other hand, because the mechanism for releasing α-syn under conditions of cellular stress in PD results in increased exosome-associated α-syn levels15.
Exosomes are extracellular microvesicles (EVs), 30-100 nm in diameter, enclosed by a lipid bilayer16. They are released into the extracellular space after multivesicular bodies (MVBs) fuse with the plasma membrane17. Their complex composition includes proteins (membrane, fusion, heat shock, tetraspanins, and MVBs biogenesis transporters) and lipids (cholesterol, sphingolipids, phospholipids, and bisphosphonates)18. EVs contain cytosolic proteins, typically involved in signal transduction, adhesion, antigen presentation, co-stimulation, or with enzymatic function. They also contain messenger RNA, microRNA (miRNA), and long non-coding RNA19. Their content depends on the type of cell of their origin and the microenvironment where they were generated17.
EVs are involved in biological processes such as angiogenesis, coagulation, cellular homeostasis, and inflammation. In addition, they help to eliminate non-functional components or waste products accumulated in the cell cytoplasm20. EVs are able to fuse with target cells to transfer cellular components and establish cell-to-cell communication18. However, they also carry pathogenic proteins, leading to impaired neuronal function9. EVs carry a unique, disease-specific cargo and are detectable in vivo in blood and other fluids. This suggests that proteins in nervous system-derived blood EVs have potential value as biomarkers for PD15.
Quantification of EV α-syn in plasma and cerebrospinal fluid (CSF) in various cohorts has shown that CSF screening is more specific and provides more consistent results21,22. However, due to the invasive and difficult collection process, CSF is not considered as the best option23. In another study, α-syn in blood EVs, while more non-specific, had levels comparable to those in CSF15. Finally, plasma EV α-syn showed a significant correlation with disease severity (UPDRS III)24,25. Thus, since EV α-syn levels are related to the pathophysiology and severity of PD9, the objective of this study was to analyze the available evidence on blood EV α-syn in a meta-analysis to determine its potential usefulness as a biomarker for PD.
METHODS
Search strategy
An electronic literature search was conducted using the databases MEDLINE (through PubMed), EMBASE, COCHRANE, and WEB OF SCIENCE. The following keywords were used in the search engines of each base: "alphα-synuclein" or "α-syn;" "Parkinson's Disease" or "PD;" "exosome," "exosomal," or "extracellular vesicles;" "serum" or "blood-based;" "plasma;" and "biomarker." The following filters were applied: (1) Results per year, restricted to 11 years, from January 2011 to December 2022 (EV publication in this regard began in July 2014); (2) availability of full text; and (3) type of article, with preference given to clinical trials and systematic reviews. A systematic search was conducted in the reference lists of relevant studies to look for publications that met the inclusion criteria. Only papers written in English were considered.
Inclusion and exclusion criteria for studies in the meta-analysis
Inclusion criteria were as follows: (1) Measurement of blood (serum or plasma) EV α-syn concentrations in patients and controls. (2) Comparison of blood EV α-syn concentrations between patients and controls. (3) Patients were diagnosed with PD by the UK PDSBB or MDS criteria. (4) Patients and controls of both sexes were included. (5) Older adult patients were included. (6) Independent pharmacological treatment was provided. (7) Patient demographics, such as disease duration or stages, were measured by the Hoehn and Yahr scales, UPDRS III (motor part), or total UPDRS. (8) The studies were published from July 2014 through May 2021.
Exclusion criteria were as follows: (1) Patients diagnosed with other neurodegenerative diseases or other forms of parkinsonism. (2) Presence of inflammatory, infectious, or autoimmune diseases. (3) Detection of an EV biomarker other than α-syn. (4) Measurement of α-syn outside of EVs (non-EV α-syn) in CSF, urine, saliva, and/or blood.
Data extraction
Two researchers (V.H. Juárez Vaquera and V. Morales Ruiz) independently extracted information and data from the studies included in the meta-analysis according to the inclusion and exclusion criteria. Any discrepancies in studies that failed to meet any of the criteria were resolved by discussion with a third researcher for their consideration to be included in the meta-analysis.
Web applications were used to extract data from those articles whose results were reported as a plot. WebPlotDigitizer (https://apps.automeris.io/wpd/) was used to obtain EV α-syn concentrations by interpolation in the figures in the articles. On the other hand, the mean and standard deviation of the interpolations were determined by the web application Mean Variance Estimation (http://www.math.hkbu.edu.hk/~tongt/papers/median2mean.html).
Of all included studies, the first author, year of publication, type of sample, EV isolation method, and analytical method are indicated. Sex, age, Hoehn and Yahr (H and Y) scale score, unified motor and total UPDRS III score, mini-mental state examination score, Montreal cognitive assessment score, and duration of PD are indicated for all included participants. For papers reporting EV α-syn concentrations for different groups of patients, weighted mean and standard deviation values were calculated, accounting for the number of participants in each group.
Statistical analysis
In the first analysis, raw values of blood EV α-syn concentration (mean and standard deviation) in patients and controls from each study were compared using a paired Wilcoxon test. Given the high variability in the EV α-syn concentrations reported (e.g., Si et al. vs. Zhao et al.)26,27, in a second analysis, data scaling was performed separately for control and patient data in each study. Scaled blood levels of EV α-syn (mean and standard deviation) in patients and controls in each study were then compared with Student's t-test for independent samples. Heterogeneity among studies was assessed by the I2 metric. Significant indices with an I2 = 50% were considered as highly heterogeneous.
The meta-analysis was performed with the R statistical program28. Given that the data showed a high heterogeneity, the random-effects model was used. p < 0.05 was considered as indicating statistically significant differences. To assess publication bias, funnel plots were constructed, and an Egger's regression test was performed to evaluate asymmetry.
RESULTS
Characteristics of included studies and individuals
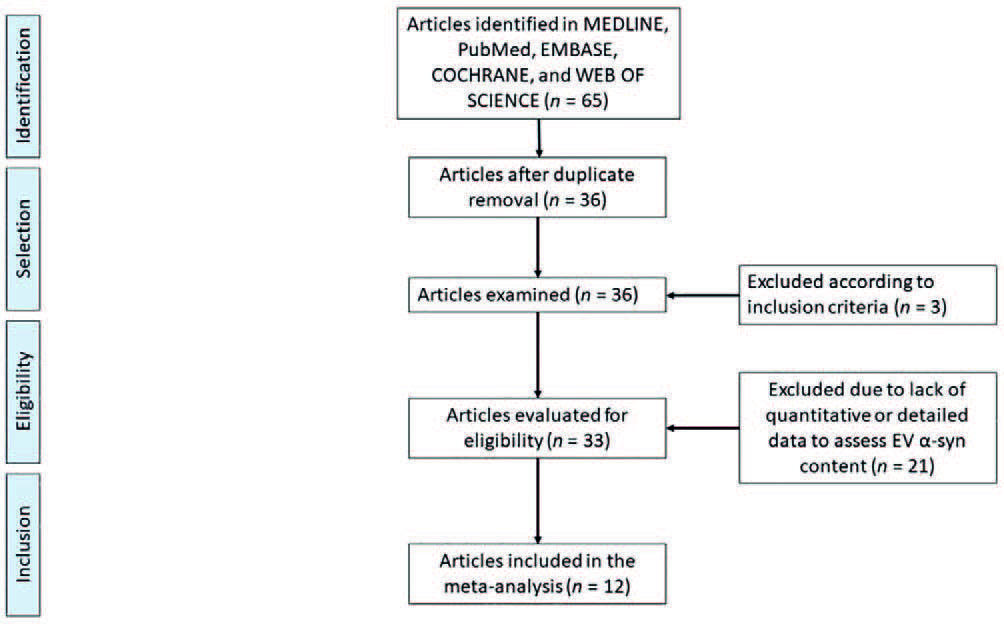
Thirty-six articles analyzing EV α-syn content were retrieved; of these, three articles that failed to meet the inclusion criteria were eliminated, and 21 articles were eliminated because they did not contain quantitative or detailed data allowing us to calculate EV α-syn content. Finally, 12 papers that met all criteria were included: Shi et al.; Cerri et al.; Zhao et al.; Xia et al.; Si et al.; Niu et al.; Zou et al.; Jiang et al.; Fu et al.; Agliardi et al.; Dutta et al.; and Shim et al.15,24-27,29-35. A flowchart describing the process for study selection is shown in figure 1.
A total of 913 PD patients and 706 controls were included in the meta-analysis. Sample type, EV isolation method, assay method for α-syn quantification, as well as the demographic and clinical characteristics of patients and controls, are shown in table 1. The raw values of blood EV α-syn concentration in patients and controls are shown in supplementary table 1.
Table 1. Demographic and clinical characteristics of included studies using α-synuclein content in EVs as a biomarker
| Study | Sample | EV purification | Analytical method |
Sensitivity/ Specificity |
n | PD patients | Control subjects | ||||||||
|---|---|---|---|---|---|---|---|---|---|---|---|---|---|---|---|
| Sex (F/M) | Age (years) |
H and Y | UPDRS III (Motor) |
UPDRS (Total) |
Duration of disease (years) |
MMSE | MoCA | Sex (F/M) | Age (years) |
||||||
| Shi et al. (2014)15 |
Plasma | Immuno- capture¢ |
Luminex | 70.1%/52.9% | 482 | 119/145 | 66.30
± 9.10* |
2.40
± 0.70* |
28.40
± 12.60* |
– | 9.60
± 6.60* |
28.00
± 2.60* |
– | 99/116 | 65.70
± 9.10* |
| Cerri et al. (2018)24 |
Plasma | Ultra- centrifugation |
ELISA | – | 72 | 14/25 | 65.20
± 8.90* |
2.10
± 0.70* |
18.90
± 10.60* |
– | 9.50
± 6.20* |
– | – | 18/15 | 61.90
± 6.20* |
| Zhao et al. (2019)27 |
Plasma | Immuno- capture¢ |
ELISA | 48.7/85% | 79 | 16/23 | 67.50
± 6.90* |
1-5 | 48.60
± 21.00* |
– | 5.00
± 3.20* |
– | – | 23/17 | 66.60
± 8.80* |
| Xia et al. (2019)29 |
Plasma | Ultra- centrifugation |
ELISA | – | 25 | 6/14 | 70.00
± 6.22* |
3.05
± 0.39* |
42.40
± 10.17* |
– | 11.50 | – | – | – | 68.20
± 3.12* |
| Si et al. (2019)26 |
Serum | Immuno- capture¢ |
ELISA | 66.7%/71.1% | 56 | 18/20 | 62.44
± 0.004* |
1.65
± 0.03* |
18.52
± 0.76* |
28.86
± 0.66 |
2.18
± 0.63* |
– | – | 10/8 | 62.67
± 2.35* |
| Niu et al. (2020)30 |
Plasma | Immuno- capture¢ |
ECLIA | 100%/57.1% | 74 | 28/25 | 65
± 5.30* |
2.00
± 0.50* |
22.30
± 10.30* |
– | – | 27.60
± 2.60* |
23.60
± 3.60* |
10/11 | 64
± 5.40* |
| Zou et al. (2020)25 |
Plasma | Immuno- capture¢ |
ELISA | 55%/61% | 178 | 40/53 | 66.93
± 9.52* |
2.80
± 0.50* |
28.73
± 16.04* |
49.23
± 18.13 |
4.26
± 2.52* |
24.28
± 2.88* |
– | 37/48 | 66.22
± 10.30* |
| Jiang et al. (2020)31 |
Serum | Immuno- capture¢ |
ECLIA | 83.5%/72.5% | 374 | 81/149 | 66.22
± 0.03* |
– | 25.02 | – | 7.52
± 1.69* |
– | 27.35 | 50/94 | 60.72
± 1.69* |
| Fu et al. (2020)32 |
Serum | Immuno- capture¢ |
ECLIA | – | 40 | – | – | – | – | – | – | – | – | – | – |
| Agliardi et al. (2021)33 |
Serum | Immuno- capture¢ |
ELISA | 78.1%/75.0% | 72 | 11/21 | 69.47
± 8.56* |
1-3 | 28.52
± 13.16* |
– | 6.28
± 3.63* |
– | 24.23
± 2.48* |
19/21 | 67.45
± 7.64* |
| Dutta et al. (2021)34 |
Serum | Immuno- capture¢ |
ECLIA | – | 104 | 20/33 | 72.0
± 10.2 |
2.3 ± 0.8 |
26.0
± 13.3 |
– | 8.1 ± 3.8 |
27.6
± 2.3 |
– | 28/23 | 66.6
± 8.9 |
| Shim et al. (2021)35 |
Plasma | Ultra- centrifugation |
ELISA | – | 63 | 4/30 | 74.2
± 4.7 |
1.51
± 0.58 |
40.0
± 13.1 |
– | 5.1 ± 4.3 |
24.7
± 3.8 |
– | 5/24 | 73.9
± 4.6 |
*Results are presented as mean ± standard deviations.
¢EVs derives from CNS or neurons using L1CAM as marker. ELISA: enzyme-linked immunosorbent assay; ECLIA: electrochemiluminescence immunoassay; N: total subjects in each study; F: female; M: male; H&Y: Hoehn and Yahr scale; MMSE: mini-mental state examination; MoCA: Montreal cognitive assessment.
As shown, the EV α-syn content in patients was highly variable, between 0.20 ± 0.02 and 9.687.50 ± 2.800.00 pg/mL (Si et al. vs. Zhao et al.)26,27. Therefore, data scaling for each study was performed for the sake of comparability. Results are shown in supplementary table 2.
Meta-analysis results
The 12 included studies were analyzed to determine the concentration of EV α-syn in patients with respect to controls and its relationship to PD. Due to the heterogeneity of the raw values across studies (I2 = 99%, p < 0.01), a random-effects model was used. Significant differences (p = 0.045) were found when the raw values of EV α-syn concentration in blood were compared by a paired Wilcoxon test. The mean standard difference of raw EV α-syn concentration in blood was 1.54 (95%CI 0.18-2.90; p < 0.01) These results indicated a higher expression of EV α-syn in PD patients than in controls in a random-effects model (Fig. 2).

Figure 2. Forest plot of the association between gross concentrations of blood EV α-syn from PD patients and healthy controls.
When the scaled data were analyzed (Fig. 3), similar indices of heterogeneity and a mean standard difference of 1.53 (95%CI 0.23-2.83; p < 0.01) were found. Significant differences were found (p = 0.001) when scaled values of α-syn concentration in blood EVs were compared by an unpaired Student's t-test; similarly, when studying raw values, a higher expression of EV α-syn was found in PD patients than in controls in a random-effects model.
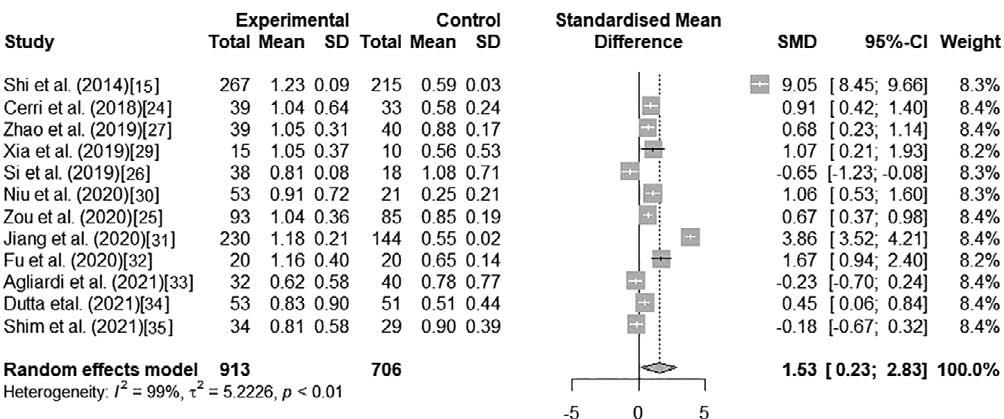
Figure 3. Forest plot of the association between escalated blood EV α-syn concentrations of PD patients and healthy controls.
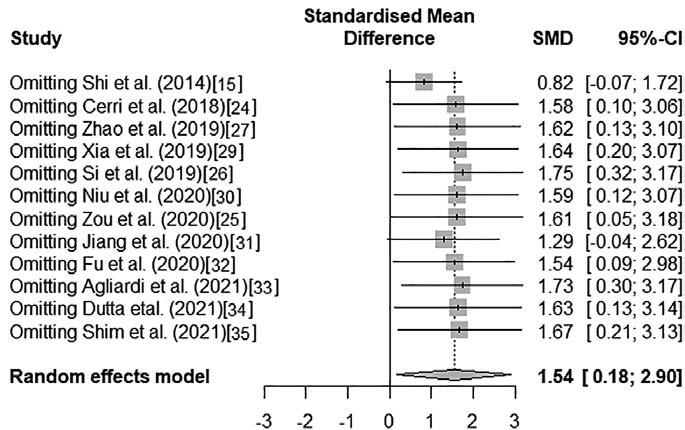
Finally, a sensitivity analysis was performed to determine the influence of each study on the overall effect estimate, both on raw and on scaled data. As shown in figures 4 and 5, no single study had a large overall influence, except for Shi et al.15, whose exclusion modified significantly the overall effect. The difference and effect size reported by Shi et al. are remarkably larger than that of the rest of the studies (Standardized mean difference [SMD] > 9, Figs. 2 and 3); meanwhile, this is also the study with the largest sample size (n = 482). The study by Jiang et al.31 will presumably have a similar effect if discarded subsequently since it also showed large SMD (> 3.5, Figs. 2 and 3) and sample size (n = 374) values. Despite this variation in terms of the magnitude of the effect, both studies are consistent in the direction of the difference, which indicates that the results of this meta-analysis remain robust. The funnel plot was too sparsely populated to detect visually any asymmetries, although the SMD values for some studies were clearly outliers (e.g., Shi et al., Supplementary Fig. 1). Egger's regression test suggests that the plot is symmetrical (intercept = 2.58, 95%CI = -21.96 - -27.11, t = 0.21, p = 0.842), although this could be due to the small number of studies included in the meta-analysis.

DISCUSSION
A systematic review of studies quantifying EV α-syn in the blood of PD patients and healthy subjects is herein presented. Individual studies reported a significant increase in EV α-syn levels in patients with respect to controls. These findings suggest that a higher expression of EV α-syn in PD patients is associated with the disease.
A single study showed decreased EV α-syn levels in patients with respect to controls. This could be explained by the fact that patients in the early stages (low UPDRS scores and H and Y scale 1-2.5) of PD were enrolled in that study. In addition, the authors suggested that there is an inverse relationship between α-syn levels and disease duration so that lower values of exosomal α-syn could be observed in the early-stage patients enrolled in the study15,26. Lower levels of EV α-syn in blood could also be due to the distribution of patients into subgroups with dominant tremor (DT) and non-DT (NDT). Si et al. have suggested that pathogenic mechanisms may differ between PD subgroups; for example, the NDT phenotype shows greater intellectual impairment than the DT phenotype, which results in a higher variability in the clinical assessment of PD26. Such variability is evidenced by lower levels of exosomal α-syn in the NDT phenotype compared to the DT phenotype; therefore, serum exosomal α-syn could be potentially used to differentiate motor types in the early stages of PD and to follow up the disease progression26.
Other studies have suggested that EV α-syn levels could be useful for monitoring the progression of PD and other alphα-synucleinopathies. Shi et al.15 and Cerri et al.24 found a significant correlation between plasma concentrations of EV α-syn and PD severity (UPDRS III) or pathological status. Therefore, the potential use of EVs in the early diagnosis has its rationale in that they carry a unique, specific, and functionally important cargo for intracellular processes, particularly in neurodegenerative disorders9. EV α-syn could be particularly useful for PD because EVs have two main functions in the pathology of the disease. The first is their role as mediators of the transfer of α-syn between neurons36; in fact, damaged dopaminergic neurons can produce EVs as a mechanism to remove protein aggregates. The second is their capacity to carry other bioactive molecules, including proteins, enzymes, and miRNAs, which regulate cellular processes36. The use of miRNAs in EVs as biomarkers for PD has been proposed37, but this is still debated.
Our meta-analysis showed a high heterogeneity in the levels of EV α-syn (Figs. 2 and 3). This was due to differences in the sample sizes used in the studies included and to one study showing lower values of EV α-syn in PD patients than in controls. Such heterogeneity could also be due to the method of EV isolation because the isolation protocol is selected depending on the biological sample, its quantity, and protein profile38. Therefore, the method used to obtain pure EVs is critical to evaluate their potential value as biomarkers. While ultracentrifugation is an efficient method to isolate EVs20,24,29, immunoisolation is less affected by impurities in biological samples15,20,25-27,30-35. To reduce the occurrence of impurities in EV preparations, nine out of 12 included studies used immunoaffinity purification methods to capture selectively specific EVs from a complex sample20. The authors isolated the EVs containing L1CAM by immunocapture. Considering that L1CAM is a cell adhesion molecule primarily expressed in the nervous system, the authors suggested that all captured EVs were originated in the CNS. However, L1CAM expression is not exclusive to the CNS, since it could be expressed in non-CNS cell types39. Whether these cells also release L1CAM-expressing EVs is still unknown. Thus, it is mandatory to determine whether other molecules accompany L1CAM before it can be used as a surface marker for CNS-derived EVs15.
The specificity and yield of EVs isolated by immunocapture are similar to those obtained by ultracentrifugation. In addition, the use of magnetic particles for immunocapture produces 10-15 times higher EV yields than ultracentrifugation40. Immunoprecipitation has the advantage of being faster, easier, cost-effective, and compatible with standard laboratory equipment20. On the other hand, the use of immunocapture versus ultracentrifugation could raise doubts about the origin of EVs, since it has been proposed that immunocapture may target a subpopulation of CNS-derived EVs. However, few molecules have been used to purify and obtain EVs from brain tissue, and their specificity remains questionable. Ultracentrifugation isolates all circulating EVs, including those from the periphery and CNS-derived EVs. Thus, it is possible that the high levels of plasma α-syn measured in some of the studies here included are due to periphery-derived EVs. Both strategies (immunocapture and ultracentrifugation) are potentially useful, but it is necessary to develop molecules capable of capturing EVs specifically derived from the brain. This would allow us to explore further the potential of EVs as a biomarker for PD, evaluating their levels in different stages of the disease or correlating them with the number and severity of motor symptoms.
Among the methodologies used to quantify EVs (Table 1), ultracentrifugation is accessible in common laboratories; it is low-cost and could be useful in most settings, even though its effectiveness is lower. In contrast, immunocapture is more efficient and effective and provided that the capture molecules are well designed to capture specific EVs, with the drawback of being more expensive.
The method of quantification of EV α-syn could be another key factor in explaining the heterogeneity among the studies. α-syn can be measured by Western blot, enzyme-linked immunosorbent assay (ELISA), Luminex assay, or mass spectrometry21. ELISA is very sensitive and specific; however, the result should be read as soon as possible to prevent erroneous measurements. The Luminex assay is highly sensitive and specific, and it requires a small amount of sample, although monoclonal antibodies are required to achieve high specificity. Any contaminant or hemolysis during sample collection or processing may result in higher levels of α-syn in plasma21.
A high variability in sensitivity (48.7-100%) and specificity (52.9-85%) for EV α-syn levels was found in the included studies. On the other hand, the fact that some studies subdivided their groups of PD patients could further increase this variability in EV α-syn levels across studies26,33. The use of EV α-syn as a biomarker is very promising, provided that the sensitivity and specificity are validated in a large cohort of patients, with optimal methodology.
Thus, to reduce the estimation uncertainty in our meta-analysis, a random-effects model was used to account for factors that vary between studies, such as the number of participants, disease severity, methodology used to obtain EVs, purity of EVs, and the method to quantify EV α-syn. While quantification methods and population characteristics must be standardized, the association between increased α-syn contained in EVs and PD is clear. This finding is consistent with the formation of α-syn clusters in dopaminergic neurons that mark the pathophysiology of PD. This meta-analysis shows that α-syn levels in EVs are consistently increased in subjects with PD. The findings herein reported support this proposal, and EV α-syn could be a promising candidate for the diagnosis and a biomarker for the follow-up of PD.
Given the consistent differences in EV α-syn blood concentrations between healthy controls and patients, we can conclude that this species has the potential as a biomarker for PD. We also observed a wide variation of EV α-syn levels in the available literature; therefore, further studies would be required to establish, in which extraction and quantification method has a higher sensitivity. Finally, we detected the lack of longitudinal studies analyzing the content of EV α-syn at different stages of PD, or how EV α-syn concentrations respond to different treatments. This points to areas of opportunity in the path to validate EV α-syn as a biomarker for PD.

