


 text new page (beta)
 English (pdf)
 Article in xml format
 Article references
 Send this article by e-mail
 Cited by SciELO
  Similars in
SciELO
Similars in
SciELO 
 Permalink
INTRODUCTION
COVID-19 is an infectious disease caused by the SARS-CoV-2 virus. This disease is considered a worldwide emergency and has caused nearly 6 million deaths in 2 years. Most people infected by the virus will develop mild or moderate illness; however, a certain percentage of the population will experience severe and critical disease. People with underlying illnesses, such as diabetes, cancer, cardiovascular disease, arterial hypertension, renal disease, and obesity, among others, are more likely to develop severe COVID-19 complications, and even could not survive1. Effective clinical management of these patients will depend on early stratification based on their clinical characteristics2.
Since predicting the early outcomes of COVID-19 is challenging, machine learning (ML) models could help physicians in identifying high-risk individuals. ML approaches such as support vector machines (SVMs)3, random forests (RFs)4, or deep neural networks based5 have been implemented for analyzing X-ray or computed tomography (CT) images6 with the aim to stratify high-risk COVID-19 patients. Other studies have focused on blood tests, sociodemographic data, and comorbidities to develop COVID-19 diagnostic and prognostic models, including ML techniques7-10.
In addition, other authors have trained an ML model using proteomics and metabolomics measurements from a training cohort of non-severe and severe COVID-19 patients, identifying potential blood biomarkers for severity prediction11. Since the identification of biomarkers associated with survival and death remains a major challenge for early prognosis, Sardar et al.12 developed AI-based algorithms for predicting COVID-19 patient’s survival or death based on a publicly available dataset, consisting of clinical parameters and protein profile data of hospital-admitted COVID-19 patients12.
Despite metabolomics and proteomics offer multiple advantages for the identification of predictive biomarkers, the technologies to perform these kinds of experiments are not widely available in hospitals or health institutions, where the physicians need affordable tools to early stratify patients. Considering this, in the present work, we propose two ML models based on previously collected information: a basic model (with clinical and demographic data only) and an extended model (with the addition of immunological and metabolomics data). The basic model will be of particular interest for clinicians. However, when metabolic and immunological information may be available, the models to classify patients gain predictive power, mainly for low-risk patients, although these characteristics lose relevance for predicting severe, critical cases or death.
METHODS
Study population
Patients were recruited at the respiratory triage unit in a Zone Hospital of the Mexican Social Security Institute, in Zacatecas, Mexico, from March to November 2020. The control group (37 subjects) included patients negative to the SARS-CoV-2 PCR test; Group 2 (mild) included 37 patients with a positive result in the COVID-19 test, who presented mild symptoms. Group 3 (severe) consisted of 35 patients positive to the COVID-19 test, who were hospitalized and required oxygen by nasal cannula. Group 4 (critical) included 45 positive patients that required intensive care and who were mechanically ventilated. From the critically ill patients, 17 survived and 28 patients died. Table 1 shows the clinical and demographic characteristics of all participants, as well as relevant laboratory data collected at the moment of hospital admission, as earlier as 4 days on average since symptoms onset.
Table 1. Clinical and demographic characteristics, including laboratory analyses
| Variables | G1 | G2 | G3 | G4 | p-value |
|---|---|---|---|---|---|
| n = 37 | n = 41 | n = 35 | n = 45 | ||
| Male sex, n (%) | 16 (43.2) |
26 (56) |
16 (45.7) |
29 (64.4) |
0.07 |
| Age, median years (Q1–Q3) | 41 (38–54) |
58 (51–64) |
53 (48–61) |
58 (46–64) |
0.0001 |
| Symptoms to sampling, median days (Q1–Q3) | 2 (1–5) |
3 (0–6) |
3 (1–6) |
5 (2–7) |
0.04 |
| Pneumonia, n (%) | NA | NA | 2 (5.7) |
10 (22.2) |
0.06 |
| ARDS, n (%) | NA | NA | NA | 34 (75.5) |
– |
| Mechanical ventilation, n (%) | NA | NA | 0 (0) |
39 (86.6) |
< 0.0001 |
| Death, n (%) | NA | NA | 8 (22.2) |
28 (77.7) |
< 0.0001 |
| Symptom, n (%) | |||||
| Fever | NA | 22 (53.7) |
21 (60) |
28 (62.2) |
0.4 |
| Cough | NA | 30 (73.1) |
27 (77.1) |
41 (91.1) |
0.03 |
| Headache | 27 (73.0) |
30 (73.1) |
21 (60) |
24 (53.3) |
0.03 |
| Dyspnea | 5 (13.5) |
13 (31.7) |
31 (88.6) |
32 (71.1) |
< 0.0001 |
| Diarrhea | 2 (5.4) |
4 (9.8) |
6 (17.1) |
4 (8.8) |
0.5 |
| Chest tightness | 2 (5.4) |
6 (14.6) |
12 (34.3) |
8 (17.7) |
0.06 |
| Chills | 4 (10.8) |
14 (34.1) |
15 (42.8) |
10 (22.2) |
0.4 |
| Pharyngalgia | 14 (37.8) |
14 (34.1) |
15 (42.8) |
12 (26.6) |
0.4 |
| Myalgia | 14 (37.8) |
21 (51.2) |
19 (54.3) |
19 (42.2) |
0.7 |
| Arthralgias | 11 (29.7) |
22 (53.7) |
19 (54.3) |
18 (40) |
0.5 |
| Rhinorrhea | 6 (16.2) |
8 (19.5) |
6 (17.1) |
2 (4.4) |
0.09 |
| Polypnea | 1 (2.7) |
NA | 6 (17.1) |
8 (17.7) |
0.04 |
| Anosmia | NA | 10 (24.4) |
7 (20) |
4 (8.8) |
0.05 |
| Dysgeusia | NA | 10 (24.4) |
7 (20) |
5 (11.1) |
0.06 |
| Comorbidities, n (%) | |||||
| Diabetes (self-reported) | 3 (8.1) |
4 (9.8) |
18 (51.4) |
9 (20) |
0.01 |
| Obesity (> 30 kg/m2) | 3 (8.1) |
8 (19.5) |
7 (20) |
13 (28.9) |
0.02 |
| Hypertension (self-reported) | 9 (24.3) |
11 (26.9) |
13 (37.1) |
17 (37.7) |
0.1 |
| Admission laboratory data, median (Q1–Q3) | |||||
| Erythrocytes (million/mL) | 5.1 (4.8–5.5) |
5.2 (4.9–5.6) |
5.1 (4.9–5.4) |
5.1 (4.7–5.5) |
0.9 |
| Hemoglobin (g/dL) | 15.4 (14.7–16.3) |
15.3 (14.2–16.1) |
15.0 (14.4–15.8) |
15.3 (13.5–16.5) |
0.7 |
| Platelets (thousands/mL) | 278.8 (238.0–327.0) |
257.0 (206.5–314.0) |
248.5 (213.0–274.0) |
243.0 (184.8–282.0) |
0.06 |
| Leukocytes (×103) | 7.1 (6.05–8.4) |
7.0 (5.4–8.3) |
8.6 (6.7–10.4) |
9.5 (7.6–12.1) |
0.0002 |
| Neutrophils (%) | 60.1 (54.5–66.0) |
66.6 (56.2–75.6) |
79.4 (75.3–83.0) |
85.4 (81.4–90.8) |
< 0.0001 |
| Lymphocytes (%) | 30.5 (25.8–36.0) |
25.1 (15.4–34.5) |
14.3 (10.6–16.8) |
8.8 (5.2–11.8) |
< 0.0001 |
| Neutrophils-lymphocytes ratio | 1.7 (1.5–2.2) |
3.0 (1.6–3.7) |
6.7 (4.5–7.4) |
11.2 (6.7–16.7) |
< 0.0001 |
| Monocytes (%) | 6.8 (5.3–8.7) |
7.1 (4.8–8.8) |
5.1 (3.0–6.1) |
3.5 (2.6–5.0) |
< 0.0001 |
| Glucose (mg/dL) | 93.0 (85.0–103.0)5 |
112.0 (95.8–125.5) |
134.3 (97.0–136.6) |
150.0 (113.0–247.0) |
< 0.0001 |
| Creatinine (mg/dL) | 0.9 (0.7–1.0) |
0.87(0.7–1.0) | 0.85 (0.7–0.9) |
1.0 (0.8–1.5) |
0.01 |
Data acquisition
Metabolites measurement
Amino acids, biogenic amines and derivatives, and organic acids were analyzed by a reverse-phase LC–MS/MS custom assay, while glycerophospholipids, acylcarnitines, glucose, and sphingomyelins were measured by Direct Infusion Tandem Mass Spectrometry (DI-MS/MS) analysis performed on an ABSciex 4000 Qtrap tandem MS instrument (Applied Biosystems/MDS Analytical Technologies, Foster City, CA) equipped with an Agilent 1260 series UHPLC system (Agilent Technologies, Palo Alto, CA). An Agilent reversed phase Zorbax Eclipse XDB C18 column (3.0 mm × 100 mm, 3.5 µm particle size, 80 Å pore size) with a Phenomenex (Torrance, CA, USA) SecurityGuard C18 pre-column (4 mm × 3.0 mm) was used. To quantify organic acids, amino acids, and biogenic amines and derivatives, an individual 7-point calibration curve was generated for each analyte. The ratios of each analyte signal intensity to its corresponding isotope-labeled internal standard mixture were plotted against the specific known concentrations using quadratic regression with a 1/×2 weighting. Lipids, acylcarnitines, and glucose were analyzed semi-quantitatively. Single-point calibration of a representative analyte was built, using the same group of compounds that share the same core structure, assuming linear regression through zero. All data analyses were done using Analyst 1.6.2 and MultiQuant 3.0.3. A detailed description about sample preparation and chromatographic methods was previously reported by our group13.
Cytokines and chemokines measurement
A premixed LEGENDplex™ Human Inflammation Panel (13-plex) (BioLegend, USA) was used to measure plasma cytokine and chemokine levels, performed according to the manufacturer’s instructions. Data were acquired using a FACS CANTO II flow cytometer 4-2-2 configuration, (BD Biosciences, USA) with FirePlex software. Analysis was performed using the LEGENDplex analysis software v8.0. All regression analyses showed an R2 > 0.99.
Data and pre-processing
After a careful inspection of the dataset, 154 patients were included (three patients were eliminated due to significant data missing). For dichotomous variables, 1 was placed for “yes” and 0 for “no;” continuous variables were normalized using the Z-score. For the purposes of the present work, we defined as “basic profile” those characteristics related to clinical and demographic variables. In “extended profile,” we included metabolites and immunological, clinical, and demographic variables.
In total, 156 characteristics were included for the “extended data;” and for the basic data, 33 features plus the class were included. The predictive models were implemented for: (1) non-COVID-19 versus all COVID-19 patients; (2) mild disease versus severe and critical disease; (3) severe disease versus critical disease; and (4) survivors versus non-survivors. Box Tidwell test was performed to analyze data linearity, considering p < 0.05 as significant and linearly independent.
Feature selection
Feature selection was done with GALGO, an object-oriented package developed in R language. GALGO employs genetic algorithms (GA) to select models with high performance, as has been previously described14.
Classification method
RF was a classifier to build the classification models. This popular ML algorithm is a combination of decision trees (DTs); the results are acquired by adding the vote from different DT to decide the final class15. Three hundred generations were tested at each iteration of the GA; 1000 iterations in the models and the characteristics that were repeated were represented in a frequency graph. The trained models (80% of data) were then cross-validated (k = 5), and the results were averaged to obtain the model evaluation metrics. Once the training model was made, it was subjected to a blind validation with the 20% of data, which simulates the performance that will be obtained when testing it with unknown patients for the model.
Validation process
To assess the classification performance of the final models, the following performance metrics were used: area under the receiver operating characteristic curve (AUC), sensitivity, specificity, and accuracy. The experimental design is shown in Figure 1. We analyzed the data with classical statistical methods, such as Principal Component Analysis (PCA) and Partial Least Squares Discriminant Analysis (PLS-DA). Fold change (FC) analysis was also included to evaluate the level of expression of relevant metabolites. Since we defined a priori the study groups, we performed cluster analysis by means of PCA (biplot and loading plots) to verify if the selected metabolites are naturally grouping according to disease severity. By RF, the mean accuracy decrease was also calculated to estimate how much accuracy the model loses by excluding each variable. Finally, ROC curves were built with other classification algorithms, such as PLS-DA, logistic regression (LR), and SVM.

RESULTS
Figure 2 shows the graphics for feature selection when basic and extended models are trained. Table 2 contains the information regarding each model, both for basic data and extended data. The features selected for each model and the performance (AUC, sensitivity, specificity, and accuracy) are shown. We also built AUC curves by means of other algorithms (PLS-DA, LR, and SVM) to verify the performance of the models (Table S1). In addition, the DTs and probabilities are presented in Figure S1.
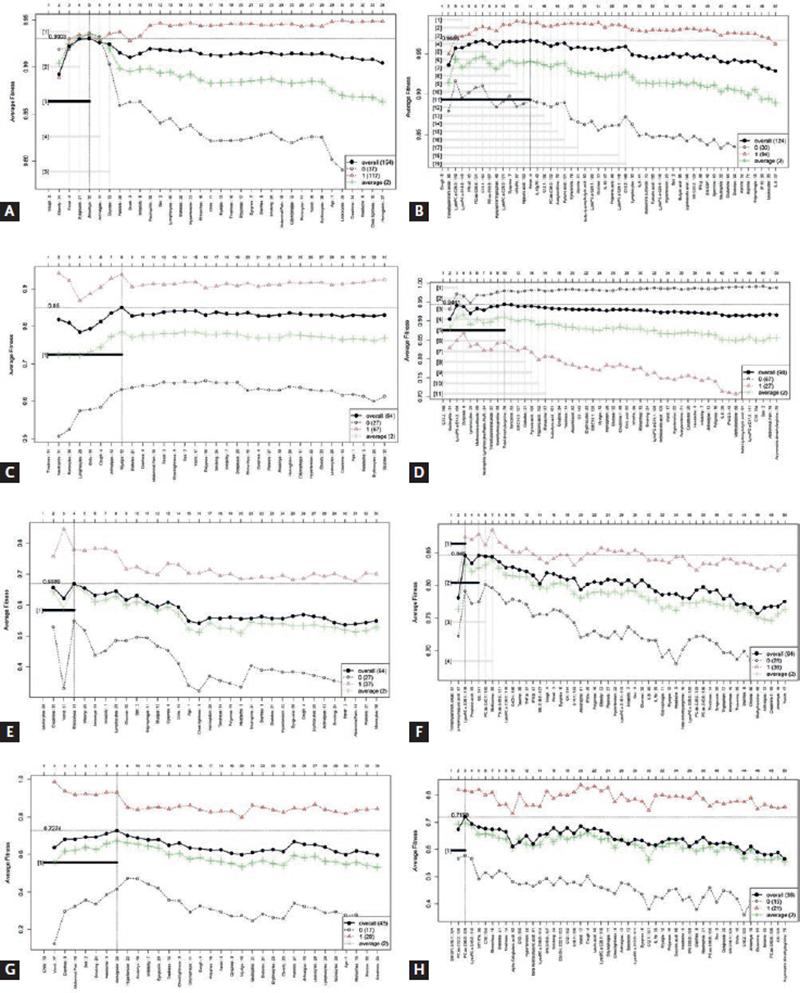
Figure 2. Forward selection models, for each of the stages of COVID-19. (A) COVID-19 versus non-COVID-19 model, basic data. (B) COVID-19 versus non-COVID-19, extended model. (C) Mild versus severe and critical COVID-19, basic data. (D) Mild versus severe and critical COVID-19, extended model. (E) Severe disease versus critical disease, basic data. (F) Severe disease versus critical disease, extended model. (G) Survivors versus non-survivors, basic data. (H) Survivors versus non-survivors, extended model.
Table 2. Feature selection and machine learning models performance in training and testing stages, for each of the COVID-19 groups according to the basic and extended profile
| Basic profile | Extended profile | |||||||||
|---|---|---|---|---|---|---|---|---|---|---|
| Features | AUC (95%CI) | Sensitivity | Specificity | Accuracy | Features | AUC (95%CI) | Sensitivity | Specificity | Accuracy | |
| COVID-19 versus Non-COVID-19 |
Cough | Training | Cough | Training | ||||||
| Obesity | 0.95 (0.82–0.96) |
0.90 | 0.92 | 0.91 | Trimethylamine N-oxide | 1 (1–1) |
0.86 | 0.97 | 1 | |
| Fever | Lyso PC a C 26:0 | |||||||||
| Dysgeusia | Lyso PC a C 18:2 | |||||||||
| Anosmia | Blind Test 0.88 (0.74–1) |
1 | 0.91 | 0.93 | IFN-α2 PC aa C 36:6 C 10:1 |
Blind Test 0.93 (0.81–1) |
1 | 0.95 | 0.96 | |
| Mild COVID-19 versus Severe and Critical COVID-19 |
Tiredness | Training | C 10:2 | Training | ||||||
| Neutrophils | 0.96 (0.88–0.98) |
0.94 | 0.92 | 0.93 | Neutrophils | 0.98 (0.96–1) |
1 | 0.89 | 0.92 | |
| Monocytes | Lyso PC a C 14:0 | |||||||||
| Lymphocytes | Dyspnea | |||||||||
| Chills | Lymphocytes | |||||||||
| Cough | Blind Test | 0.92 | 0.60 | 0.78 | Methionine sulfoxide | Blind Test | 1 | 0.92 | 0.95 | |
| Arthralgia | 0.80 (0.56–0.92) |
Neutrophils lymphocytes Ratio | 0.97 (0.85–1) |
|||||||
| Myalgia | Trimethylamine N-oxide | |||||||||
| Transhydroxyproline | ||||||||||
| Total dimethylarginine | ||||||||||
| Severe
COVID-19 versus Critical COVID-19 |
Training | Training | ||||||||
| Leukocytes | 0.91 (0.73-0.92) |
0.91 | 0.81 | 0.87 | 0.85 (0.94–1) |
0.88 | 0.75 | 0.82 | ||
| Creatinine | Trimethylamine N-oxide | |||||||||
| Vomit | p Hydroxyhippuric acid | |||||||||
| Rhinorrhea | Blind Test | 0.62 | 0.87 | 0.75 | Lyso PC a C 28:1 | Blind Test | 1 | 0.42 | 0.75 | |
| 0.67 (0.41–0.88) |
0.68 (0.47–0.92) |
|||||||||
| Survivors versus Non survivors |
Chills | |||||||||
| Vomit | ||||||||||
| Diarrhea | Training with 100% of data | SM OH C 16:1 | Training with 100% of data | |||||||
| Abdominal pain | 0.68 (0.61–0.76) |
0.50 | 0.86 | 0.73 | PC aa 32:2 | 0.62 (0.52–0.72) |
0.47 | 0.78 | 0.66 | |
| Sex | PC ae C 36:0 | |||||||||
| Smoking | ||||||||||
| Headache | ||||||||||
For the prediction of disease, the basic data as well as extended data had an excellent performance, although in this case, the inclusion of metabolic and immunological variables (trimethylamine N-oxide [TMAO], LysoPC a C26:0, LysoPC a C18:2, PC aa C36:6, C10:1, and IFN-α2) increased the model performance. Cough was a common variable between both models. In addition, to distinguish between non-COVID-19 and all COVID-19 patients, the presence of obesity, fever, dysgeusia, and anosmia was relevant. Data were also analyzed by PLS-DA and variable importance in projection (VIP), which are classical statistical analysis. The models built with both basic and extended profile were cross validated, showing no overfitting. About 71% of the variables from the extended profile selected by GALGO were included also in the PLS-DA model, while only 40% of the variables from basic profiles were coincident in both approaches (Figure S2). FC analysis was also performed (Figure S3 A), and Table S2 shows that all the variables selected by ML and classical statistical methods had significant and similar FC values.
To distinguish between mild disease and severe disease (composed by all the patients who were hospitalized), the basic data as well as extended data had AUC performances above 0.95. Again, the inclusion of metabolic variables increased the performance, both for the trained and blind experiments. From the PLS-DA analysis, the differentiation between both classes is clearly visible, with a cross-validation showing no overfitting of the model. The variables with highest VIP scores (dyspnea, lymphocytes, neutrophils, and neutrophil-lymphocyte ratio [NLR]) were also included in the ML model. In the case of the basic profile, only neutrophils, monocytes, and lymphocytes were detected in common in both models. The performance of cross-validation showed a Q2 below 0.5, which may indicate some overfitting. This agrees with the finding reported for the ML method, where also the performance of the extended profile was higher than for the basic profile (Figure S4). Figure S3 B and Table S3 show the FC analysis for this comparison.
Notably, when severe COVID-19 patients were compared with critically ill COVID-19 patients, the performance of the model was higher when the basic data were considered. In this case, leukocytes and creatinine levels and vomit and rhinorrhea distinguished severe and critical cases with an AUC of 0.91. In contrast, the inclusion of metabolites diminished the performance of the model. In this case, 100% of the variables from the extended profile selected by ML were found in the PLS-DA analysis with a VIP score higher than 1.5. The FC analysis also revealed the highest values for p-hydroxyhippuric acid and TMAO, although lysoPC a 28:1 was also significant (Figure S3 C and Table S4). The cross-validation analysis showed a low performance, which agrees with the superposition of both classes in the PLS-DA model. In the case of the basic profile, only leukocytes were predicted by the PLS-DA method (Figure S5).
Prediction of patients who would survive and those who would not, was only achieved with a discrete success for both types of data. In this stage, the basic data provided a higher performance. Sex, smoking status, and the presence of several symptoms such as chills, vomit, diarrhea, abdominal pain, and headache predicted death among critical patients. None of the extended profile variables selected by ML had a VIP score higher than 1.5 in the PLS-DA analysis. SMOH16:1 and PC ae 36:0 were significant in the FC analysis (Figure S3 D and Table S5). The cross-validation showed a low value in Q2. In the case of the basic profile, only headache and abdominal pain were selected in common by both models; however, the VIP values were below 1.5. The performance of the basic model was higher than that of the extended profile and this agrees with the report by us for the ML approach (Figure S6).
As an additional strategy to verify the implication of the variables selected by different algorithms, unsupervised and hierarchical cluster analyses were performed. This with the main objective of verifying if the natural clustering of samples and analytes effectively corresponded to the assigned classes defined a priori on the experimental design. In the PCA analysis, Group 1 (controls) and Group 2 (mild) were clustered at the bottom, while Group 3 (severe) and Group 4 (critically ill) were clustered at the upper quadrants. From loading plots, variables such as neutrophils, neutrophils/lymphocyte ratio, kynurenine/tryptophan, cough, dyspnea, fever, TMAO, glucose, vomit, leukocytes, lipids (carnitines and lysophospholipids), obesity, and cytokines were in the upper quadrants, while tryptophan, citric acid, lymphocytes, and lysoPCs with smaller and mono-unsaturated fatty acids were clustered at the bottom. In the biplot analysis, patient samples were grouped together with the variables and were also clearly visible how patients such as CV19-0809 (critically ill), CV19-0532 (critically ill), CV19-0932 (critically ill), CV19-0814 (critically ill), CV19-0807 (critically ill), CV19-0519 (critically ill), CV19-0991 (severe), CV19-0484 (severe), CV19-0329 (severe), and CV19-0847 (severe) were clustered with the variables mentioned above in the upper and right side. Contrary, CV19-0583 (mild), CV19-0606 (mild), CV19-0700 (control), and CV19-0578 (control) were grouped at the bottom, together with variables such as lymphocytes and lysoPCs with smaller and mono-unsaturated fatty acids. From the RF analysis, we show here the mean accuracy decrease plot. This plot expresses how much accuracy the model loses by excluding each variable. The more the accuracy suffers, the more important the variable is for the successful classification. The variables are presented in descending importance. In this analysis, lipids, TMAO, and clinical variables such as neutrophils, neutrophil/lymphocytes ratio, and lymphocytes were very important for the model performance (Figure S7).
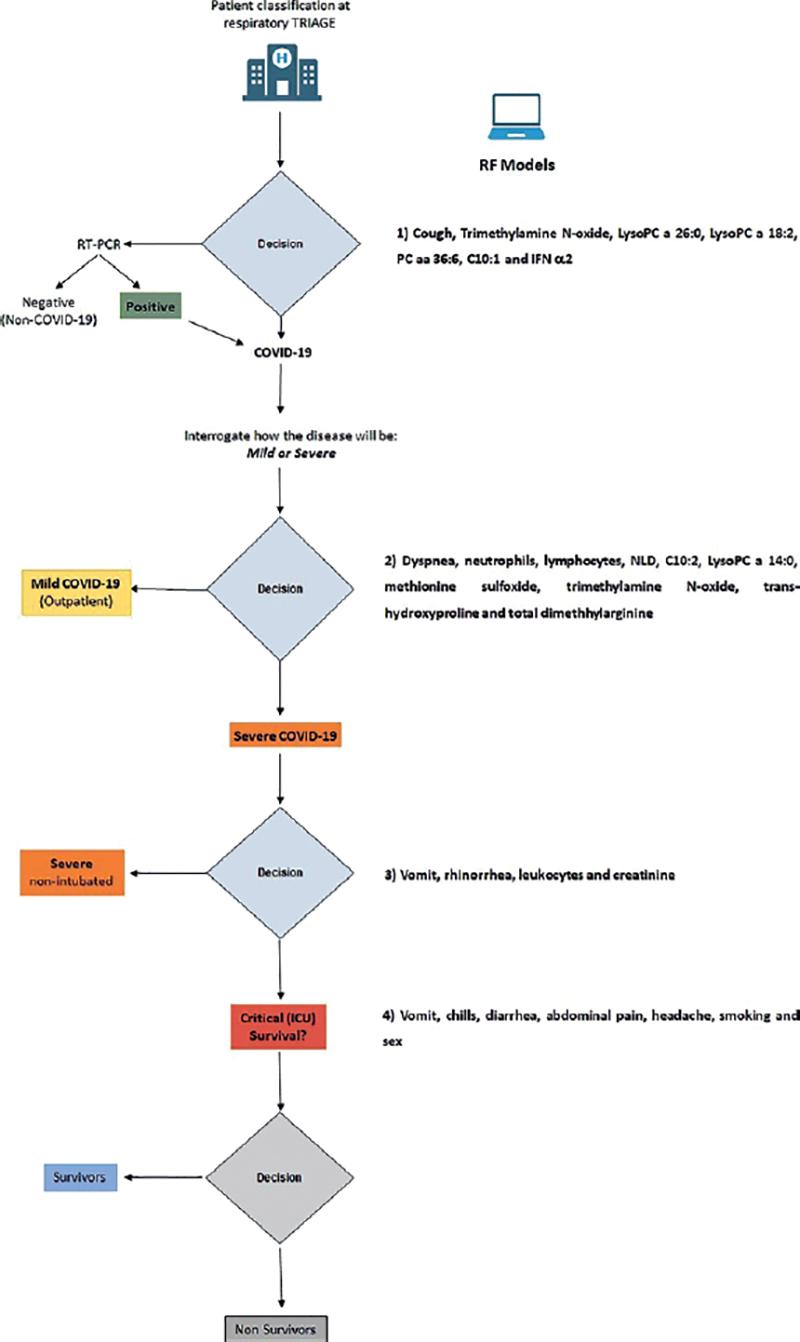
We finally propose an algorithm to classify patients when they arrive in the emergency rooms with suspected COVID-19, as shown in Figure 3. It is worth mentioning that in this algorithm, the extended data were only useful in non-severe forms of the disease. Once the disease has been established, the clinical and demographic data were more adequate to differentiate between severe and critical disease, and to predict death among critical patients.
DISCUSSION
In this study, we proposed a methodology consisting of a selection of features to predict COVID-19 and its outcomes (including death) that were carried out by GALGO, followed by construction of an RF model, which was subsequently cross-validated and blind tested. Besides, these features were inspected across the recent COVID-19 literature, finding that most of them (except creatine) have been reported as potential markers of diagnosis and prognosis (Table S6).
In the present work, metabolites were measured by a targeted method. Targeted metabolomics approaches represent several advantages for selecting specific and probable validated biomarkers. In contrast to untargeted metabolomics approaches, absolute concentration levels of known metabolites are reported, allowing for more reproducibility and validation in intra- and inter-laboratories studies. It is also possible to establish a clear cut-off value for the metabolites selected in a predictive model.
In the previous studies conducted by our group, we presented the feature selection capabilities of the GA GALGO16,17. Typical feature selection approaches can be done mainly in two ways: either by selecting a subset of the original feature set or by extracting a lower number of features preserving the characteristics of the original higher dimensional dataset18. Nevertheless, biological data such as those presented here have many features, making the learning of nonlinear models unfeasible with existing linear techniques18,19. In contrast, nature-driven approaches such as the genetic search look beyond the lineal relation between features and the outcome, testing the capabilities of a subset of features rather than the individual performance. While this may seem trivial, the number of possible feature combinations increases exponentially, making the implementation very hard in a feasible computational time. The implementation of the GA generates a robust multivariate model despite the large number of features.
The previous studies have reported the use of RF, LR, SVM, gradient-boosted DT, and neural network to predict COVID-193,20,21. In a recent work, our group employed LR and SVM to identify differences associated to sex between COVID-19 patients. However, Li et al. demonstrated that RF had highest predictive performance for predicting hospital admissions for COVID-19 patients, and critical care admissions for COVID-19 cases in terms of AUC compared to LR, SVM, neural network, and gradient boosting21. Similarly, Xiong et al. found that RF could predict COVID-19 severity with best performance compared to SVM and LR22.
In this work, we developed two approaches: one directed to select features within the complete dataset (a combination of metabolomics, immunologic, clinical, and demographic data) and the other directed to select those features that are more accessible in hospitals and emergency rooms (clinical and demographic data). We found here that features selected based on metabolomics and immunological data seem to be only useful to predict infection and mild disease. We can speculate that once the disease is established, the metabolic and immune dysregulation that takes place does not allow the differentiation between severe and critical cases. In these stages, the use of clinical features (symptoms and laboratory counts) is the preferred variables to predict negative outcomes.
We previously predicted infection, outcomes,23 and viral sepsis24 with the same dataset analyzed by means of classical statistical methods (unsupervised and supervised techniques, as well as their performance). For the purposes of the present work, we aimed to validate these previous results using ML approaches. ML uses learning algorithms to find patterns in rich and unwieldy data, being particularly helpful when the number of input variables exceeds the number of subjects. ML methods can be also effective even in the presence of complicated non-linear interactions. Other authors have employed ML to validate results by evaluating publicly available datasets. In a recent work, Papoutsoglou et al. employed automated machine learning (AutoML) to analyze three publicly available high-throughput COVID-19 datasets, including proteomic, metabolomic, and transcriptomic measurements. They found critical differences between the original methodology and AutoML, presenting an advantage of the AutoML analysis in terms of translatability of the model25.
In the present work, we found that some of the characteristics previously predicted by us using traditional statistics methods were also selected by ML approaches, particularly those associated with lipid metabolism dysregulation (C10:2, C10:1, LysoPC a C26:0, LysoPC a C 28:1, and PC aa C36:6). However, with this new approach, kynurenine/tryptophan ratio, butyric acid, propionic acid, or phenylalanine were not identified as relevant variables. Instead, a new variable, TMAO, was found in the predictive models for infection, mild disease, and severe disease.
TMAO has been associated with cardiovascular disorders such as atherosclerosis. The atherogenic effect of this compound is associated with alterations in cholesterol and bile acid metabolism, activation of inflammatory pathways, and promotion of foam cell formation; a positive correlation has also been found between elevated plasma levels of TMAO and an increased risk of major adverse cardiovascular events and death26,27. High levels of TMAO have been associated with the presence of diabetes28. Elevation of this compound is also associated with a decrease in renal function and renal failure, and at the same time, it has been associated with higher mortality in renal failure29. Importantly, it has been demonstrated that TMAO induces inflammation and endothelial dysfunction through activating ROS-TXNIP-NLRP3 inflammasome, suggesting a likely mechanism for TMAO-dependent enhancement in atherosclerosis and cardiovascular risks30.
Cardiovascular stroke and renal failure are common complications of severe COVID-19 patients. Other important variables, such as NLR, neutrophils, and lymphocytes, have also been selected by us and others. Yang et al.31, highlighted the importance of NLR as a predictor of severity in COVID-19, and Tan et al. identified lymphocytes as a marker of severity32. In fact, assessment of the NLR gives information about lasting inflammation and regulatory functions by neutrophils and lymphocytes, respectively, being an indicator of the overall inflammatory status of the body.
Interestingly, ML detects TMAO, lipid mediators, and NLR as important variables after several rounds of testing and validation procedures, indicating that these features gain importance in the sample evaluated. These markers are individually associated to a general inflammation profile, not only specific to COVID-19; however, when combined, allow to perfectly describe some of the processes altered in COVID-19: intestinal dysbiosis, oxidative stress, tissue hypoxia, and mitochondrial dysfunction.
The new strategy, based on AI algorithms and feature selection driven by GALGO, was successful in identifying potential COVID-19 biomarkers to predict different outcomes. The strategy also revealed the usefulness of complex data (such as those composed by metabolomics, immunologic, and clinical features) for non-severe forms of the disease, while for the worst scenarios, the use of simpler data (clinical and demographic features) is preferable. This allowed the establishment of a workflow for patient stratification on hospital admission.
Differences in the selection of variables by the methods here employed can be attributable to the characteristics of each model. When the Box-Tidwell test was performed, only 60 variables had linearity with respect to a binary outcome. This means that the data presented here are complex and they are not linear. Therefore, ML algorithms are more adequate to analyze them. GALGO, by means of ranking stability, selects those variables that remain relevant after several cycles of testing. However, despite the differences in individual metabolites, classes and subclasses were similar both for ML or classical statistics approaches. Moreover, when the fold change was calculated for each variable selected by GALGO and PLS-DA, there were only minimal differences in the obtained values, which indicate that independently of the model selected, the behavior of the variable is the same.
We recognize several limitations in our study. The sample size was limited, due to restrictions during the first epidemic wave. Traditional approaches for sample size estimation are not easily transferable to metabolic phenotyping studies, where it is not possible to know in advance what resulting variables will be obtained. It is often not known which, and how many, metabolite candidates will be of potential interest; therefore, estimation of the effect size will likely be inaccurate. To account for this limitation, we are proposing one model based on a GA (GALGO) that offers several advantages (in terms of visualization and performance), and it has been validated with classical statistical methods, as has been demonstrated here. Our work also has strengths. Here, we performed a validation with classical statistical approaches as well as an updated review of the involvement of the selected metabolites in COVID-19 diagnosis or prognosis. These approaches control for potential model overfitting and retain the biological relevance of the data to explain molecular alterations associated to COVID-19.

