


 text new page (beta)
 English (pdf)
 Article in xml format
 Article references
 Send this article by e-mail
 Cited by SciELO
  Similars in
SciELO
Similars in
SciELO 
 Permalink
Cardiovascular disease includes myocardial infarction, cerebrovascular disease, and heart failure; they are the leading causes of death in patients with diabetes and result from prior metabolic abnormalities such as insulin resistance and prediabetes1, among other factors. Insulin resistance plays a key role in the pathogenesis of the metabolic syndrome and cardiovascular disease2. Different methods using fasting glucose and insulin concentrations or after a glucose load have been used to estimate insulin resistance3,4, including homeostasis model assessment for insulin resistance (HOMA-IR)5, HOMA26, frequently sampled intravenous glucose tolerance test7, metabolic score for insulin resistance (METS-IR)8, the Matsuda index9, and the disposition index10. Most of these surrogates use fasting or the average glucose concentration at different time points and do not consider the patterns of glucose and insulin after a glucose load. Some individuals with predominant hepatic insulin resistance have fasting hyperinsulinemia and hyperglycemia, while others have a predominant alteration in peripheral insulin sensitivity and hence, glucose intolerance11. Hepatic and peripheral insulin sensitivity can be affected differently, and distinct patterns in glucose and insulin responses after a 2-h oral glucose tolerance test (OGTT) have been identified12. Hulman et al. developed a latent class analysis approach to identify OGTT clusters. With this method, heterogeneous patterns were identified and could have not been detected based only on the fasting or 2-h concentrations13.
We usually perform a 5-h OGTT in study subjects with obesity or with symptoms of postprandial hypoglycemia in the metabolic research ward of our health center. However, to the best of our knowledge, no study has previously characterized the insulin and glucose patterns after this test. This study was designed to identify distinctly different glucose and insulin patterns after a 5-h OGTT and to determine their association with cardiometabolic risk factors, beta-cell function, and insulin sensitivity in individuals without diabetes.
METHODS
Study design and participants
This is a cross-sectional and comparative study based on a 5-h OGTT, conducted between January 2013 and April 2020, in individuals without diabetes, and above the age of 18 years, at a tertiary care university medical center in Mexico City. The test was performed if there were symptoms of postprandial hypoglycemia, suspicion of dysinsulinism, and hyperinsulinism. An OGTT was also obtained in individuals with endocrinopathies associated with glucose metabolism abnormalities (cushing, non-controlled hypothyroidism or hyperthyroidism, acromegaly, etc.). Patients on glucocorticosteroids, oral anti-diabetics, insulin, or other drugs that could alter insulin sensitivity (thiazides and chemotherapy) were excluded from the study.
Procedures and measurements
A 75-g OGTT was performed, and glucose and insulin determinations were obtained at 0, 30, 60, 90, 120, 180, 240, and 300 min in patients who fulfilled the selection criteria. The variables collected from clinical records included age, sex, weight, height, hypertension diagnosis, smoking habit, and lipid profile. Surrogates of insulin sensitivity including HOMA-IR, HOMA2-IR, HOMA2-S, METS-IR, and Matsuda index were estimated. To assess beta-cell function, HOMA2-B and the disposition index were also calculated.
This study was approved by the Research Ethics Committee of the National Institute of Medical Sciences and Nutrition Salvador Zubirán, registered as number UIE-3242-19-21-1, and informed consent was waived due to its observational design.
Statistical analysis
The distribution of dimensional variables was evaluated with the Kolmogorov–Smirnov test and is reported as means and standard deviation or medians and interquartile ranges, as appropriate. Categorical variables are reported as frequencies and percentages. We performed latent class analysis of the patterns observed during the 5-h OGTT. A five-order polynomial model was adjusted with random effects for repeated measurements. The number of latent classes was determined by the minimization of the Akaike information criterion, the Bayesian Information Criterion (BIC), and the sample-size adjusted BIC. A full description of the latent classes analysis is provided in table S1. To evaluate differences in cardiometabolic risk factors in each latent class, we used the Chi-square test for categorical variables, and the ANOVA or Kruskal–Wallis tests for dimensional variables. The Dunn test correction for multiple comparisons was applied. To predict the risk of harboring cardiometabolic risk factors in each latent class, a multinomial analysis for ordinal outcomes was performed. Analyses were obtained with the R software and SPSS Version 25. p < 0.05 was considered statistically significant.
RESULTS
Study subjects
We reviewed 2226 records with a 5-h OGTT, of which 1138 were excluded and 1088 were analyzed; the main reason for exclusion was treatment with medications modifying glucose metabolism (Fig. S1). In the final group, 841 (77.3%) were women with a median age of 47 (IQR 37-57.7), 896 (82.3%) did not exercise, 228 (20.9%) reported smoking, and 318 (29.2%) had a hypertension diagnosis. The median body mass index (BMI) was 30.5 kg/m2 (26.2-37.5). Total cholesterol concentration was 182 mg/dL (159-209), low-density lipoprotein (LDL) cholesterol 115 mg/dL (94-138), high-density lipoprotein (HDL) cholesterol 45 mg/dL (38-54), non-HDL cholesterol 134 mg/dL (113-161), and triglycerides 135 mg/dL (100-181). Moderate hypertriglyceridemia (150-500 mg/dL) was identified in 439 (40.3%) cases. Symptoms of postprandial hypoglycemia were recorded in 131 (12%) charts (Table 1). A full description of the diagnoses in these individuals is presented in table S2, and the most frequent was obesity. According to the mixed model, the optimal number of latent classes was four; 464 patients were categorized in Class 1, 312 in Class 2, 170 in Class 3, and 142 in Class 4.
Table 1. Demographic and clinical characteristics of the different latent classes (n = 1088)
| Variables | Total (n = 1088) | Class 1 (n = 464) | Class 2 (n = 312) | Class 3 (n = 170) | Class 4 (n = 142) | p |
|---|---|---|---|---|---|---|
| Age (years) | 47.0 (37.0-57.7) | 42.0 (34.0-54.0) | 48.3 ± 13.6* | 51.5 ± 14.4* | 52.8 ± 11.8*‡ | < 0.001 |
| Men (n, %) | 247 (22.7) | 94 (20.2) | 64 (20.5) | 47 (27.6) | 42 (29.5) | 0.035 |
| Women (n, %) | 841 (77.2) | 370 (79.7) | 248 (79.4) | 123 (72.3) | 100 (70.4) | |
| Sedentary (n, %) | 896 (82.3) | 387 (83.4) | 253 (81.0) | 141 (82.9) | 115 (80.9) | 0.821 |
| Smoking (n, %) | 228 (20.96) | 105 (22.6) | 58 (18.5) | 37 (21.7) | 28 (19.7) | 0.565 |
| Hypertension (n, %) | 318 (29.23) | 100 (21.5) | 98 (31.4) | 59 (34.7) | 61 (42.9) | < 0.001 |
| BMI (kg/m2) | 30.4 (26.2-37.5) | 29.3 (25.0-35.8) | 31.6 (27.2-39.9)* | 30.5 (25.4-38.0) | 32.4 (28.3-40.0)* | < 0.001 |
| Total cholesterol (mg/dL) | 182.0 (159.0-209.0) | 180.0 (158.0-207.7) | 187.0 (165.0-213.0) | 178.5 (156.0-209.5) | 183.4 ± 33.7 | 0.094 |
| c-LDL (mg/dL) | 115 (94-138) | 112 (93.0-137.0) | 117.0 (95.0-141.7) | 112.0 (96.0-136.2) | 114.2 ± 32.7 | 0.358 |
| c-HDL (mg/dL) | 45 (38-54) | 46.5 (39-56.7)§ | 44.0 (38.0-53.0) | 44.5 (38.0-53.2) | 42.0 (35.7-50.2) | < 0.001 |
| Non-HDL cholesterol (mg/dL) | 134 (113-161) | 132 (110-158) | 139 (117-166)* | 132 (111.7-164.2) | 135 (116.7-161) | 0.010 |
| Triglycerides (mg/dL) | 135 (100-181) | 123 (92-164) | 148 (110.2-198)* | 133 (98-181.5) | 148 (113-212)* | < 0.001 |
| Hypercholesterolemia (n, %) | 350 (32.2) | 150 (32.3) | 105 (33.6) | 53 (31.2) | 42 (29.6) | < 0.001 |
| Hypertriglyceridemia (n, %) | 439 (40.3) | 152 (32.7) | 151 (48.4) | 68 (40.0) | 68 (47.9) | < 0.001 |
| Mixed dyslipidemia (n, %) | 200 (18.4) | 72 (15.5) | 67 (21.5) | 33 (19.4) | 28 (19.7) | < 0.001 |
| Impaired fasting glucose (n, %) | 191 (17.6 %) | 2 (0.43) | 84 (26.9) | 1 (0.59) | 103 (72.5) | < 0.001 |
| Glucose intolerance (n, %) | 195 (17.9 %) | 2 (0.4) | 88 (28.2) | 1 (0.59) | 104 (73.2) | < 0.001 |
Data are expressed as means ± standard deviation, median (interquartile range) or number (percentage). The p-value was obtained according to Kruskal–Wallis or Chi-square tests. *Significant versus Class 1.
†Significant versus Class 2.
‡Significant versus Class 3.
§Significant versus Class 4 after adjustment with the Dunn test.
Glucose and insulin patterns during 5-h OGTT
In Class 1, the glucose concentration increased, reaching a peak below 140 mg/dL at 30 min, followed by a progressive decrease to the baseline concentration. Class 2 showed a higher glucose peak at 60 min, with a mean glucose of 155 mg/dL, followed by a delayed decrease beginning after 3 h. Class 3 showed an acute glucose peak at 30 min, reaching a mean glucose of 170 mg/dL, with a decrease leading to hypoglycemia – approximately 65 mg/dL – at 3 h. Finally, Class 4 showed a glucose peak of 211 mg/dL at 60 min, and a delayed decrease with a mean glucose of 68 mg/dL at 4 h. Glucose patterns and concentrations in the different classes are shown in figure 1A.
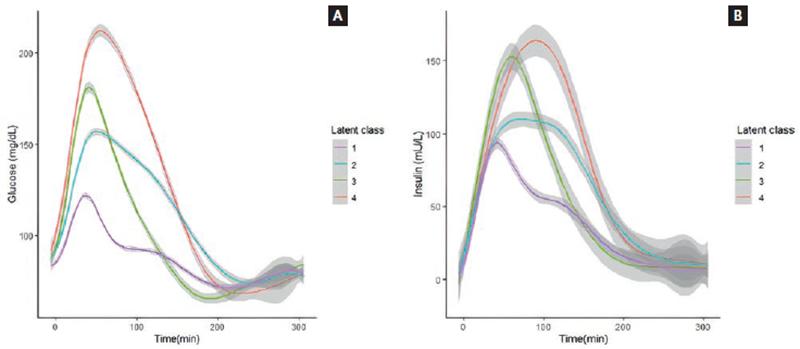
Figure 1. (A) Glucose concentrations during the 5-h oral glucose tolerance test (OGTT) in each latent class. (B) insulin concentrations during the 5-h OGTT in each latent class.
In Class 1, the baseline insulin concentration was 10.1 µI/mL, with a peak of 84.4 µI/mL at 30 min, followed by a progressive decrease, and reaching baseline concentrations (9.0 µI/mL) at 4 h. Class 2 shows an insulin peak at 60 min, reaching 108 µI/mL, and a delayed decrease beginning at 3 h and decreasing below the baseline concentrations by the end of the OGTT. Class 3 showed an insulin peak of 155 µI/mL at 60 min, with a decrease beginning at 2 h, and reaching insulin baseline concentrations at 4 h. Class 4 peaked at 90 min at 162 µI/mL, remained elevated for 3 h, and reached baseline concentrations at 5 h. Insulin patterns and concentrations are shown in figure 1B. The mean and standard deviation of glucose and insulin concentrations at each time point during the 5-h OGTT in each latent class are shown in table S3.
Cardiometabolic risk factors
Age progressively increased across the 1 to 4 classes. Individuals in Class 1 were 43.8 ± 12.9 years old, 48.3 ± 13.6 in Class 2, 51.5 ± 14.4 in Class 3, and 52.8 ± 11.8 in Class 4 (p < 0.001). The proportion of men also progressively increased in the different classes (p = 0.035). Sedentary behavior and tobacco use were similar between classes (p = 0.821 and p = 0.565, respectively). The proportion of cases with a hypertension diagnosis also increased progressively among classes: 21.5% in Class 1, 31.4% in Class 2, 34.7% in Class 3, and 42.9% in Class 4 (p < 0.001). Individuals in Class 1 had the lowest median BMI, 29.3 (IQR 25-35.8) kg/m2, and individuals in Class 4 had the highest (32.4 [IQR 28.3-40] kg/m2) (p < 0.001). Total cholesterol and LDL cholesterol did not differ between classes (p = 0.09 and p = 0.358, respectively), while HDL cholesterol decreased progressively, 46.5 (39-56.7) mg/dL in Class 1, 44.0 (38-53) mg/dL in Class 2, 44.5 (38-53.2) mg/dL in Class 3, and 42.0 (35.7-50.2) mg/dL in Class 4 (p < 0.001). The lowest non-HDL cholesterol was detected in Class 1, 132 (110-158) mg/dL, and the highest in Class 2, 139 (117-166) mg/dL (p = 0.010). The lowest triglyceride concentration was also found in Class 1, 123 (92-164) mg/dL, while Classes 2 and 4 had the highest concentrations, 148 (110.2-198) mg/dL and 148 (113-212) mg/dL, respectively (p < 0.001). The most prevalent dyslipidemia phenotype was moderate hypertriglyceridemia in Classes 2 and 4, which found in 151 (48.4%) and 68 (47.9%) cases, respectively (p < 0.001) (Table 1).
Insulin sensitivity and beta-cell function
Insulin resistance was highest in Class 4, followed by Classes 2 and 3, while the highest insulin sensitivity was found in Class 1. Individuals in Class 4 showed a median METS-IR above the 50 cutoff point8, indicating insulin resistance. Similarly, considering a cutoff of 2.5 for both the Matsuda and DeFronzo9 and HOMA-IR indexes5, the median values in the individuals in Class 4 indicated insulin resistance. As to beta-cell function, the median disposition and insulinogenic indexes were normal (> 1 and 0.4, respectively) in all the classes, but they progressively decreased across the classes. The HOMA2-B was also in a normal range in different classes. The evaluation of insulin sensitivity and beta-cell function in latent classes using different surrogate indexes is shown in table 2.
Table 2. Insulin resistance and beta-cell function surrogates in each latent class
| Variables | Class 1 | Class 2 | Class 3 | Class 4 | p |
|---|---|---|---|---|---|
| METS-IR | 43.2 (35.6-54.6) | 49.3 (40.3-61-5)* | 49.3 (38.2-60.1)* | 52.9 (44.1-64)*‡ | < 0.001 |
| Matsuda index | 5.4 (3.3-7.8)†‡§ | 3.1 (2.1-4.6)§ | 3.1 (1.9-4.5)§ | 2.2 (1.4-3.1) | < 0.001 |
| HOMA-IR | 1.6 (1.0-2.6) | 2.4 (1.5-3.7)* | 2.2 (1.3-3.6)* | 3.2 (1.9-4.7)*†‡ | < 0.001 |
| HOMA2-IR | 0.85 (0.55-1.3) | 1.2 (0.79-1.8)* | 1.1 (0.66-1.7)* | 1.4 (0.94-2.1)*‡ | < 0.001 |
| HOMA2-S | 117 (74.4-179-9)†‡§ | 79.1 (54.4-126.1) | 88.6 (57.4-150.3)§ | 66.9 (46.8-106.2) | < 0.001 |
| Insulinogenic index | 1.7 (0.95-2.9)†‡§ | 1.18 (0.75-1.8)§ | 1.0 (0.60-1.7)§ | 0.73 (0.45-1.1) | < 0.001 |
| Disposition index | 8.5 (5.6-13.3)†‡§ | 3.6 (2.5-4.9)§ | 3.0 (2.1-4.3)§ | 1.6 (1.1-2.1) | < 0.001 |
| HOMA2-B | 97.9 (72.4-130.3) | 107.6 (80.4-147.2)*‡ | 95.5 (73.5-128.7) | 101.1 (78.4-129.5) | 0.020 |
Data are expressed as the median (interquartile range). ap-value obtained with the Kruskal–Wallis test.
*Significant versus Class 1.
†Significant versus Class 2.
‡Significant versus Class 3.
§Significant versus Class 4, after adjustment with the Dunn test.
Variables associated with the different classes
We developed multinomial logistic regression models to assess the cardiometabolic risk factors associated with each latent class. Class 1 was considered the reference category due to its less deleterious cardiometabolic profile. Individuals in Class 4 were older. Every kg/m2 of BMI was associated with a 2.7-fold risk of belonging to Class 2, a 1.8-fold risk of being in Class 3, and a 3.4-fold risk of fitting in Class 4. A hypertension diagnosis was not associated with any of the classes. A high HDL cholesterol was associated with a lower risk of being in Class 4. Finally, every mg/dL increase in the triglyceride concentration was associated with a 2.3-fold increased risk of belonging to Class 2, a 1.3-fold increased risk for Class 3, and a 2.4-fold risk for Class 4 (Table 3).
Table 3. Multinomial regression analysis showing risk for the presence of cardiometabolic risk factors in each latent class
| Classes | 1 (n = 464) | 2 (n = 312) | p | 3 (n = 170) | p | 4 (n = 142) | p |
|---|---|---|---|---|---|---|---|
| Age | 1 | 1.026 (1.014-1.038) | < 0.001 | 1.045 (1.030-1.060) | < 0.001 | 1.057 (1.04-1.075) | < 0.001 |
| Male sex | 1 | 0.856 (0.583-1.257) | 0.428 | 1.327 (0.856-2.057) | 0.206 | 1.245 (0.777-1.995) | 0.363 |
| BMI | 1 | 2.710 (1.451-5.062) | 0.002 | 1.781 (0.825-3.841) | 0.141 | 3.406 (1.492-7.776) | 0.004 |
| Hypertension | 1 | 1.165 (0.815-1.664) | 0.402 | 1.223 (0.802-1.865) | 0.350 | 1.487 (0.957-2.311) | 0.078 |
| HDL-c | 1 | 0.875 (0.459-1.664) | 0.685 | 0.553 (0.251-1.217) | 0.141 | 0.357 (0.148-0.861) | 0.022 |
| Triglycerides | 1 | 2.262 (1.604-3.190) | < 0.001 | 1.360 (0.896-2.065) | 0.149 | 2.441 (1.557-3.829) | < 0.001 |
Reference category is latent Class 1. Data are presented as OR (95% CI) calculated using a multinomial regression model. R2 = 14.8%, Chi-square < 0.001.
DISCUSSION
This study shows an innovative approach to analyze glucose and insulin responses during a 5-OGTT and has led to the identification of four different classes; it also demonstrates an association of these classes with cardiometabolic risk factors, insulin resistance, and beta-cell function, parameters characteristically associated with diabetes development.
Consistent with the findings in a study by Hulman et al.13, the individuals in different classes differed in age, BMI, lipid concentrations, hypertension diagnosis, insulin sensitivity, and insulin response. The best cardiometabolic profile, insulin sensitivity, and beta-cell function were found in Class 1, while Class 4 reflected cases with the worst cardiometabolic risk and included older individuals, a male preponderance, a hypertension diagnosis, a higher triglyceride concentration, obesity, lower HDL cholesterol, abnormal fasting glucose, glucose intolerance, postprandial hypoglycemia (after 4 h), and insulin resistance. Class 3 showed a less harmful lipid profile, lower insulin resistance, and less obesity. This class developed postprandial hypoglycemia (after 3 h). Class 2 had lower insulin resistance, but a deleterious lipid profile characterized by higher triglycerides and non-HDL cholesterol concentrations, as well as high fasting glucose levels, glucose intolerance, and more individuals with obesity. Individuals in Classes 3 and 4 were characterized by the highest insulin peak, and Classes 2 and 4 developed a plateau in insulin concentration during the OGTT. These findings suggest that the glucose and insulin patterns in the 5-h OGTT identified by the latent classes analysis can discriminate subjects with different cardiometabolic risk profiles.
The model of 5-h latent classes provides more information in comparison with the analysis of 2-h OGTT, including the identification of postprandial hypoglycemia secondary to high and persistent insulin secretion.
A previous cohort analysis found that individuals with normal glucose tolerance who had a high glucose peak (> 161.2 mg/dL) at 1-h OGTT had a risk profile similar to participants with glucose intolerance14, suggesting that the highest glucose peak indicates an abnormal metabolic state. In another study, individuals with a high glucose concentration at any time during an OGTT are at greater risk of developing diabetes and increased all-cause mortality, when adjusted by age, sex, smoking status, and other cardiometabolic risk factors12.
The fasting and the 2-h glucose concentration during the OGTT have been traditionally considered to define the presence of glucose metabolism abnormalities. However, these cutoff points do not take into account the different patterns that can be observed during the test. The differences in cardiometabolic risk factors and insulin resistance in the different classes provide information that cannot be identified with the fasting or the 2-h glucose concentrations independently. In this study, the fasting glucose concentration alone does not distinguish between Classes 1 and 2; the 1-h concentration cannot differentiate between Classes 3 and 4, and the 2-h concentration does not discriminate between Classes 2 and 3. We observed postprandial (after 2 h) hypoglycemia frequently, due to high and sustained insulin peaks, known as dysinsulinism. It is possible that this finding might represent an early manifestation of insulin resistance15-17.
The 5-h OGTT identified subjects with late hypoglycemia, with greater peripheral resistance to insulin, and subjects with sustained insulin levels that are not evident in the 2-h OGTT. Although subjects in clusters 2, 3, and 4 exhibited fasting and 2-h glucose concentrations, they harbor a more deleterious cardiometabolic risk profile. The early observed hyperinsulinemia without associated symptoms of hypoglycemia could be due to insulin resistance and a normal pancreatic reserve. However, when insulin resistance worsens, some individuals could develop symptomatic hypoglycemia. In other cases, no hyperinsulinemia was evident, but a sustained insulin concentration during the test was observed and associated with a late decrease; this feature is also associated with insulin resistance (dysinsulinism)16,17. Therefore, performing a 5-h OGTT would be beneficial in selected patients for preventive purposes and early lifestyle interventions and/or drug initiation.
Although in this study, we did not investigate the physiopatogenic mechanisms subserving insulin resistance in each of the clusters, some mechanisms have previously been described. These include an increase in inflammatory factors such as tumor necrosis factor-alpha18 and other cytokines (resistin and leptin)19,20 that diminish peripheral insulin activity by decreasing insulin receptor substrate 1 and 2 and phosphatidylinositol-3 kinase (PI3K) activation, with a further decrease in glucose transporter-4 expression21. This leads to decreased glucose transport in skeletal muscle22 and adipose tissue23. Cytokines are regulated by peroxisome proliferator-activated receptor gamma (PPAR-γ) which is abundant in adipose tissue, muscle, and liver24. Abnormalities in the synthesis and/or metabolism of PPAR ligands have been also described in the context of insulin resistance24,25. These increase beta-cell activity which is manifested as hyperinsulinemia and in some cases, as hypoglycemia after a glucose load26.
An increase in proinflammatory cytokines has been also associated with decreased lipoprotein lipase activity27, leading to high circulating free fatty acids which, in turn, further contribute to peripheral insulin resistance and compensatory hyperinsulinemia, as well as to an increase in VLDL-particle hepatic production28. Recently, novel molecules, including glycoprotein leucine-rich alpha-2 glycoprotein 1, have been found to play a fundamental role in the pathogenesis of insulin resistance by promoting lipid accumulation, suppressing fatty acid catabolism, and inducing lipid biosynthesis through the activation of the sterol regulatory element-binding protein 1 transcription factor, and inducing hyperglycemia by down-regulating the expression of ISR1 and ISR229.
Hepatic insulin resistance can be present in fasting conditions and during the first minutes of an OGTT30. However, individuals with peripheral insulin resistance are characterized by hyperinsulinemia 30 min into the test31. A different scenario is observed in cases with diminished beta-cell function, which is reflected as a lower insulin response and higher glucose levels, suggesting low pancreatic reserves, and not observed in the individuals evaluated in this study; this was expected, since individuals who fulfilled diabetes criteria were excluded from the study (Table 2).
Some limitations of this study should be recognized. Initially and due to its retrospective design, it is possible that information on smoking and exercise habits was not fully reported in the clinical records. Second, we had no information on the individuals’ alcohol consumption, their cardiovascular disease, and diabetes family history, nor on the incidence of cardiovascular disease. Future prospective studies will address these objectives. This study was conducted in a tertiary care center and the reasons for performing the OGTT were diverse, but they were equally distributed among groups. In addition, we excluded individuals who had diseases or medications that could alter glucose and insulin responses during the test. Last, euglycemic hyperinsulinemic clamps were not performed, although they are considered the gold standard method to evaluate insulin sensitivity; however, the surrogate indices that we evaluated have been validated against the clamp. The number of OGTT included was sufficient to identify the different classes and to detect consistent differences between them.
The Hispanic population is at a greater risk of developing metabolic diseases such as diabetes, obesity, dyslipidemia, and their complications in comparison with other ethnic groups32. Although the 5-h OGTT may not be necessary for diabetes diagnostic purposes, it may be of relevance in particular populations. The current research based on the 5-h OGTT is part of the efforts to understand and clarify further pathophysiological changes that will be explored in future projects. The early detection of glucose and insulin abnormalities in a 5-h OGTT in conjunction with cardiometabolic risk factors could allow, in some specific cases, the timely initiation of treatment and diabetes and cardiovascular disease preventive measures.
SUPPLEMENTARY DATA
Supplementary data are available at Revista de Investigación Clínica online (doi: 10.24875/RIC.22000039). These data are provided by the corresponding author and published online for the benefit of the reader. The contents of supplementary data are the sole responsibility of the authors.

