


 nueva página del texto (beta)
 Inglés (pdf)
 Artículo en XML
 Referencias del artículo
 Enviar artículo por email
 Citado por SciELO
  Similares en
SciELO
Similares en
SciELO 
 Permalink
INTRODUCTION
Since the start of the COVID-19 pandemic, massive testing has been a staple of epidemic control worldwide to detect cases, initiate contact tracing, and quarantine individuals who were exposed1. Real-time reverse-transcriptase polymerase chain reaction (RT-PCR) was the first available test and remains widely utilized2,3. Being the only test available at the beginning of the pandemic, it was used both for epidemiological surveillance and individual diagnosis3,4. It has an almost perfect specificity but suboptimal sensitivity, making false-negative results a relevant problem in high prevalence areas, as it becomes easy to underestimate the number of cases and misinterpret a negative result4-6.
An important issue is the timing of the tests. If an RT-PCR test is performed late during the natural history of the infection, it could be futile for means of epidemiological surveillance4,6,7. A person that is tested on the 5th day of symptoms but obtained the result 5 days later has remained without a diagnosis for 10 symptomatic days, which could impact the person's possibility (if the job required a positive test to justify absence) or willingness to isolate3,4. If the person tested positive on the 20th day from symptom onset, he or she has ceased to be contagious, and the test would only help to determine if they were infected, and even then, the sensitivity would be suboptimal for that purpose and an antibody assay could be more useful3,6. Conversely, a positive test in a person who is on their 5th day of symptoms would allow for relatively early isolation and contact tracing. Thus, delay in test results has a negative impact both on epidemiological surveillance and individual diagnosis. Particularly in Latin America, a higher incidence and worse outcomes have been described in people of lower socioeconomic status8. Nonetheless, diagnostic delay has not been evaluated in relation to this variable. Using open data, we describe the length of delay in SARS-CoV-2 RT-PCR testing after symptom initiation and obtention of test results, and determine its association with the person's socioeconomic status according to country-specific scores.
METHODS
General study design
We performed a retrospective analysis on open datasets from Mexico and Colombia to evaluate time from symptom onset until testing and time from testing until result availability9,10. Mexico and Colombia were selected due to them being the only countries, from 104 reviewed, with the necessary open data at the individual level. This is further described in the Supplementary Material.
Open data included different information for each country. Only confirmed cases were available for Colombia, while all tested persons were available for Mexico. People were registered in the Colombian database starting on March 2, 2020, although the study period had to be limited to July 27 because antigen tests began to be reported starting on July 28 with no distinction between cases positive by RT-PCR or by antigen tests. Mexico's database does not provide a testing nor a diagnosis date. Testing date was assumed to be that in which an individual first appeared in a database.
Colombia had a total of 327,366 reported positive individuals from April 1 to August 9, which were the date with the result of the last RT-PCR done when only this method was used. Afterward, both RT-PCR and antigen tests were done, with no distinction between them in the open data. In Mexico, there were 3,363,456 individuals tested by RT-PCR from April 12, 2020, through January 31, 2021. Of them, 3,214,281 had an available result by February 10, and 151,671 had no available result after 10 days from the testing date.
Definitions
We were interested in exploring delays at two steps of the diagnostic process: delays in seeking care by individuals and delays in the health system in reporting diagnostic test results (test turnaround time). Thus, we generated variables to analyze these as outcomes. Diagnosis date in Mexico was established searching daily databases for the date in which a result was first reported for any given individual. Colombia did report the date of diagnosis. We defined delay-one as the time in days between the date of symptom onset and the date of testing. We assumed that this period was mainly determined by an individual's characteristics. Delay-two was defined as the time in days between the date of sample collection and the date of the test result report (turnaround time), and we assumed that this period was determined by factors related to the health systems. We defined total delay as the total time between the date of symptom onset and date of the test results.
We classified individuals as early testers if they were tested for COVID-19 within the first 3 days of symptom onset; late testers if tested between the 4th and 8th day of symptom onset; and very late testers if tested after the 8th day of symptom onset. We also classified test turnaround time as efficient if the RT-PCR result was available within 2 days of sampling, and inefficient if it took longer. We did not find definitions of what “acceptable delays” are. Thus, we classified total delay based on when results became available in relation to the infectious period of an individual. Total delay was classified as optimal if it was shorter than 5 days (within the first half of the infectious period of an individual); regular, if it was between 6 and 10 days long (within the second half of the infectious period of an individual); alternatively, inadequate, if it was more than 10 days (after an individual is no longer infectious).
A systematic review and meta-analysis reported that virus transmissibility begins 2 days before symptom's onset up to 9 days after11. Thus, we used this time interval (extending until 10 days after symptom onset for practicality) to define patients as “infectious.” Hereafter, “antigen test” and “point-of-care test” (POC test) will be used interchangeably.
Statistical analysis
We used medians, interquantile ranges, and rolling means to describe the length of delay-one, delay-two, and total delay during the study period, and proportions to describe the frequency of early, late, and very late testers (delay-one); efficient and inefficient test results reporting (delay-two), and optimal, regular, or inadequate total delay. We calculated the time that would be saved with POC tests, which would eliminate delay-two, dividing the total amount of delay-two by the number of tested patients. We stratified the analysis by marginalization status, which was calculated differently for Colombia and Mexico. For Colombia, we included the “Multidimensional Poverty Index” (MPI), which is calculated yearly using a national representative household census12-14. It evaluates five key aspects: education, childhood and youth, health, work, and living place13,14. A score of 0 (no deprivation) and 1 (deprivation) is then calculated for each household, and the proportion of deprived households sampled by country and state (the smallest specified geographical area) is then reported. The most recent version corresponds to the 2019 census12. For Mexico, we calculated the “Marginalization Index” (MI), a metric developed by the Mexican National Population Council (Consejo Nacional de Población, CONAPO), also calculated for each household sampled in a national census15. The smallest specified geographic area for which this index is calculated is a “locality.” It is constructed by the percentage of people that have each of nine socioeconomic characteristics for that geographical area: older than 15 years and illiterate, older than 15 years and incomplete elementary school, no sewer system, no electricity, no piped water, household overcrowding, dirt floor, < 5000 inhabitants in the locality, and population with a maximum income equivalent to two minimum wages. This last variable is not available in the most recent census, so we substituted it for “percentage of people above age 12 that are not economically active or currently attending school.” Each variable weighs 1/9 and has a score that ranges from 0 to 100 (a higher score indicating higher marginalization). The 2020 census did not include the MI, so it was manually calculated using the information on individual variables with the open database created by the National Institute of Statistics and Geography (INEGI, for its initials in Spanish)16. In the COVID-19 open database, an individual is identified up to municipality (multiple localities are joined to form a municipality), so a mean score was calculated for each municipality using the score of the localities that constitute it, with the total population of each locality as a weight. We stratified patients by MPI (Colombia) or MI (Mexico) quintiles.
To determine whether confounding could impair the validity of stratification by MPI (Colombia)/MI (Mexico), we constructed two directed acyclic graphs (DAGs), one for each delay period as the outcome, and MPI/MI as the main exposure (Supplementary Fig. 1). In these causal models, MPI/MI was considered as the same variable. The proportion of POC tests across marginalization status was calculated for Mexico to determine accessibility to said tests beginning on November 15, 2020, the date in which these tests started to be performed. Colombia did not have the data to make this calculation.

Figure 1 Delay of COVID-19 diagnosis in Colombia and Mexico. (A) Colombia, (B) Mexico; delay-one: time from first symptom until testing; delay-two: time from testing until reporting of result; total delay: total time from first symptom until reporting of test result.
All analyses were done with R version 4.0.0. DAGs were built with the daggitty open software17. The study was approved by the Ethics Committee of Instituto Nacional de Ciencias Médicas y Nutrición Salvador Zubirán.
RESULTS
According to our DAGs (Supplementary Fig. 1), the total effect of MPI/MI on delay-one or delay-two can be directly estimated by stratification on this variable as the backdoor criterion is satisfied18. Delay periods by country and marginalization quintiles are shown in table 1. Over time, delay-one remained stable during the study period in Mexico. In Colombia, it had an initial peak at the beginning of the study period but decreased soon and remained stable (Fig. 1). Length of delay-one was similar across marginalization status in both countries while delay-two was markedly higher in places with worse marginalization in Colombia, but not in Mexico (Table 1 and Fig. 2).
Table 1 Delay periods of RT-PCR for SARS-CoV-2 testing (delay-one) and test turnaround time (delay-two)
| Variable | Colombia | Mexico |
|---|---|---|
| Delay period in days*, median (IQR) | – | – |
| Delay-one | 3 (0-6) | 3 (1-5) |
| Delay-two | 7 (4-11) | 4 (3-6) |
| Total Delay | 12 (7-15) | 8 (5-12) |
| Type of tester by day of test†, n (%): | – | – |
| Early testers | 242,965 (74.2) | 1,861,026 (55.3) |
| Late testers | 67,383 (18.8) | 1,238,593 (36.8) |
| Very late testers | 23,018 (7) | 263,788 (7.9) |
| Efficient test results report‡, n (%) | 41,497 (12.6) | 691,030 (20.5) |
| Classification of total delay§, n (%): | – | – |
| Optimal | 46,799 (14.3) | 815,504 (24.2) |
| Regular | 91,796 (28) | 1,407,143 (41.8) |
| Inadequate | 188,771 (57.7) | 975 492 (29) |
| Delay by marginalization status¶ | – | – |
| First quintile (lowest marginalization) | – | – |
| Median delay-one (IQR) | 3 (0-7) | 3 (1-5) |
| Median delay-two (IQR) | 7 (4-10) | 5 (3-8) |
| Median total delay (IQR) | 11 (7-16) | 8 (6-13) |
| Second quintile | – | – |
| Median delay-one (IQR) | 4 (1-6) | 3 (1-5) |
| Median delay-two (IQR) | 6 (4-11) | 4 (3-6) |
| Median total delay (IQR) | 11 (7-15) | 8 (5-11) |
| Third quintile | – | |
| Median delay-one (IQR) | 3 (0-5) | 3 (1-5) |
| Median delay-two (IQR) | 7 (4-11) | 4 (3-7) |
| Median total delay (IQR) | 11 (7-15) | 8 (5-12) |
| Fourth quintile | – | – |
| Median delay-one (IQR) | 4 (1-5) | 3 (2-5) |
| Median delay-two (IQR) | 8 (4-11) | 4 (3-6) |
| Median total delay (IQR) | 12 (8-15) | 8 (6-11) |
| Fifth quintile (highest marginalization) | – | – |
| Median delay-one (IQR) | 3 (0-5) | 3 (2-5) |
| Median delay-two (IQR) | 10 (6-11) | 4 (3-6) |
| Median total delay (IQR) | 14 (9-15) | 8 (6-11) |
*Delay-one: period from symptom onset until testing; delay-two: period from testing until result availability; total delay: time from symptom onset until result availability.
†“Early testers” were tested within the first 3 days of symptoms; “late testers,” from the 4th day until the 8th day; and “very late testers,” afterwards.
‡Defined as those results that were reported within 2 days from testing date.
§Total delay was classified as “optimal” if it was shorter than 5 days, “regular” if it was between 6 and 10 days long, or “inadequate” if it was more than 10 days.
¶Multidimensional Poverty Index for Colombia, Marginalization Index for Mexico.
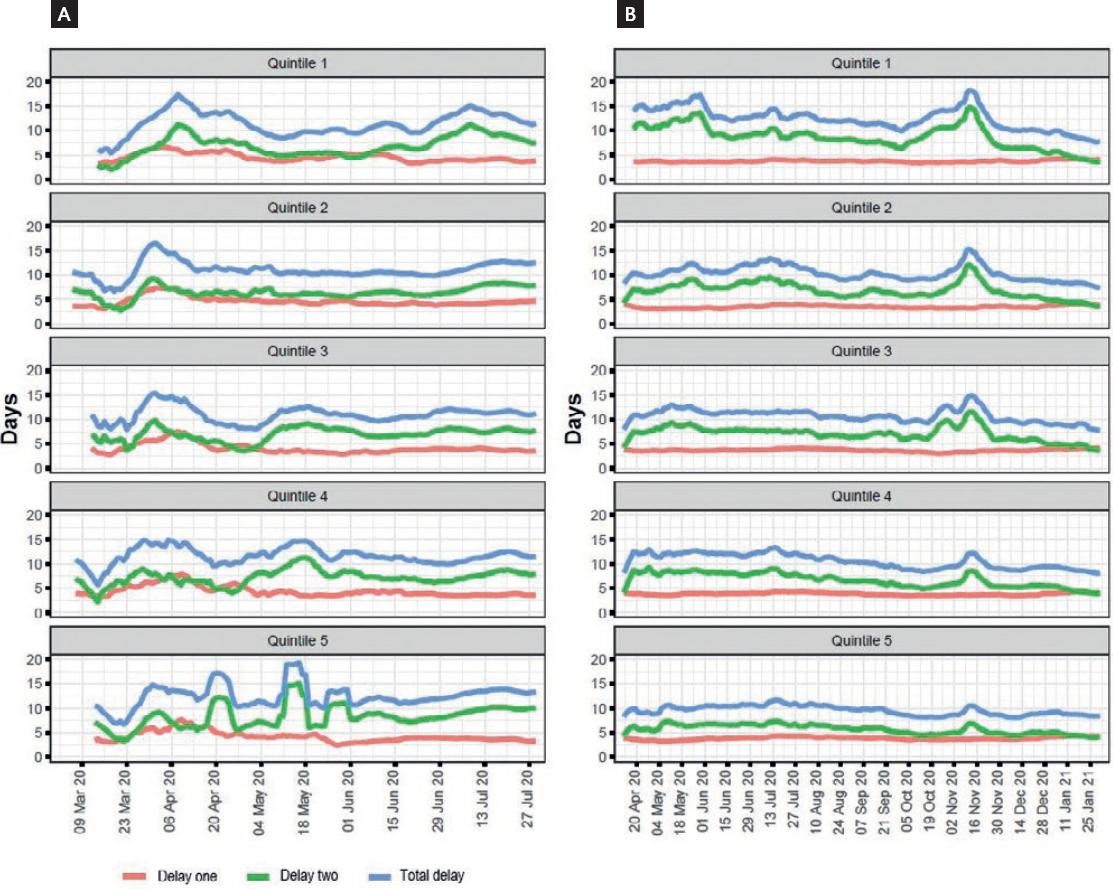
Figure 2 Delay periods of RT-PCR for SARS-CoV-2 in Colombia (A) and Mexico (B) (by Multidimensional Poverty Index/Marginalization Index). Delay-one: time from first symptom until testing; delay-two: time from testing to result reporting; total delay: total time from first symptom to test result reporting. Colombia uses the Multidimensional Poverty Index, while Mexico uses the Marginalization Index.
Delay-two was much longer than delay-one in both countries, causing the largest proportion of diagnostic delay. While there was a tendency toward the reduction of delay-two in Mexico over time (interrupted by a huge peak in October-November 2020), the length of delay-two increased over time in Colombia (Fig. 1). We observed a clear tendency toward a longer delay-two in the lowest quintiles of marginalization status indicators in Colombia but not in Mexico. The number and proportion of performed tests that were POC in Mexico were lower in the worst marginalization quintiles across the study period, even if by the end, the percentage was similar across quintiles (Table 2 and Fig. 3).
Table 2 Point-of-care tests according to marginalization status quintiles in Mexico
| Marginalization status | Total tests | POC tests (%) |
|---|---|---|
| Quintile 1 | 474,311 | 302,431 (63.8) |
| Quintile 2 | 531,135 | 355,065 (66.9) |
| Quintile 3 | 508,993 | 345,083 (67.8) |
| Quintile 4 | 368,728 | 144,461 (39.2) |
| Quintile 5 | 335,448 | 81,661 (24.3) |
POC: point-of-care. Fifth quintile represents the worst marginalization status. Study period for this calculation is from November 15, 2020, to January 31, 2021.

Figure 3 Percentage of tests on a given day that was point of care stratified by marginalization status quintile in Mexico (7-day rolling means). Quintile 5 represents the worst marginalization status.
Figures for the moving mean of delay-one, delay-two, and total delay stratified by MPI and MI are shown in figure 2. Eliminating the time lag between testing and result by applying POC tests would have saved a total of 2,652,774 days in Colombia (8.1/ person) and 22,172,666 in Mexico (6.9/person) from testing to results report.
DISCUSSION
The pandemic has caused a delay in healthcare provision in patients suffering from non-COVID-related illnesses, but delays in patients with COVID-19 symptoms have not been thoroughly described19. The time between symptoms onset and the first medical visit and testing may be determined by multiple factors such as symptoms severity, individual health-seeking behavior, geographical access, and socioeconomic status, among others20. Delays at each time point might be corrected or improved with specific strategies aiming to optimize the use of SARS-CoV-2 screening tests results for clinical case identification and isolation during the estimated period of infectiousness. We used this framework to describe the length of time between symptoms onset, testing and sample processing, and test results report for SARS-CoV-2 and its association with socioeconomic status in Colombia and Mexico. We observed that the median time between symptoms onset and tests results report exceeded that of infectiousness in Colombia and almost so in Mexico. This means most people received a diagnosis when they were no longer infectious, and was not due to their late arrival to healthcare. Most people were early testers, more so in Colombia than in Mexico. This supports the fact that diagnosing an acute infection with a test with a turnaround time longer than the infectious period is inefficient. If no other test was available, as occurred early in the pandemic or in places with limited resources, case definitions would become vital20-22.
Interestingly, we found a similar delay-two across all marginalization quintiles in Mexico except quintile one, in which it appeared to be longer. Furthermore, we found a much lower proportion of POC tests in the quintile with the highest marginalization. Conversely, delay-two was longer in areas with higher marginalization in Colombia. As no POC tests were performed in Colombia during the study period, this could more accurately reveal the infrastructure and availability of RT-PCR tests according to marginalization status. A specific hypothesis we would like to explore is the access to health care of particular individuals in each area. For example, areas with apparently lower marginalization could include individuals who are so-called “essential workers” and do not have the higher access to health-care one would expect in that area, and unevenly account for the seemingly longer delay-two. However, data on individual access to testing, as well as laboratory saturation, would be needed to accurately assess this. Since delay-one was short and remained constant overtime and across marginalization status, interventions to increase access to tests across the whole population, while important to test a larger number of persons, are less likely to have an impact on reducing delays in the diagnostic process, since the main component of the delay is the prolonged delay-two20.
POC antigen tests have been proposed as an effective strategy for epidemiologic surveillance. While their sensitivity is lower than RT-PCR tests (83-93% according to the Institute of Diagnosis and Epidemiological Reference in Mexico), their results are immediate, and their low cost easily allows for repeated testing23. Repeated testing with antigen tests has been shown to increase sensitivity in comparison with a 1 time RT-PCR24. An important argument against antigen tests is their lower sensitivity compared to RT-PCR tests. Proposed strategies based on antigen tests include repeated testing due to their low cost. If we consider that 10% fewer patients would be detected with POC tests (which would imply no repeat testing), these patients total 1,787,732 infectious days (considering an average of 12 infectious days per person), and with the current strategy, a total of 5,633,261 infectious days are undetected solely because of delay-two (3 times as much).
Since Mexico started using antigen tests during the late second half of 2020, we explored if these were being performed preferably in vulnerable areas. Even if by the end of the study period, the percentage of POC tests was similar between marginalization quintiles, the number of tests varied greatly, since only 18.4% of all POC tests were performed in the lower two quintiles. This is considering that a similar number of people were tested among all quintiles. Thus, it reveals under-testing in those most vulnerable and an unequal distribution of a valuable resource, which adds another layer to the mortality disparity seen between private and public health-care systems in Mexico25-27. A study performed in Cameroon showed high sensitivity of POC tests when performed within 7 days of symptom onset28. Importantly, they emphasize the viability of a testing algorithm in which RT-PCR tests are only performed in people who had a negative POC test. This would be particularly viable in places where RT-PCR tests are scantly available or delay times are too long, such as Mexico (particularly in more marginalized areas). Several countries, including Australia and The Netherlands, have even approved self-applied POC tests29,30. During periods of high transmission, these tests have been freely provided by the government, emphasizing the feasibility of the strategy.
Our study has several limitations. It used repurposed data, and as such it is difficult to ascertain the precision of initial symptom and diagnosis dates, but both countries use these data to make public health decisions and thus our results are applicable. The fact that Colombia does not share information on every tested individual is also a limitation, as positive individuals in that country could arrive to test at a different time, even if our exploratory analysis in Mexico does not show this. Selection bias might as well be present, since both countries limit testing, with Mexico testing only one in 10 ambulatory patients and in all those hospitalized31. We are unable to make conclusions regarding symptomatic patients who do not search for care and asymptomatic individuals, as they are not included in the open data. This could evidently influence either people's possibility to get tested or the laboratory's speed to provide results, but this is precisely our point. These variables were not accounted for in testing strategies in both countries during a long pandemic period, and low testing efficiency was a side effect of this.
Our study also has several strengths. It conveys information of two countries and a large number of individuals during a significant proportion of the pandemic. Even if data are repurposed, the main variables should not be affected by recall bias in a meaningful way since it is routine information. Thus, diagnostic delays can be adequately quantified. Furthermore, our use of DAGs makes our thought process transparent on estimating variable effect on testing delays.
The low efficiency of RT-PCR observed in our study supports the need of improving the efficiency of sample processing and test result's reporting. Antigen tests for epidemiological COVID-19 surveillance might contribute to reduce the time between sample collection and test result delivery. Our results also indicate that efforts and resources should be more heavily invested in highly marginalized areas and populations, which would make resource allocation more efficient.

