


 nueva página del texto (beta)
 Inglés (pdf)
 Artículo en XML
 Referencias del artículo
 Enviar artículo por email
 Citado por SciELO
  Similares en
SciELO
Similares en
SciELO 
 Permalink
INTRODUCTION
The coronavirus disease 2019 (COVID-19) pandemic, caused by the severe acute respiratory syndrome coronavirus 2 (SARS-CoV-2), is a worldwide priority. Accurate quantitative data are needed to implement efficient and adequate clinical and public health measures1. Although several diagnostic tests have been developed, real-time reverse transcription-polymerase chain reaction (RT-PCR) remains a gold standard diagnostic tool to identify SARS-CoV-2-positive patients2 due to its sensitivity and specificity.
In RT-PCR, short regions of the SARS-CoV-2 viral genome are amplified in successive cycles, in the presence of a fluorescent reporter probe that emits fluorescence only when the PCR occurs3. This fluorescence is proportional to the amount of genetic material of interest (i.e., the number of amplicons) in the sample4. An amplification curve is generated by measuring fluorescence (reported as the normalized reporter value ΔRn) after each amplification cycle3.
The amplification curve of a typical RT-PCR experiment starts with a no-amplification region, in which the measurement of the fluorescence lies below the detection threshold. In the presence of the target genetic material, a region showing exponential growth of the fluorescent signal due to exponential growth in the number of amplicons is observed. Finally, a stationary phase is reached when (and if) the detection limit is reached. The number of initial target molecules in the sample can be determined from the number of cycles required to reach the exponential phase; this threshold is called the cycle threshold (Ct)4.
Positive and negative controls are used to guarantee the high quality and reproducibility of the experiment and the integrity of the results5. A negative control will include all reagents without any target, whereas a specific target of interest will be present in the positive control. A positive amplification in the negative control will occur if there is any type of contamination, and an absence of amplification in the positive control will expose a deficient sample preparation or the presence of PCR inhibitors3,5.
Diagnostic protocols for SARS-CoV-2 testing using RT-PCR include several steps, from sample collection to diagnosis. First, a sample must be obtained, generally from the upper respiratory tract, from a probable COVID-19 case through a nasopharyngeal swab. Then, viral RNA is extracted by technicians and RT-PCR is performed to quantify specific regions of the viral genome, which have been previously validated for diagnostic use. The quality of the extracted RNA influences the success of the amplification process5. Finally, the RT-PCR data along with the experimental controls are analyzed, and a test result is generated.
Since the start of the pandemic, the Institute for Epidemiologic Diagnosis and Reference (Instituto de Diagnóstico y Referencia Epidemiológicos, InDRE) has certified hundreds of clinical and research facilities around Mexico for SARS-CoV-2 diagnosis using RT-PCR. As the demand for testing increases, these laboratories must increase their efforts to provide reliable and timely results. Having shorter turnaround time's helps to reduce the transmission of infectious diseases6; the World Health Organization suggests that new cases should be identified and reported within 24 h (https://apps.who.int/iris/bitstream/handle/10665/332073/WHO-2019-nCoV-Adjusting_PH_measures-Criteria-2020.1-eng.pdf).
Here, we present automated RT-PCR analysis (ARPA) software, designed to automatically examine RT-PCR amplification curves, quantifying the Ct per test or quality control (QC) sample. Engineered for COVID-19 diagnostic applications, ARPA provides diagnostic labels per sample and a final QC label per analysis plate. ARPA's performance is similar to that of a trained human analyst; however, it requires only a fraction of the time to label samples accurately.
ARPA provides a user-friendly graphic interface. It can be installed on any MacOS or Linux server, desktop, or laptop computer. Furthermore, ARPA provides templates to generate reports automatically, further reducing the workload of laboratory personnel. ARPA is a free and open software that is ready for use in COVID-19 diagnostic laboratories. ARPA can be downloaded from https://github.com/INMEGEN/ARPA.
METHODS
Sample collection and manual analysis
A total of 140 saliva samples were collected by healthcare workers from the epidemiology department of the Health Ministry of the State of Morelos (Secretaría de Salud Morelos, SSM). Briefly, the patients were asked to provide 2-3 mL of saliva in sterile urine cup containers (containing 1 mL of viral transport medium [VTM]). After collection, samples were stored at 4°C until transported to the Institute of Biotechnology/UNAM (IBT/UNAM) for their analysis, which was within 24-48 h after sample collection. Saliva samples were treated with the Quick ExtractTM DNA Extraction Solution (QE, Lucigen) by mixing 50 µL of saliva with 50 µL of the QE reagent and heating for 5 min at 95°C, cooled on ice, and kept at 4°C until use (within 1 h of QE treatment) as previously described7. Total RNA was extracted using the QIAamp viral RNA mini kit (QIAGEN) following the manufacturer's protocol, using 140 µL of VTM from each swab, and the purified RNA was eluted in 60 µL of elution buffer. SARS-CoV-2 detection was performed using the Charité-Berlin protocol3. Some studies have found that the degree of sequence variability in the region targeted by the RdRp probes is higher than that observed in the region targeted by the E probes8,9. Considering the recommendations made by the local authorities (InDRE), detection of SARS-CoV-2 was performed using primers and probes only for the E gene, in addition to a probe to amplify a constitutive human gene, such as RNase P (probe RP). The RT-qPCRs were performed using the StarQ One-Step RT-qPCR (Genes 2 Life) kit, using 5 µL of the column-extracted total RNA in 20 µL of reaction mix. Samples were analyzed using an ABI Prism 7500 Sequence Detector System (Applied Biosystems) with the following thermal protocol: 50°C for 15 min, 95°C for 2 min, followed by 45 cycles of 95°C for 15 s and 60°C for 30 s. All samples with a Ct value ≤ 40 were classified as positive.
QC experimental design
In-house QCs were designed to be used with the implemented Charité-Berlin protocol. The positive control contained in vitro transcribed RNA to monitor primer and probe integrity. Nuclease-free water was used as a negative control, and to detect any reagent contamination. Any of the components of the extraction kit handled in the same area as the test samples were used as the extraction control; this was used to monitor any contamination in the extraction kit or any mishandling during the extraction process.
Automatic analysis of PCR data
The process to analyze automatically data from a SARS-CoV-2 diagnostic RT-PCR requires three steps. First, a signal threshold must be determined for the analyzed plate. Second, ARPA must detect and quantify amplification by determining the cycle in which the curve crosses the signal threshold. Third, for each sample analyzed, a classification (in terms of positivity or negativity) must be provided based on the diagnostic criteria. All these steps were performed using R language10.
Threshold determination
ARPA extracts the fluorescence levels per cycle per well from the raw files (.eds extension file) generated by the RT-PCR machine. Then, ARPA determines the plate threshold by looking at the signal of each analyzed well between the 3rd and 10th cycles; the threshold was then set at 10 times the mean value of these signals. This heuristic technique is the same as that used by commercial software11.
Amplification detection and quantification
To assess whether a given well exhibits amplification, ARPA performs several fittings of the observed signal curve. The described procedure is useful for identifying noisy amplification in which the fluorescence signal goes sporadically above the threshold value instead of monotonically increasing during the exponential phase of amplification. This assessment also allows for the identification of samples in which there is a late amplification (above the fixed CT threshold) but a correct sigmoidal behavior for a given probe.
The process to evaluate whether the curve exhibits logistic growth is as follows: the EDS file contains the raw curve data-normalized reporter (Rn) versus cycle. Using these points, it attempts to fit the curve to a logistic model (using the nonlinear least-squares method from the stats package)10. If this model is properly fitted (R2> 0.9) and exhibits logistic growth, then the sample is considered to exhibit amplification. If the logistic fitting fails (R2< 0.9), a second attempt to fit the data to a logistic growth model is performed using the {growthrates} package12. If no logistic growth model could be fit (R2< 0.9), then this well is considered to exhibit no amplification.
In a manual RT-PCR analysis, the analyst will evaluate whether the curve shows the characteristic sigmoid shape as an indication that amplification occurred; therefore, the role of this step was to discern those wells in which amplification occurred versus plates in which no amplification occurred.
For wells in which amplification was detected, the next step involved identifying the intersection of the adjusted curve with the threshold value. By doing so, we were able to report a Ct value for a given well.
Diagnostic classification
Finally, ARPA classifies the samples based on the diagnostic criteria established in the analysis protocol. In the current implementation, a high fixed Ct value (equal to 40) was established to ensure that most amplifications were detected. Finally, the proposed diagnostic classification was returned for each sample. Probe E was designed to amplify the SARS-CoV-2 gene, so it must be present to determine whether a sample is positive for SARS-CoV-2. The probe RP amplifies a constitutive human gene, so it must be present to ensure that the amplification is successful. The absence of amplification for the probe RP indicates a poor QC analysis per plate. However, no final QC label is generated per plate, as we are aware that some laboratories could use different reaction settings as controls.
RESULTS
Test performance
We evaluated the performance of ARPA in human samples tested for SARS-CoV-2 using RT-PCR. A group of experts manually assigned diagnostic labels to 140 samples; 36 samples were labeled as positive and 104 as negative and no samples were labeled as invalid. We compared manually assigned labels with automatically assigned labels generated by ARPA. We assessed the performance of ARPA in all samples that were considered valid by both approaches. ARPA was classified as invalid for two of the samples; these samples were not considered in the performance metrics calculation.
In this study, no independently validated ground truth is available. Therefore, we considered the labels assigned by human inspection as accurate. After ARPA classification, any discrepancy was considered a false assignment, and any agreement was considered a true assignment. Positive agreements were called true positives (TP), and negative agreements were called true negatives (TN). A real positive sample classified as negative by ARPA would be considered as a false negative (FN), and a real negative sample classified as positive would be a false positive (FP).
ARPA successfully recovered all the TPs (sensitivity = TP Rate = TP/TP + FN = 1), and correctly classified 98% of the TNs (specificity = TN rate = TN/FP + TN = 0.98). In summary, 97.3% of the samples (classified as valid by both methods) were assigned to any of the agreement categories: either TP or TN (Table 1). The amplification curves for one positive and one negative sample are shown in figure 1. Only two samples (1.45%) were incorrectly labeled as positive by ARPA, and two samples were classified as invalid by ARPA but manually labeled as negative. Importantly, no sample was incorrectly labeled as negative.
Table 1 Confusion matrix for manual and ARPA-derived classification for samples classified as valid by both methods
| Method | Manual | |
|---|---|---|
| ARPA | Positive | Negative |
| Positive | 36 (26.08%) | 2 (1.45%) |
| Negative | 0 | 100 (72.47%) |
ARPA: automated RT-PCR analysis; RT-PCR: reverse transcription polymerase chain reaction.
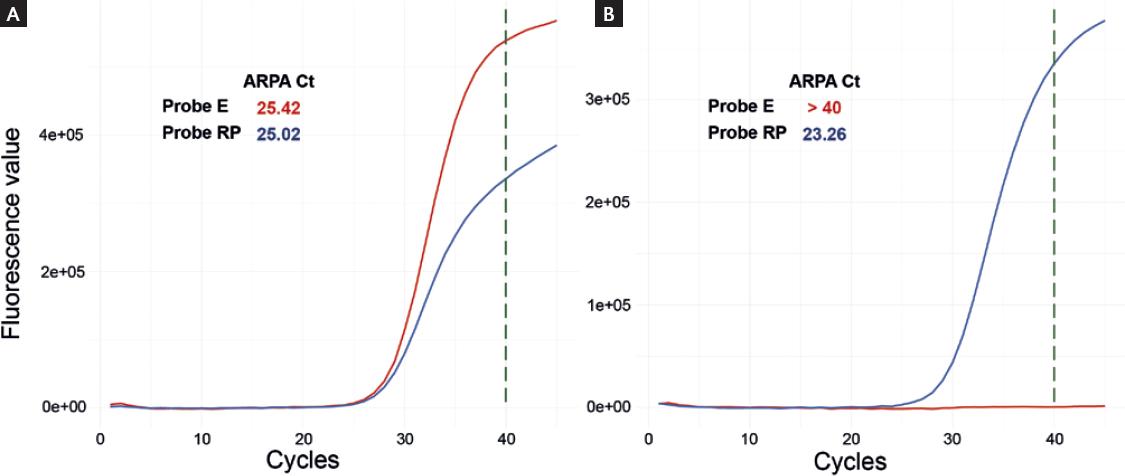
Figure 1 (A) Amplification curves for one sample labeled as positive by automated reverse transcription polymerase chain reaction analysis (ARPA). (B) Amplification curves for one sample labeled as negative by ARPA.
We also calculated the Cohen's kappa coefficient to provide a measure of reliability. This coefficient is used to quantitatively measure the agreement between the two raters or methods rating categorical states. It is more robust than the agreement rate, as it takes into account the proportion of agreement expected by chance. The kappa coefficient between ARPA and manual assignment was 0.96 (p < 0.01), which has been suggested to be interpreted as almost perfect agreement13.
ARPA implementation
We developed a user-friendly interface that can be installed on any Unix or MacOS platform to analyze the RT-PCR data. Raw files generated by the RT-PCR equipment are chosen by the user through this interface using a click and choose system that opens an explorer window and allows the user to navigate down to the folder where the raw files are stored. The same interface allows the user to select the directory to save the HTML reports (Fig. 2a). The user starts the analysis by clicking the button "Start analysis," and a progress bar appears at the bottom of the interface to show that the samples are being processed. In the background, the software reads the raw data, transforms it into amplification curves, calculates the fluorescence threshold and Ct values, assesses sigmoidal behavior, applies the classification logic, assigns a final classification per sample, and performs QC per plate. At the end of the analysis, a table with the analysis results is printed on the tab "Summary table." This table contains the name of each sample, the Ct values for each probe per sample, and the final classification per sample. All negative samples are colored with an aquamarine background; all positive samples are highlighted in red, and invalid samples have no background color. The QC table and one amplification curve per QC control are shown on the "QC Analysis" tab; the QC table contains a row per QC control and shows the Ct value per probe. Furthermore, the user can select any sample to visualize its amplification curve on the "Curves per sample" tab (Fig. 2b). Finally, all this information is saved in an HTML report. The report is generated by clicking the button "Generate reports" on the web interface. An HTML report is generated per sample, and a QC report is generated per plate.

Figure 2 Automated reverse transcription polymerase chain reaction analysis (ARPA) graphic user interface. (A) The EDS raw file and the directory to save the reports is selected by a click-and-choose system. The analysis is started by clicking the "Start Analysis" button and the reports are generated by clicking the "Generate reports" button. (B) ARPA presents the results per sample, and each sample's amplification curve as well as the QC results, on the online interface.
ARPA takes approximately 1.5 s to analyze one sample, and an average of 48 s to analyze a whole run. The analyzed run had a minimum of 8 samples, a maximum of 40 samples, and a mean of 21.5 samples. Thus, ARPA could drastically reduce the time devoted to analysis and report-generation processes.
DISCUSSION
In this study, we developed a tool that automates the analysis of RT-PCR data for pathogen detection. This tool models the amplification curves as sigmoidal functions or logistic curves and restricts the amount of RNA that should be detected at the end cycle compared to the initial cycle. As in any statistical analysis, several thresholds were imposed along with the analysis, and each threshold was chosen to prefer type I errors over type II errors. Type I errors occur when a negative sample is incorrectly labeled as positive, and type II errors occur when a positive sample is incorrectly labeled as negative.
ARPA exhibited two type I and no type II errors. It labeled two samples positive that was evaluated as negative by manual method. In both cases, a strong amplification signal was observed for probe RP. In one sample, there was a small increase in the fluorescence signal detected in the probe E amplification (Fig. S1a), contrary to the other sample, which showed no evident increase (Fig. S1b). However, the probe E amplification curves in both samples behaved as sigmoidal; the fluorescence signal exceeded the fixed threshold before the established cycle (Ct < 40), and the fluorescence signal of the final cycle was above the threshold (at least 100 times higher than the signal at the initial cycle). In both cases, ARPA favors the detection of amplification even when the detected signal is too low to be considered positive by visual inspection.
In this study, samples were not selected based on their Ct values. All samples tested in the clinical laboratory were included in the performance analysis. We included samples with Ct values ranging from 22 to 34.8. Moreover, 12/36 positive samples showed a Ct value higher than 30 in the manual analysis. All of them were consistently labeled as positive by ARPA, suggesting that ARPA could handle difficult samples.
From a public health perspective, type II errors could increase pathogen propagation, as false-negative infected patients could disperse the pathogen. In contrast, type I errors would be the least harmful because false-positive non-infected patients would be asked to isolate for 15 days.
In conclusion, the type of error made by ARPA is the least harmful, as negative patients will be asked to isolate even when a manual inspection of the amplification curves would have suggested that they are not infected14.
On the other hand, two samples were classified as invalid by ARPA but manually labeled as negative. In both cases, we observed a very late amplification of the probe RP, which manifests as a signal that starts to increase very close to cycle 40. This results in a fluorescence signal crossing the established fluorescence threshold after cycle 40 (Ct > 40) (Figs. 1c and 1d). Any sample with a Ct higher than 40 for probe RP amplification was automatically labeled as invalid by ARPA. Very late amplification could indicate either low-concentration or low-quality genetic material. In a real-case application, this small percentage of samples could be manually inspected to determine whether the experiment should be repeated.
To the best of our knowledge, few other tools have been developed to aid in the analysis of RT-PCR data. PCR.ai is a proprietary software developed by Diagnostics.ai, designed to automatically and rapidly interpret RT-PCR curves. PCR.ai runs directly on the RT-PCR platform and interfaces with the Abbott Laboratory Information Management System to make the results downloadable and accessible. The technical details of the implementation are not publicly available. In this study, the authors measured the time taken by either automatic or manual analysis, and concluded that there is a time saving that varies from 5 min to 40 min per run, which could translate into 160 h per year based on a run per day over a 5-day week15. As an automatic system, ARPA's implementation could reduce the time required for the diagnostic pipeline and reduce the workload of trained personnel to work on other critical tasks.
It has been shown that automating diagnostic procedures not only improves efficiency in terms of number of processed samples and higher reproducibility but it also reduces the likelihood of human errors such as mislabeling16,17. Therefore, ARPA could contribute to the streamlining of diagnostic procedures when high volumes of samples must be processed.
ARPA proved to be a sensitive and specific software that facilitates RT-PCR data analysis. It could be applied when a high volume of samples needs to be analyzed, freeing-up the time of trained personnel, reducing human errors, and increasing reproducibility.
SUPPLEMENTARY DATA
Supplementary data are available at Revista de Investigación Clínica online (www.clinicalandtranslationalinvestigation.com). These data are provided by the corresponding author and published online for the benefit of the reader. The contents of supplementary data are the sole responsibility of the authors.

