


 nueva página del texto (beta)
 Inglés (pdf)
 Artículo en XML
 Referencias del artículo
 Enviar artículo por email
 Citado por SciELO
  Similares en
SciELO
Similares en
SciELO 
 Permalink
INTRODUCTION
Left ventricular hypertrophy (LVH) is a major complication of essential hypertension (EH)1. Approximately one-third of EH patients develop LVH2,3. The presence of LVH has been identified as a strong independent risk factor for cardiac events and all-cause mortality in the long-term4,5. Thus, early detection of LVH is critical for the long-term outcome of EH patients. Although traditional methods, such as electrocardiography, echocardiography, computed tomography, and magnetic resonance imaging, have been widely used to detect LVH, their effectiveness can be hindered by low sensitivity and specificity, lengthy diagnostic time, and technical complexity. Therefore, novel methods for LVH detection with adequate accuracy, easy access, and low cost remain an unmet clinical need.
MicroRNAs (miRNAs) are small (~22 nucleotides in length), endogenous, non-coding RNAs that degrade the target messenger RNA or by direct translational inhibition, thus blocking the expression of specific genes6. The fundamental roles (miRAN) play in diverse biological and pathologic processes, including cell development, differentiation, proliferation, and apoptosis, have been widely studied7. Of note, miRNAs are expressed not only in tissues but are also detectable in peripheral blood circulation. The miRNAs levels in circulating blood are not only stable but also they are easy to obtain, making them excellent surveillance approaches for physiological and/or pathological conditions. To date, circulating miRNAs have been used as easily accessible biomarkers to monitor diseases such as cancer radio-sensitivity and metastasis7-9.
The previous studies have shown that miRNAs play pivotal roles in the development of cardiac hypertrophy and subsequent cardiac dysfunction10-13. Of these miRNAs, the miR-30 family, which is encoded by six genes located on human chromosomes 1, 6, and 8, is abundantly expressed in cardiomyocytes14,15. The miR-30 family contains six members, namely, miR-30a, miR-30b, miR-30c-1, miR-30c-2, miR-30d, and miR-30e. These miRNAs share a common seed sequence near the 5´ end. However, they possess different compensatory sequences near the 3´ end, allowing them to target diverse genes and pathways and perform the corresponding biological functions16.
It has been reported that the miR-30 family is critical in regulating the expression levels of genes responsible for autophagy, apoptosis, oxidative stress, inflammation, and fibrosis, which are the pathological basis of LVH development17-19. Indeed, the role of miR-30 family in cardiomyocyte hypertrophy has been reported in cultured cells and animal studies17,20,21; however, the significance of mir-30 family members in a clinical setting has not been evaluated so far. In this study, we measured the circulating levels of the above miR-30 family members in EH patients. We sought to explore their clinical significance in distinguishing EH patients with LVH (EH-LVH) from those without (EH-nLVH).
METHODS
Study population
In this matched casecontrol study, we recruited 239 EH patients, 90 with LVH (EH-LVH) and 149 without (EH-nLVH), and 239 healthy subjects with normal blood pressure (Controls). Hypertension was diagnosed according to the World Health Organization criteria when presenting a systolic blood pressure (SBP) of 140 mmHg or above, or diastolic blood pressure (DBP) of 90 mmHg or above. All enrolled subjects had no other concomitant diseases, including another form of hypertension in addition to essential hypertension, body mass index (BMI) greater than 35 kg/m2, cancer, heart valve disease, acute coronary artery disease or acute myocardial infarction, Chagas disease, bundle branch block, and ventricular pre-excitation syndromes.
Ethics
All procedures followed were in accordance with the Helsinki Declaration of 1975, as revised in 1983. The institutional Ethics and Clinical Research Committee of the Hangzhou First Peoples Hospital approved the study (ZDHZ-01A), and all subjects in this study gave written informed consent at enrollment.
Data collection
Clinical data regarding blood pressure values, diabetes mellitus (DM), and smoking history were collected on admission. BMI was calculated according to each participants weight and height. Biochemical variables, including serum creatinine, total cholesterol (TC), total triglycerides (TG), high-density lipoprotein cholesterol (HDL-C), and low-density lipoprotein cholesterol (LDL-C), were retrieved from the patients medical chart.
Echocardiographic measurements
Echocardiographic examinations were performed using a 2.5 - MHz probe with a Vivid 7 Pro (GE Vingmed, Horten, Norway) echocardiography device. Echocardiographic imaging was performed according to the recommendations of the American Society of Echocardiography. 12 LVM was calculated according to the Devereux formula. 13 LVM (gr) = 0.8 × {1.04 × [(pWTd + IVSd + LVEDD) 3 (LVEDD)3} + 0.6, where d is end - diastole, PWTd is the posterior wall thickness, IVSd is interventricular septal thickness, and LVEDD is LV end - diastolic dimension. Subsequently, relative wall thickness was calculated as the ratio: 2×(LV posterior wall thickness/LV end - diastolic diameter). LV hypertrophy was defined as increased LVM index (LVM/body surface area) ≥115 g/m2 for men and ≥95 g/m2 for women, as proposed by the European Society of Hypertension22.
RNA isolation and reverse transcription and real-time polymerase chain reaction (rt-PCR)
About 5 mL venous blood samples were collected in heparin treated tubes from early morning fasting venous blood of all participants. Total RNA was extracted using the RNAprep Pure Hi-Blood Kit (Qiagen Inc). Reverse transcription was conducted using a PrimeScript RT reagent kit (Takara Bio, Japan). Expressions of miR-30 family members were performed by quantitative rt-qPCR with the SYBR Premix Ex Taq II (Takara, Dalian, China). The rt-qPCR reaction contained 10 µL SYBR Premix, 0.8 µL forward primer, 0.8 µL reverse primer, 2 µL cDNA, and 6.4 µL nuclease-free water. All samples were performed in triplicate. Glyceraldehyde 3-phosphate dehydrogenase was applied for the internal normalization of RNA. The PCR reaction was performed at 95°C for 3 min, followed by 40 cycles of 95°C for 10 s and 60°C for 30 s. The comparative cycle threshold (Ct) method (ΔCt) was used to calculate the relative expression levels of miRs. The mean Ct values and deviations between the duplicates were calculated for all samples. Primers for the miR-30 were as follows: miR-30a, Forward CTAGCCTGCAGGATAAACTTACTCATGTTCTA3´, Reverse ATCCGGCCGGCCTACTCTGAGATTTGATAAAT; miR-30b, Forward TAGCCTGCAGGTAGGTGGG- AAAAGCTATAGA, Reverse ATCCGGCCGGCCGCTGACAAAGAAGTGGAGAC; miR-30c-1 Forward 5-CTAGCCTGCAGGGACAGTTTGTCATGCAAGTA, reverse ATCCGGCCGGCCGCGATGGAAGATGCTACCCA; miR-30d, 5-GATGATGACTGG CAACAT-3´, and reverse: 5´-GAA TAG CCG GTA GCA GCA-3´; miR-30e Forward CTAGCCTGCAGGGGTTTAGTGTAATATGCCTC, Reverse ATCCGGCCGCCGCTCTTTAGTCATVATTTCA, β-actin, Forward AGAGCTACGAGCTGCCTGAC and reverse GGATGCCACAGGACTCCA16,23. For validation purposes, 20 samples were sent for sequencing and all PCR products were checked with the electrophoresis analyses.
Statistical analysis
The mean ± standard deviation or median is presented as continuous variables with quartile ranges, and comparisons were conducted using a one-way ANOVA or the MannWhitney U-test. Categorical variables were described as numbers and percentages. The clinical parameters associated with EH risks were assessed by multivariable linear regression analysis. The relationships between the expressions of miR-30 family members and the LVMI were calculated using Pearsons correlation test. Then, the area under the receiver operating curve (ROC) was created to evaluate the potential value of miR-30. The area under the curve (AUC), sensitivity, and specificity were determined. Moreover, the logistic regression with backward elimination was performed to determine the independent predictors of the presence of LVH. The crude odds ratio was adjusted after introducing factors including age, gender, smoking status, SBP, DBP, and DM, together with TC, TG, HDL-C, LDL-C, as well as all the circulating levels of the miR-30 family members. All statistical analyses were performed with SPSS software 22.0 (IBM, Chicago, IL, USA) and GraphPad Prism 5.0 (GraphPad Software, La Jolla, CA, USA), and p < 0.05 was considered statistically significant.
RESULTS
Clinical features of patients and controls
The baseline characteristics of all EH patients and healthy controls are detailed in Table 1. EH patients had significantly higher SBP, DBP as well as high-sensitivity C-reactive protein (hs-CRP) levels and a higher prevalence of DM. No differences in gender, age, smoking status, as well as BMI, TC, TG, LDL-C, and HDL-C levels were found between the EH and control groups. The LV mass index (LVMI) was dramatically higher in EH patients than controls (p < 0.001). As for circulating miR-30 levels, we found that circulating miR-30a, miR-30b, miR-30d, and miR-30e were significantly reduced in EH patients in contrast to controls (all p < 0.01). The miR-30c-1 and miR-30c-2 levels were similar in the two groups.
Table 1 Baseline characteristics of control and EH subjects
| Characteristic | Control (239) | EH (239) | p-value |
|---|---|---|---|
| Age | 63.6 ± 5.5 | 64.2 ± 6.1 | NS |
| Male | 168 (70.3%) | 172 (72.0%) | NS |
| BMI | 23.60 ± 6.10 | 24.10 ± 7.5 | NS |
| SBP | 122.32 ± 10.4 | 151.64 ± 13.4 | <0.001 |
| DBP | 66.24 ± 7.52 | 84.37 ± 8.52 | 0.016 |
| Smokers | 80 (33.50%) | 85 (35.50%) | NS |
| TC (mmol/L) | 3.65 ± 1.23 | 3.72 ± 1.12 | NS |
| LDL-C(mmol/L) | 1.97 ± 0.61 | 1.95 ± 0.96 | NS |
| HDL-C (mmol/L) | 0.98 ± 0.35 | 0.97 ± 0.52 | NS |
| TG (mmol/L) | 1.48 ± 0.57 | 1.52 ± 0.66 | NS |
| Diabetes | 56 (23.43%) | 88 (36.82%) | 0.024 |
| Creatinine | 70.48 ± 16.76 | 76.66 ± 18.67 | NS |
| Hs-CRP (mg/L) | 0.78 ± 0.25 | 1.54 ± 0.68 | 0.035 |
| MMP-9 (ng/mL) | 338.9 ± 78.6 | 576.07 ± 67.8 | 0.013 |
| LVMI | 88.5 ± 13.7 | 112.6 ± 22.5 | <0.001 |
| MIR-30a | 9.85 ± 2.05 | 5.52 ± 1.82 | <0.001 |
| miR -30b | 8.65 ± 1.54 | 3.02 ± 1.42 | <0.001 |
| miR -30c-1 | 4.65 ± 1.21 | 4.02 ± 1.59 | NS |
| miR -30c-2 | 6.15 ± 1.99 | 5.82 ± 1.18 | NS |
| miR -30d | 10.15 ± 3.21 | 7.02±2.36 | 0.038 |
| miR -30e | 16.65 ± 1.59 | 8.12 ± 1.16 | <0.001 |
BMI: body mass index; TC: total cholesterol; LDL-C: low-density lipoprotein cholesterol; HDL-C: high-density lipoprotein cholesterol; TG: triglycerides; Hs-CRP: high-sensitivity C-reactive protein; EH: essential hypertension; miR: microRNA; SBP: systolic blood pressure; DBP: diastolic blood pressure.
We subdivided the EH patients based on the presence (EH-LVH, n = 90) or absence (EH-nLVH, n = 149) of LVH. As shown in Table 2, EH-LVH patients had substantially lower circulating miR-30b, miR-30d, and miR-30e levels compared to EH-nLVH patients (p = 0.017, 0.011, and <0.001, respectively). The other forms of miR-30 and baseline characteristics were similar between EH patients with and without LVH.
Table 2 Baseline characteristics of EH subjects with (EH-LVH) and without (EH-nLVH) left ventricular hypertrophy
| Characteristic | EH-nLVH (149) | EH-LVH (90) | p-value |
|---|---|---|---|
| Age | 63.7 ± 7.6 | 65.4 ± 5.3 | NS |
| Male | 108 (72.48%) | 64 (71.11%) | NS |
| BMI | 23.70 ± 5.18 | 25.03 ± 8.5 | NS |
| SBP | 152.54 ± 9.88 | 158.31 ± 15.58 | NS |
| DBP | 84.54 ± 6.67 | 86.89 ± 9.12 | NS |
| Smoking | 54 (36.24%) | 31 (24.44%) | NS |
| TC (mmol/L) | 3.68 ± 1.05 | 3.96 ± 1.56 | NS |
| LDL (mmol/L) | 1.93 ± 0.78 | 2.02 ± 1.02 | NS |
| HDL (mmol/L) | 0.94 ± 0.65 | 1.03 ± 0.98 | NS |
| TG (mmol/L) | 1.48 ± 0.96 | 1.63 ± 0.38 | NS |
| Diabetes | 57 (38.26%) | 31(34.44%) | NS |
| Creatinine | 74.41 ± 19.11 | 78.66 ± 18 | NS |
| Hs-CRP (mg/L) | 1.45 ± 0.63 | 1.97 ± 0.82 | 0.024 |
| MMP-9 (ng/mL) | 649.5 ± 98.8 | 527.07 ± 47.8 | 0.018 |
| LVMI | 136.6 ± 14.8 | 87.6 ± 1 | <0.001 |
| miR-30a | 5.78 ± 1.28 | 5.34 ± 1.18 | NS |
| miR-30b | 3.57 ± 1.57 | 2.44 ± 1.06 | 0.017 |
| miR-30c-1 | 4.15 ± 1.27 | 3.92 ± 1.79 | NS |
| miR-30c-2 | 5.73 ± 1.49 | 6.02 ± 1.48 | NS |
| miR-30d | 8.28 ± 3.67 | 5.24 ± 2.28 | 0.011 |
| miR-30e | 10.87 ± 1.95 | 5.08 ± 2.04 | <0.001 |
BMI: body mass index; TC: total cholesterol; LDL-C: low-density lipoprotein cholesterol; HDL-C: high-density lipoprotein cholesterol; TG: triglycerides; Hs-CRP: high-sensitivity C-reactive protein; MMP-9: matrix metallopeptidase 9; LVH: left ventricular hypertrophy; EH: essential hypertension; miR: microRNA; SBP: systolic blood pressure; DBP: diastolic blood pressure.
We used Pearsons correlation test to evaluate the relationship between circulating miR-30 levels and baseline characteristics, such as age, SBP, DBP, hs-CRP, TC, TG, HDL, LDL, and LVMI, of EH patients. We found that the expression level of miR-30b and miR-30e was negatively correlated to LVMI (r = −0.79, p < 0.001; r = −0.93, p < 0.001), hs-CRP (r = −0.74, p < 0.001; r = −0.88, p < 0.001), and matrix metallopeptidase (MMP)-9 (r = −0.69, p = 0.022; r = −0.73, p = 0.017), respectively.
The above data suggested that some miR-30 family members, especially the miR-30b and miR-30e, may serve as diagnostic markers for LVH in EH patients. We performed the ROC curve analysis to confirm this hypothesis. As shown in figure 1 (left), for miR-30e at a cutoff value of 3.74, the AUC was 0.929 (95% CI, 0.785-0.976; p < 0.001) with 88% sensitivity and 74% specificity to distinguish EH-LVH from EH-nLVH patients. Besides, as shown in figure 1 (right), the circulating miR-30e level is sufficient to differentiate EH from controls at a cutoff value of 3.68 (AUC was 0.843, 95% CI, 0.804-0.896, p < 0.001, with 79.1% sensitivity and 70.3% specificity). On the other hand, the miR-30b failed to distinguish EH patients from controls and EH-LVH from EH-nLVH individuals (data not shown).
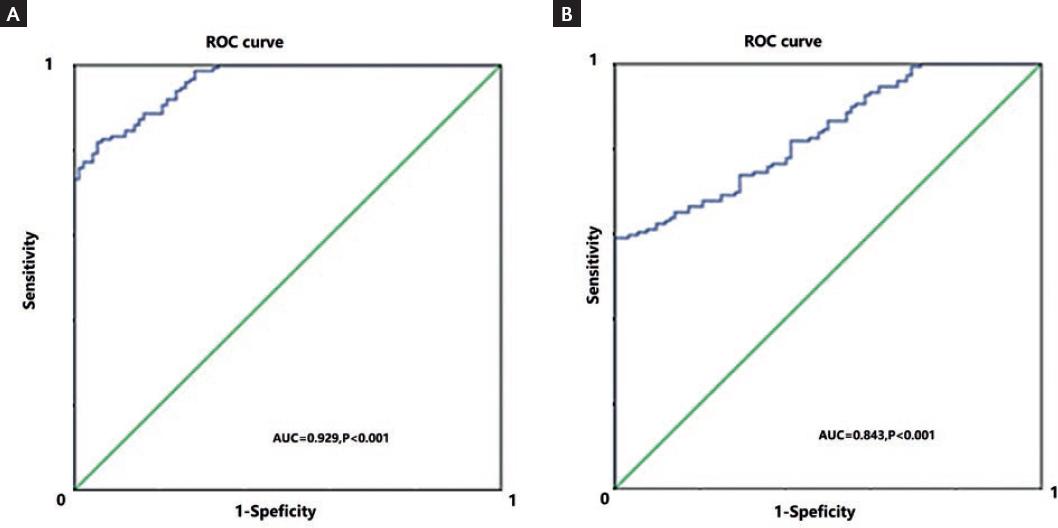
Figure 1 Graphs show ROC analyses of circulating microRNA-30e levels. A: In the analysis for distinguishing essential hypertension-left ventricular hypertrophy (EH-LVH) from EH-NLVH patients, the AUC was 0.929 (95% CI, 0.785-0.976; p < 0.001) with 88% sensitivity and 74% specificity (cutoff value, 3.74). B: In distinguishing EH patients from healthy controls, the AUC was 0.843 (95% CI, 0.804-0.896, p < 0.001), with 79.1% sensitivity and 70.3% specificity (cutoff value, 3.68). p < 0.05 was considered statistically significant. ROC: receiver operating curve, AUC: area under the curve.
We then identified the risk factors for LVH using logistic regression analyses. In univariate analysis, the presence of DM, SBP >160 mmHg, and circulating miR-30e <3.74 was each significantly associated with greater odds of having LVH (Table 3). In the multivariate analysis, SBP >160 mmHg or circulating miR-30e <3.74 was identified as independent risk factors for LVH in the study cohorts (Table 3).
Table 3 Risk factors for LVH identified by logistic regression analyses
| Variables | Hazard ratio | Univariate | Analysis | Hazard ratio | Multivariate | Analysis |
|---|---|---|---|---|---|---|
| 95% CI | p-value | 95% CI | p-value | |||
| DM | ||||||
| No | 1 | 1 | ||||
| Yes | 1.36 | 1.08-2.54 | 0.036 | 1.18 | 0.95-2.47 | 0.056 |
| SBP >160 mmHg | ||||||
| No | 1 | 1 | ||||
| Yes | 1.88 | 1.23-4.02 | 0.008 | 1.94 | 1.28-4.17 | 0.006 |
| miR-30e | ||||||
| >3.74 | 1 | 1 | ||||
| <3.74 | 2.25 | 1.47-6.45 | 0.004 | 2.03 | 1.66-6.02 | 0.003 |
LVH: left ventricular hypertrophy; miR: microRNA; SBP: systolic blood pressure; DM: diabetes mellitus.
DISCUSSION
In this study, we evaluated the clinical significance of circulating levels of miR-30 family members as clinical markers for LVH in EH patients. We found that most of miR-30 family members (except miR-30c1 and c2) were lower in EH patients with LVH compared to those without LVH. Further analyses revealed that miR-30e could efficiently discriminate EH-LVH from EH-nLVH patients. This finding confirms the role of miR-30e in a clinical setting and provides a novel biomarker for LVH in EH patients.
The miR-30 family members are encoded by six genes located on human chromosomes 1, 6, and 810,13. The miR-30 family has different compensatory sequences near the 3´ end, allowing each member to target different genes and pathways, thus performing corresponding biological functions13. For example, miRNAs-30a-5p inhibits modulating GRP78 expression and suppresses the growth of renal cell carcinoma24. Mir-30d suppresses colon cancer cell growth by inhibiting cell genes regulating autophagy25. miRNA 30e regulates smooth muscle cells response to oxidative stress through Snai1 in an atherosclerosis animal model26.
To the best of our knowledge, this study is the first to report the clinical significance of miR-30e as a biomarker for LVH in EH patients. The role of miR-30e in cardiovascular diseases has been reported previously. For example, miR-30e in the myocardium is inhibited after the occurrence of coronary microembolization, together with decreased cardiac function27. miR-30e alleviates apoptosis induced by hypoxia in human stem cell-derived cardiomyocytes28. Of note, the effect of miR-30e on cardiomyocyte hypertrophy was reported in a series of cellular and animal studies. MiR-30e can repress the Angiotensin II-induced hypertrophic phenotypes in cardiomyocytes by targeting ADAM929. Yin et al. found that myocardial expression of miR-30a was decreased in mouse models of hypertrophy, and in H9c2 cells treated with phenylephrine by activating autophagy21. It is reported that this miR can reduce isoproterenol-induced cardiac dysfunction and fibrosis in a rat cardiac remodeling model30. The authors of this study observed a significant reduction of miR-30e in the cardiac samples of isoproterenol-treated rats alone with cardiac fibrosis. In contrast, the in vivo administration of miR-30e antagomir increased the survival of ISO-treated rats.
Other miR30 members, such as miR-30a, have also been reported to alleviate cardiac fibrosis in rats that underwent myocardial infarction31. The overexpression of miR-30c reduces cardiac fibrosis, and inhibition of miR-30 leads to collagen synthesis in heart tissue18. However, our study did not prove its clinical value in patients.
Mechanistically, the miR-30 family can inhibit autophagy and apoptosis, decrease inflammation, etc., thereby reducing collagen deposition and myocardial fibrosis, and preventing cardiac hypertrophy19. We thus detected the correlation between miR-30 family members and the circulating markers for inflammation (hs-CRP) and collagen synthesis (MMP-9). We found that only miR-30e showed a negative correlation with serum hs-CRP and MMP-9, suggesting that the patients with lower miR-30e have a relatively low level of inflammation and cardiac fibrosis.
A major limitation should be addressed in this study. Our current study is a single-center based clinical research with a small sample size. To validate the value of circulating miR-30e in LVH detection, a multi-centered prospective study with a larger sample size is warranted.

