


 nueva página del texto (beta)
 Inglés (pdf)
 Artículo en XML
 Referencias del artículo
 Enviar artículo por email
 Citado por SciELO
  Similares en
SciELO
Similares en
SciELO 
 Permalink
INTRODUCTION
Around 46,060,000 confirmed cases of coronavirus disease 2019 (COVID-19) have been reported worldwide by country governments by October 31, 20201. The Mexican government reported 924,962 confirmed cases to that date2. Case confirmation is mostly based on identification of severe acute respiratory syndrome coronavirus 2 (SARS-CoV-2) RNA using real-time reverse-transcription polymerase chain reaction (RT-PCR) in clinical samples collected through nasopharyngeal or oropharyngeal swabs, saliva, or bronchoscopy. Dealing with the disease has proven extremely challenging for governments and health systems worldwide, partially due to the difficulties in case identification. Various measures have been proposed to reduce the virusҠimpact on the population, and most of them rely on case identification for isolation and contact tracing3-5.
The World Health Organization (WHO) has highlighted the importance of generalized testing with the goals of early detection, quarantine, and contact tracing. Countries such as South Korea and Iceland have been successful in implementing widespread testing, case isolation, and contact tracing, keeping the virus under control6,7. In countries where tests are less available, focusing this resource on high-risk individuals was deemed reasonable as a provisional strategy, with the urge to increase testing capacity. Mexico chose a different strategy, and the decision to use testing only for surveillance purposes was made early in the pandemic. Criteria for testing are applied as for the sentinel surveillance system for influenza, and the information provided is allegedly used to estimate the total number of infections based on mathematical modeling. As anywhere else, underestimation of the number of cases has been a constant concern4-7.
Diagnostic tests rarely, if ever, are completely reliable, and RT-PCR for SARS-CoV-2 is no exception. Specificity almost always nears 100% in this kind of tests, but poor sensitivity has been an issue. Kucirka et al. estimated that test sensitivity is highest at the fourth day of symptom onset (81%; 95% confidence limits [CL] 71-88%)8. Sensitivity is the lowest during the asymptomatic and late symptomatic periods (e.g., 37%, 95% CL 26-49% at day 21 after symptom onset). Other factors that could influence the accuracy of the test are the type of clinical specimen, severity of infection, and gene targets. A combination of these, and other factors, may account for the underestimation of the number of cases and attributable deaths worldwide8-11. Until screening and diagnostic tests performance are optimized, applying mathematical modelling strategies can aid in estimating more accurately diseases occurrence for surveillance purposes. In this study, we aimed to provide corrected estimates of the number of cases, hospitalizations in intensive care units (ICU) and deaths, among people that were tested for SARS-CoV-2 in Mexico between February 27th and October 31st 2020, by taking into account the probability of RT-PCR false negative tests results.
METHODS
Study setting
In Mexico, the first COVID-19 confirmed case was tested on February 27 and reported on February 28. Community transmission was declared on March 24 and country-wide mitigation measures were announced the same day. Social distancing was urged, and non-essential businesses and activities were suspended, initially until April 14. The testing strategy was also published that day. A case definition was developed, and testing was recommended for one in ten patients seeking care due to a mild case of an influenza-like illness in a limited number of health facilities previously established to monitor seasonal influenza, and for all of those requiring hospitalizations. Furthermore, a strong emphasis was done on voluntary isolation if mild symptoms developed, urging people with comorbidities and other high-risk conditions, such as older age, to search for healthcare. No accompanying contact-tracing measure was spoken of, placing most of the responsibility at the individual-level4.
Data sources and selection
We used the SARS-CoV-2 tests open datasets made public since April 12 by the Mexican government in their official coronavirus web page and updated daily12. The datasets include every test done at governmental, but not private, laboratories. It contains data on the state and municipality, where the sample was collected, socio-demographic information, date of symptom onset, date when the patient was registered in the database, intensive care unit (ICU) admission and death (if occurred), with non-traceable, individual key identifiers. Until October 7, cases were only identified with a positive RT-PCR test. After that date, the official count also included individuals who were not tested but had a convincing clinical picture and epidemiological contact, as well as deceased persons that were assigned the diagnosis by a specialized committee. A corresponding variable was thus included in the open databases. For this study, we considered only people with positive or negative tests. We assumed that the date on which the patient was registered in the database was the date of testing, and we will refer to it as such hereafter. We included in the analysis all tested individuals registered in the dataset between February 27 and October 31. Patients with a pending result, missing identification code, or more than 21 days with symptoms at the time of testing were excluded from the study.
We analyzed all information according to the date the test results were reported in the database, regardless of the date of sample collection, to follow the format of the daily report by the Ministry of Health (see Supplementary Material). This was not possible for individuals tested before April 12 and already had a result available, so these cases were included in the baseline count.
False-negaive estimation model
We used the method described by Kucirka et al. in their mathematical modeling study to calculate the false-negative rate of RT-PCR diagnostic tests8. They calculated the sensitivity from day 1 of infection (assuming symptoms started on day 5 of infection) until day 21 of infection. Since their estimates end at day 16 of symptoms, we replicated their analysis and estimated sensitivity up to day 21 of symptoms with 95% confidence limits. Sensitivity varied depending on the day after infection, being higher during the symptomatic phase and reaching a maximum of 81% at the 4th day of symptoms (Table 1 Supplementary Material). We used the mean estimate for the graphical representation but repeated the estimation with the upper and lower confidence limits. Specificity for every test used by the Mexican government is reportedly 100%8,13.
The contingency table we used as the basis for our analysis is shown in the Supplementary Material (Table 2 Supplementary Material). Given a 100% specificity, there are no false positive results, then b = 0, and all the positive results are true positives. From the dataset, we knew each day the number of true positives, a, and the number of negative tests, c+d. Our interest was to estimate the daily number of false negatives c. The probability of being false negative, p, is defined in the equation:
By reproducing Kucircas analysis, we calculated p and s(1-p, test sensitivity) for each day since reported symptom initiation8. At each calendar day, we split individuals in groups, each group corresponding to the number of days with symptoms when tested. For example, a day in which 100 individuals were tested, with 30 presenting on their 6th day and 70 on their 7th day with symptoms, two groups were created, each one with a test sensitivity (s) and the number of reported positive tests (a). Hence, we applied the equation to each group of every calendar day from February 27 to October 31 and added the false negatives calculated on every group. As the number of true COVID-19 cases is limited by the number of individuals tested, in case the estimation yielded a higher number of cases then the totality of persons tested was used instead.
We also estimated the corrected number of ICU admissions and the corrected number of deaths due to COVID-19 by calendar day. Assuming no difference in test precision among the spectrum of disease severity, we added the product of the proportion of negatives estimated to be false-negatives and the number of ICU admissions or deaths among COVID-negative patients. We applied the following equation to correct deaths and ICU admissions:
Estimated true COVID19 deaths =
Official COVID19 positive deaths +
(proportion of false negatives * official COVID19 negative deaths)
Thus, if in a given day, there were 100 deaths and 50 ICU admissions among COVID-19 negative patients, and the estimated false-negative proportion using the mean estimate of the test sensitivity was 0.40, we would add 40 deaths and 20 ICU admissions to the COVID-19 positive group for that particular date.
Statistical analysis
Applying results derived from the false-negative estimation model on the official government dataset, we estimated the daily corrected number of cases. We performed the analysis at a national level and for each one of the 31 states and the country capital (Ciudad de México, formerly known as Distrito Federal).
To determine whether positivity rates could be due to low testing per capita, we calculated Spearmanӳ Rho of positivity rates and the number of tests done per 10,000 inhabitants by state. State population was obtained from the National Institute of Statistics and Geography most recently published data14. We also calculated the 7-day moving average of time from symptom onset to testing for the entire study period to determine if this could explain higher false-negative rates during certain time periods.
All data analysis was performed with R software version 4.0.0. Code utilized is available at https://github.com/isaac-nunez/covid_19_fn_estimates_mexico, and all datasets are available at the official government COVID-19 webpage12.
The ethics committee of the Instituto Nacional de Ciencias Mꥩcas y Nutricialvador Zubir⮠reviewed and approved the study. There was no sponsor involved in any step of the study.
RESULTS
There were 2,091,373 people tested between February 27 and October 31 according to the latest official database (October 31). A detailed explanation of data selection is provided the Supplementary Material. We included 2,024,822 patients that had an available result, were tested within the first 21 days of symptoms onset, and had no missing ID code. Of them, 902,343 (44.6%) were SARS-CoV-2 positive and 1,122,479 (55.4%) were negative (Table 3 Supplementary Material).
Estimated false-negatives and corrected COVID-19 cases
We estimated a total of 1,248,583 (95% CL 1,094,850-1,578,818) positive cases, 38% higher than official reported cases (Fig. 1). In our corrected estimates, 100,000 cases were reached by May 25, 500,000 cases by July 21, and 1,000,000 by September 25. The official count reached the first two figures by June 3 and August 12, and did not reach a million cases by the end of the study period. By our estimations, accumulated test positivity rate surpassed 50% by April 24 and maintained itself above this threshold during almost all the study period. Positivity rate also varied according to state and date (Tables 4-36 Supplementary Material, Figs. 1-32 Supplementary Material). The states with the highest number of estimated cases were Ciudad de México (262,822), Estado de México (88,299), Guanajuato (63,175), Nuevo Le72,057), and Tabasco (49,631), while those with the highest estimated positivity rate were Oaxaca (89%), Veracruz (83.5%), Baja California (78%), Hidalgo (76%), and Guerrero (76%).
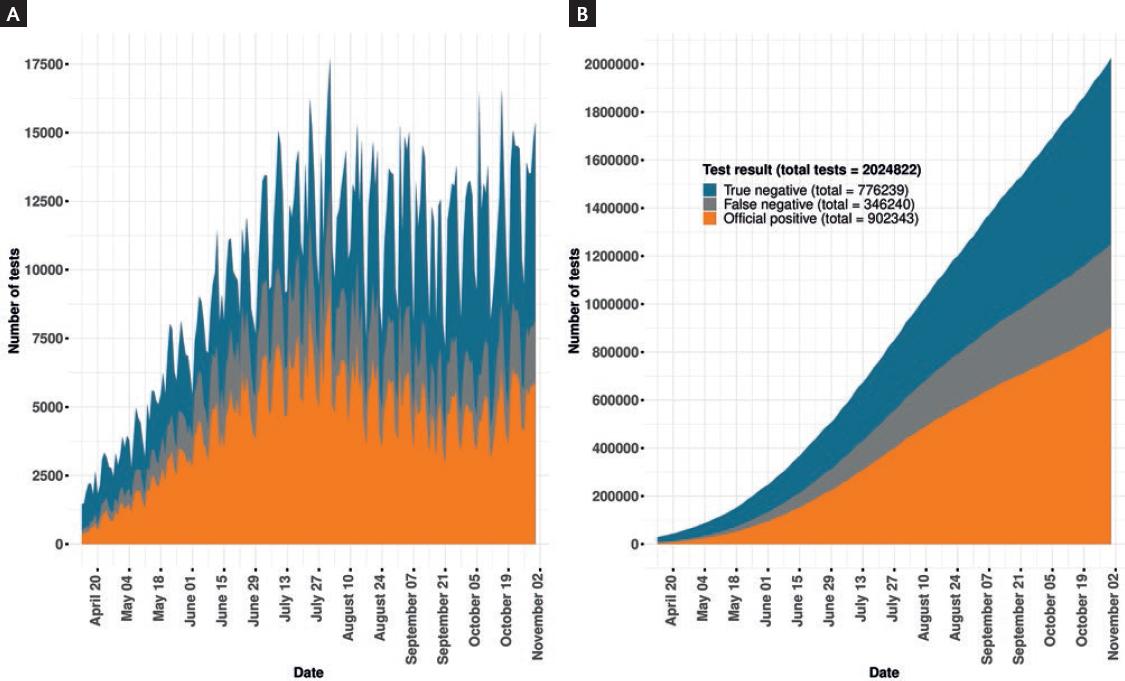
Figure 1 Estimated proportion of tested individuals with a false-negative result. (A) Represents new daily test results and (B) represents accumulated test results. Study period from February 27 to October 31, shown from April 13.
Spearmanӳ Rho for test positivity rate (taking false-negatives into account) and tests performed per 10,000 persons was of ְ.57 (ְ.55, ְ.56 with worst and best test, respectively), compared with ְ.64 using official positives. Time from symptom onset to testing increased over time (Fig. 33 Supplementary Material).
Corrected ICU hospitalization and deaths estimates
There were 17,353 ICU admissions and 88,842 deaths reported among COVID-19 positive patients during the study period (Table 3 Supplementary Material). Accounting for false-negatives, there were an estimated 19,975 ICU admissions (18,800-22,432) and 96,194 deaths (92,931-103,086) (Table 3 Supplementary Material). The magnitude of difference between official reports and corrected estimates varied between states (Tables 4-36 Supplementary Material).
DISCUSSION
In this analysis, we estimated the corrected number of COVID-19 cases, ICU admissions and deaths due to COVID-19 in Mexico accounting for false-negative test results using test sensitivities previously estimated by Kucirca et al. These were estimated based on the day after symptoms onset when patients were tested. We identified that the number of cases of COVID-19 in Mexico based on RT-PCR testing might be 39% higher than currently registered, with possibilities between 21% and 74% depending on the test sensitivity. These differences vary widely by state and period during the pandemic. Accordingly, the corrected number of ICU admissions and deaths increased around 15% and 8%, respectively, but this increase might be as high as 29% in ICU admissions and 16% in deaths. The magnitude of these differences may require important modifications in preparedness for response, which highlights the importance of accounting for the probability of false-negative tests in public health estimations.
The proportion of false-negatives was similar to that found in other studies15,16. There was high heterogeneity in positivity tests proportions, corrected estimates, and confirmed and corrected estimations of ICU hospitalizations and deaths across states. A modeling study conducted in the United States showed that disease burden varied greatly between counties, both in an optimistic and in a pessimistic scenario17. A recent seroepidemiological study conducted in Spain found considerable heterogeneity in seroprevalence between provinces, with >10% in the most heavily affected ones and <1% in the least18. These data are consistent not only with the occurrence of Ԭocal epidemicsԠrather than a nation-wide epidemic but also with the fragmented response in Mexico, with some regions faring better than others. On the last point, it may only reflect sound state-centered approaches, with resources being modified according to each stateӳ needs, though.
We also observed a negative correlation between test positivity and tests per 10,000 people. Considering that testing per capita is very low in the whole country, this is not surprising. States that have particularly low testing rates are Chiapas, Veracruz, Oaxaca, Morelos, and Chihuahua, with Veracruz and Oaxaca being also among those with the highest positivity rates. Low testing has already been indicted as one of the culprits of a high positivity rate, and one of the prime components of the WHO strategy involves escalating the amount of testing3,17. Interestingly, the time from symptom onset to testing did not appear to change considerably over time. This suggests that increasing positivity rates most likely do not derive from changes in time of testing after symptoms onset along time, but from high disease burden and insufficient testing worsening over time.
Considering that only a small proportion of symptomatic cases who seek healthcare are tested (not even considering asymptomatic individuals who have the virus), the true underestimation of COVID-19 cases can be huge18. Given this, the daily number of cases will most likely grow along with the number of tests. This means that with the current testing capacity it is not possible to grasp the behavior of the pandemic, as the number of tests is so small and the positivity rate so high that it would be fully dependent on them. Thus, even for strictly surveillance purposes, a major expansion in testing capacity is needed in Mexico. WHO recommends a positivity rate lower than 5%, among other criteria, to commence reopening, even if a sentinel system is being used. At present, Mexico is far from a safe reopening, and further still if we consider false-negatives19,20.
False-negatives are accounted for in clinical medicine when a clinician suspects it in a patient that has a negative test but other disease indicators, such as suggestive lung images, that generate a convincing clinical scenario, and acts accordingly21. As we show here, false-negatives should also be accounted for in public health estimations, and it is also possible to act accordingly. Places with a low prevalence, as in the states with low positivity rates (none in our case) or with massive testing strategies, will have a small number of cases added to their official counts. This contrasts with the picture of Mexico as a whole, where the worrisome positivity rate increases even more when false-negatives are considered22,23. At present, a reopening strategy based on a four-colored traffic light (red, orange, yellow, and green) is being implemented, which assigns each state a color based on several variables. Test positivity rate is among the criteria for changing the color. Nonetheless, by not considering false-negatives, the positivity rate is being underestimated, and it is likely this could influence the premature modification of the color, and thus premature reopening or delayed closing, which could cause a new surge in cases24-26. We observed a 1-week delay during the early pandemic in reaching a similar number of cases when mean false-negative test is not considered.
This approach as applied for Mexico has several limitations. Since only few symptomatic individuals are tested, we cannot estimate the corrected number of cases among the total population. This would require a vastly higher number of tests. Thus, there should be caution when interpreting our results. Our estimation presents a limited view of how many more cases there are, and therefore does not represent the actual number of cases in the country; in any case, our corrected estimates are in the conservative side13,27. We assumed that the date on which the information was captured in the system was the same on which the sample was obtained, but there might be a small time-lag between them.
We also identified limitations related to the diagnostic tests. For instance, there is a wide catalog of SARS-Cov-2 RT-PCR tests currently used in our country. Even if all of them have to be approved by the Institute of Diagnostics and Epidemiological Reference for surveillance purposes, and all must comply with the Berlin protocol, we do not know how they compare to each other, and variation in diagnostic accuracy probably exists28. We also do not have information on the anatomical test site, be it nasal or oropharyngeal swab, saliva, or bronchoscopy sample, which could affect test sensitivity. We do not account for severity of the clinical picture in the testӳ sensitivity. Sensitivity of the test in patients who develop pneumonia and/or critical illness could be higher than in those with less severe disease, and patients with severe disease are over represented in the testing strategy followed in Mexico. Even when considering all these limitations, the application of the testӳ performance to correct the number of cases could certainly improve surveillance. The method we used can be easily adapted to other countries or areas. Our analysis can be updated if COVID-19 open data continue to be published, and thus be used to better inform decision making at the national and state level.
SUPPLEMENTARY DATA
Supplementary data are available at Revista de Investigacilca online (www.clinicalandtranslationalinvestigation.com). These data are provided by the corresponding author and published online for the benefit of the reader. The contents of supplementary data are the sole responsibility of the authors.

