


 nova página do texto(beta)
 Inglês (pdf)
 Artigo em XML
 Referências do artigo
 Enviar este artigo por email
 Citado por SciELO
  Similares em
SciELO
Similares em
SciELO 
 Permalink
INTRODUCTION
The coronavirus disease 2019 (COVID-19) pandemic continues to spread, confronting healthcare professionals worldwide1. Hospital overloading and a scarcity of mechanical ventilators and intensive care unit beds are critical concerns. The ultimate diagnosis of COVID-19 relies on reverse-transcriptase real-time polymerase chain reaction (RT-PCR)2,3; however, the false-negative rate is high (39-61%)4.
Thin-section chest computed tomography (CT) has a high sensitivity for the diagnosis of COVID-195,6. Our institution follows the Fleischner Society Consensus7 and the European Society of Radiology8 guidelines, which recommend using CT imaging in various clinical scenarios, including patients presenting moderate-to-severe symptoms consistent with those of COVID-19. Several visual assessments using semiquantitative CT severity scores (CT-SS) with the degree of lung opacification have been proven significant in identifying patients with severe disease3.
The importance of radiological findings in COVID-19 patients has increased radiologists workload, who must interpret more images promptly to avoid delays in diagnosis9 and facilitate resource allocation. Fortunately, the rapid development of artificial intelligence (AI) in the field of radiology has improved diagnostic performance and shortened reading times10, with very high sensitivity and specificity11. For instance, Lin et al. used 4356 chest CT scans to develop a three-dimensional learning model (COVNet) to differentiate correctly COVID-19 from community-acquired pneumonia with a sensitivity and specificity of 90% and 96%, respectively12.
Some studies have described algorithms capable of identifying and quantifying abnormal tomographic patterns in non-contrast chest CT images of patients with COVID-199 with high sensitivity and specificity and excellent areas under the receiver operating characteristic (ROC) curve (area under the curve [AUC])12. These automated systems perform segmentation of the lungs, lobes, and compromised lung parenchyma in 3D. Some measure the percentage of opacity and high opacity and calculate a CT severity score. This technology has opened the door for AI to classify risk, monitor patients responses to treatment, and evaluate disease progression. However, few studies have compared the percentage and degree of lung opacification related to patient outcomes in selected populations.
This study aimed to analyze the classification performance of a chest CT AI quantitative algorithm in a cohort of hospitalized COVID-19 patients, establishing quick classification thresholds that could contribute to determine the mortality risk and the need for mechanical ventilation (MV). This study also constructed a prognostic multivariate logistic model testing CT AI measures and predetermined clinical and laboratory characteristics to validate this AI CT tool.
METHODS
The protocol of this observational retrospective study followed the Declaration of Helsinkis ethical requirements and was approved by the Institutional Review Board. Informed consent was waived because the institutions protocol had already acquired the images for these patients.
Data sources
Demographic, clinical, biochemical, and radiological data were obtained from electronic medical records of hospitalized COVID-19 patients from April 1-20, 2020, in a Tertiary Health Care Center of Mexico City.
The inclusion criteria were hospitalized adult (≥ 18 years old) patients with a positive RT-PCR for SARS-CoV 2 who had undergone non-contrast chest CT. Hospitalized patients with incomplete or unavailable CT images in the Picture Archiving and Communication System were excluded from the study. The patients demographic data included age, sex, and comorbidities and laboratory data included leukocyte count, creatinine, lactate dehydrogenase, ferritin, C-reactive protein, high-sensitivity troponin I, and D-dimer levels.
The primary outcome variables were as follows: patient requirement for MV (defined as patients with no improvement in respiratory distress with a non-rebreathing mask with high flow [10-15 L/min], a respiratory rate higher than 30/min, PaO2 < 60 mm Hg, and PaO2/FiO2 [obtained from noninvasive respiratory support] < 150 with respiratory distress, or any patient with PaO2/FiO2 < 100), and all-cause mortality during hospitalization.
Chest CT scan and quantitative analysis
All chest CT scans were performed using a 64-detector CT scanner (Revolution EVO, General Electric) with the following parameters: 120 kV, 350 mAs, rotation time 0.4 s, pitch 1.5, and intersection space 5 mm. Furthermore, reconstructions using a 1.5-mm slice thickness and sharp convolution kernel were performed. All CT scans were performed with the patient in a supine position. The field of view included the whole chest (from the lung apex to the suprarenal glands) and was obtained during forced inspiration. The entire dataset was anonymized and exported in Digital Imaging and Communication on Medicine format for segmentation and quantification. Using CT pneumonia analysis prototype software (Siemens Healthcare version 30, Erlangen, Germany), an AI algorithm based on three-dimensional segmentation automatically detected and quantified abnormal tomographic patterns (ground-glass opacities and consolidations) in each and both lung parenchyma based on deep learning and deep reinforcement learning. This AI algorithm was previously trained in controls and a large group of patients with diseases (average report time of 1-3 min per chest CT examination).
CT-SS, volume and percentage of opacity, and volume and percentage of high opacity were automatically processed by the AI software (Fig. 1). All post-processing results were reviewed, manually corrected, and approved by a general radiologist with more than 10-years experience. CT-SS is calculated by dividing the lung parenchyma into five anatomical lobes and assigning scores (0-20) based on the percentage of opacity within the lobes (0, 1, 2, 3, and 4 if parenchymal opacification was 0, < 25%, < 50%, < 75%, and ≥ 75%, respectively). Volumes of opacity and high opacity were calculated based on Hounsfield units (HU; areas with mean densities higher than −700 HU and −200, respectively)13, and percentages were calculated dividing the compromised volume by the total measured pulmonary volume.
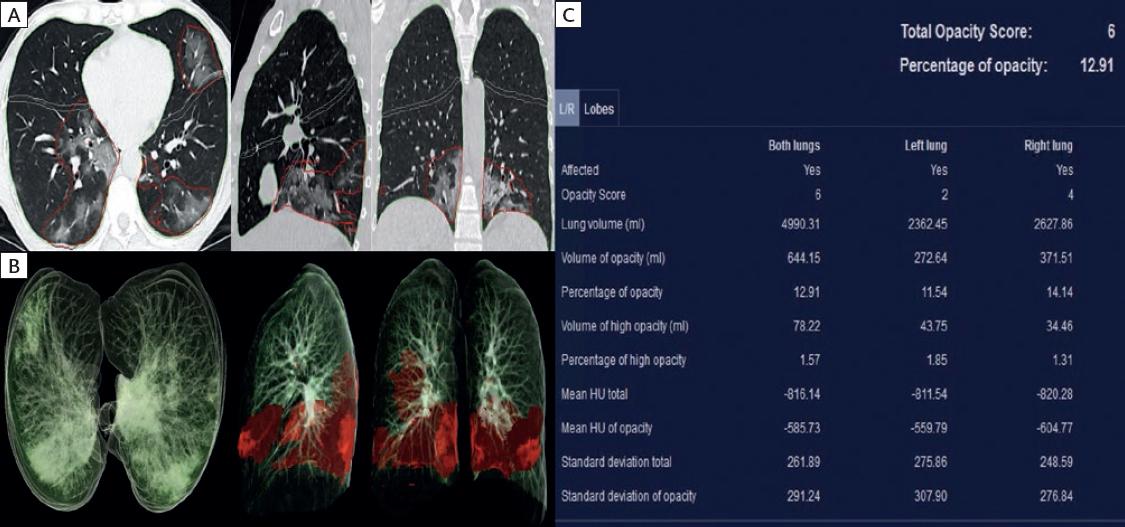
Figure 1 Quantitative lung computed tomography (CT) analysis. (A) Non-contrast chest CT images in the axial, sagittal, and coronal planes show automatic lung segmentation and bilateral ground-glass detection by AI software. (B) AI software volume-rendered images highlight compromised lung areas (mean attenuation > −700 Hounsfield units). (C) Overall total opacity score, total percentage of opacity, and other CT variables are shown in the results table.
Statistical analysis
Continuous variables were expressed as means and standard deviations or medians with interquartile ranges, and categorical variables were expressed as percentages and absolute frequencies. Subsequently, we performed bivariate logistic correlation (each independent variable vs. the outcomes reporting crude odds ratio [ORc]) to establish the significance as a prerequisite for inclusion in the multivariate model.
We tested the diagnostic yield of the relevant variables obtained from CT images (CT-SS, the total volume of opacity and high opacity, and percentage of opacity and high opacity) using a ROC-based analysis, with their AUC and 95% confidence intervals (CI). Optimal thresholds were obtained using the Youden Index (J) to describe the sensitivity, specificity, positive predictive value, negative predictive value, positive likelihood ratio, and negative likelihood ratio. All hypothesis tests considered a significant two-tailed p < 0.05.
We performed a multivariate analysis with logistic regression to identify the predictive model for each outcome (meeting criteria for MV and mortality) based on CT variables, including predetermined significant correlated clinical and laboratory variables (age, diabetes, hypertension, leukocyte count, and C-reactive protein, ferritin, D-dimer, high-sensitivity troponin I, and lactate dehydrogenase levels) that were previously reported in original research in an identical population. The final parameter reported was the adjusted risk ratio: ORa14. HosmerLemeshow tests were performed to test for the goodness of fit of the logistic regression models (calibration), with overall (Brier score) and discrimination (C score) statistics. The analysis was performed on STATA SE version 14.1 software and SPSS software package version 20.
RESULTS
Demographic and clinical variables
The median age of the 166 patients who met the inclusion criteria was 50 ± 14 years and 60.2% were men. The outcomes, all-cause mortality and meeting criteria for MV, were observed in 21.08% and 30.72% of patients, respectively. Patients demographic data are presented in table 1.
Table 1 Patients demographic data* (n = 166)
| Variables | Result |
|---|---|
| Age, years mean (SD) | 50 (14) |
| Male (%) | 100 (60.2) |
| Patient meeting criteria for MV (%) | 51 (30.72) |
| Patient with access to MV** (%) | 49 (29.52) |
| Global mortality (%) | 35 (21.08) |
| Length of stay, days mean (SD) | 10 (8.6) |
| Comorbidities (%) | |
| Diabetes | 44 (26.51) |
| Hypertension | 39 (23.49) |
| COPD | 1 (0.60) |
| Smoker | 5 (3.01) |
| Asthma | 2 (1.20) |
| Obesity | 28 (16.87) |
| Immunosuppression | 4 (2.41) |
| Cardiovascular disease | 2 (1.20) |
| Cancer | 2 (1.20) |
| Organ transplant | 6 (3.61) |
| Laboratory data | |
| Leukocytes cells/mm3 mean (SD) | 8.5 (6.8) |
| Creatinine, mg/dL mean (SD) | 0.95 (0.36) |
| Lactate dehydrogenase, UI/dL mean (SD) | 375 (142.3) |
| Ferritin, mg/dL median (IQR) | 627 (577.4) |
| CRP, mg/dL median (IQR) | 12.86 (5.49-19.28) |
| Troponin I, ng/dL median (IQR) | 4.95 (3.3-9.4) |
| D-Dimer, ng/dL median (IQR) | 584 (401-1018) |
SD: standard deviation; MV: mechanical ventilation; COPD: chronic pulmonary obstructive pulmonary disease; CRP: C reactive protein; IQR: interquartile range.
*Data presented as n (%) unless specified.
**Patients without access to MV due to limited resources were not included.
Optimal thresholds of CT variables for the classification of mortality and MV requirement
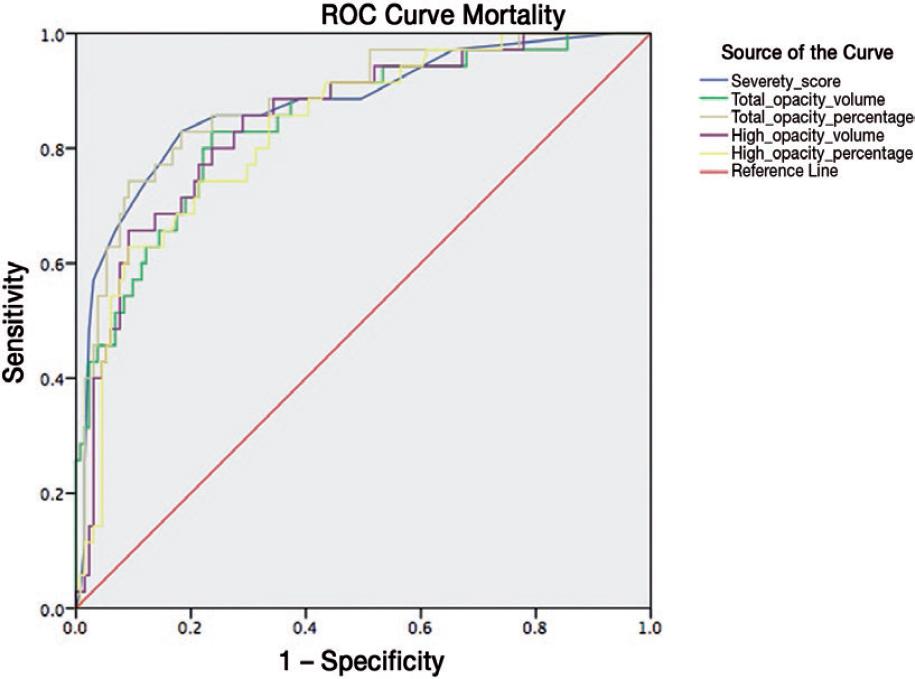
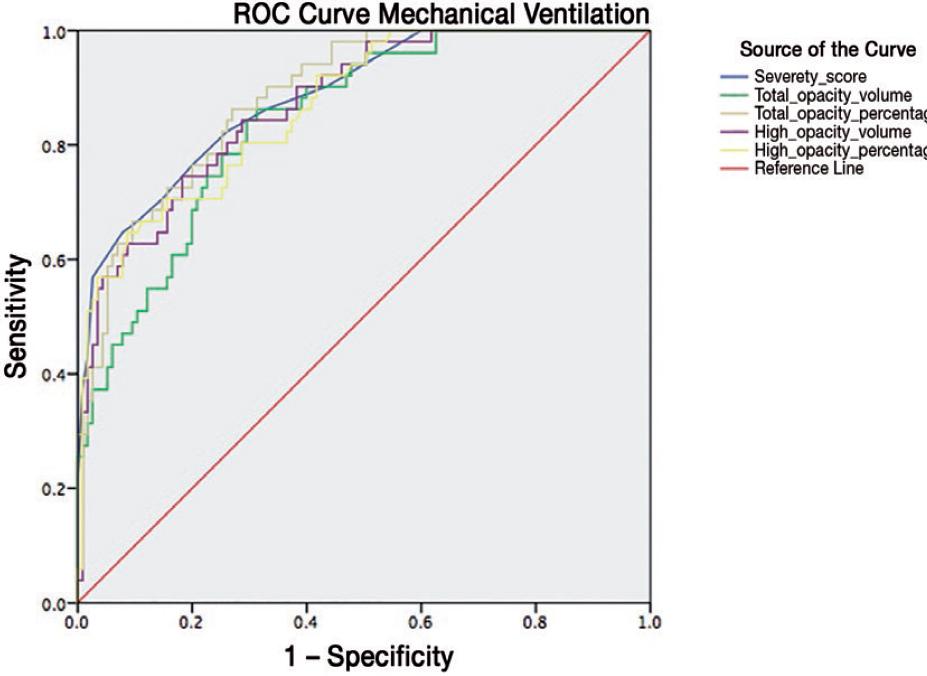
The highest diagnostic yield of CT variables for the outcomes of interest was the percentage of total opacity with AUCmortality (threshold > 51%) = 0.88 (95% CI, 0.810.94) and AUCMV (threshold > 25%) = 0.88 (95% CI, 0.830.93), with sensitivity, specificity, and negative predictive values of 74%, 91%, and 93%, respectively, for mortality and 86%, 73%, and 92%, respectively, for meeting MV criteria. For CT-SS, AUCmortality (threshold > 10.5) = 0.87 (95% CI, 0.800.94), with sensitivity, specificity, and negative predictive values of 83%, 82%, and 94%, respectively, and AUCMV (threshold > 12.5) = 0.88 (95% CI, 0.830.93), with sensitivity, specificity, and negative predictive values of 65%, 92%, and 85%, respectively. Data for the remaining CT variables and outcomes of interest are detailed in table 2. Figs. 2 and 3 show the ROC curves for mortality and MV requirement.
Table 2 Diagnostic performance of CT AI calculated variables for COVID-19 pneumonia
| Outcome | Variable | AUC (95% CI) | Threshold | Youden index | SEN | SPE | PPV | NPV | LR+ | LR− |
|---|---|---|---|---|---|---|---|---|---|---|
| Mechanical ventilation criteria | Severity score | 0.884 (0.83-0.937) | > 12.5 | 0.56 | 65 | 92 | 78 | 85 | 8.26 | 0.38 |
| Total opacity volume | 0.843 (0.783-0.903) | > 793 ml | 0.55 | 86 | 69 | 55 | 91 | 2.75 | 0.19 | |
| % total opacity | 0.886 (0.837-0.936) | > 25% | 0.593 | 86 | 73 | 58 | 92 | 3.2 | 0.18 | |
| High opacity volume | 0.87 (0.814-0.926) | > 190 ml | 0.56 | 75 | 82 | 64 | 87 | 4.08 | 0.31 | |
| % high opacity | 0.866 (0.809-0.923) | > 8% | 0.56 | 65 | 91 | 76 | 85 | 7.44 | 0.38 | |
| Mortality | Severity score | 0.876 (0.805-0.947) | > 10.5 | 0.64 | 83 | 82 | 54 | 94 | 4.52 | 0.2 |
| Total opacity volume | 0.847 (0.773-0.922) | > 1158 ml | 0.59 | 83 | 76 | 48 | 94 | 3.5 | 0.22 | |
| % total opacity | 0.881 (0.816-0.947) | > 51% | 0.65 | 74 | 91 | 68 | 93 | 8.1 | 0.28 | |
| High opacity volume | 0.848 (0.77-0.92) | > 165 ml | 0.56 | 86 | 71 | 44 | 94 | 2.95 | 0.2 | |
| % high opacity | 0.834 (0.762-0.907) | > 9% | 0.53 | 63 | 91 | 64 | 90 | 6.86 | 0.4 |
AI: artificial intelligence; AUC: semiquantitative (area under the ROC curve); SEN: sensitivity; SPE: specificity; PPV: positive predictive value; NPV: negative predictive value; LR: likelihood ratio.
Predictive logistic models for mortality and MV requirement
In the first approximation, we calculated ORc as part of the previous bivariate analysis for model construction and found statistical significance in the correlation of CT variables with mortality and MV requirement (Table S1). Conversely, there were clinical and laboratory variables that were not significantly correlated with mortality (diabetes [p = 0.24], hypertension [p = 0.09], leukocyte count [p = 0.18], ferritin [p = 0.09], and D-dimer [p = 0.096]) or MV requirement (age [p = 0.23], diabetes [p = 0.34], hypertension [p = 0.43], leukocyte count [p = 0.21], ferritin [p = 0.11], and D-dimer [p = 0.099]). Hence, we excluded these variables from the predictive model.
In the first multivariate logistic analysis (Enter Method), which included clinical characteristics (age, lactate dehydrogenase, C-reactive protein, and troponin I) and the CT values, the adjusted OR (ORa) lost significance, except for CT-SS (p = 0.007) and troponin I (p = 0.017) for MV requirement, and the percentage of total opacity (p = 0.02) and lactate dehydrogenase (p = 0.034) for mortality. A second model for mortality showed a lack of goodness of fit (p = 0.05); thus, we transformed the percentage of total opacity into a dichotomic variable based on the threshold obtained using the Youden test (>51%), achieving goodness of fit with a slightly better R2 (0.368 vs. 0.386). Table S2 details the proposed prognostic model and predicting equations for meeting the MV criteria, and table S3 presents the same for mortality.
DISCUSSION
Quantitative AI analysis of CT images has been used in prior investigations that explored diverse lung parenchyma pathologies, proving that AI is a suitable tool for supplementing conventional visual assessment15. The advantages of quantitative CT AI software under radiologist supervision include a significant reduction in interpretation time, fast learning curve, and increased objectivity of the quantitative severity assessment of the affected lung parenchyma which decreases the variability between readers. At present, CT AI software has been tested in research and academic centers under radiologic surveillance with encouraging results. It represents a promising tool for implementation in the clinical field.
This report is one of the first cohort studies to investigate the association between mortality and MV requirement with AI thoracic CT measures in a Hispanic (Mexican) population. CT-SS and the percentage of total opacity had the strongest diagnostic accuracy estimators, robust enough to maintain a significant association in the logistic models multivariate adjustment, including the predetermined clinical and laboratory parameters. Thresholds higher than 51% for the percentage of total opacity and >10.5 points in the CT-SS had the highest AUC (88% and 87%, respectively), with the former having a specificity of 91%. Similarly, a threshold of >25% had a negative likelihood ratio of 0.18. This CT AI measure could integrate prognostic tools with laboratory and clinical variables to determine the risks of mortality and MV requirement in hospitalized COVID-19 patients in the present cohort. The predictive values might have been affected by the high mortality in our patients; however, the prevalence was similar to those stated in other reports16.
Recently, Lessmann et al. developed an AI system that accurately identified COVID-19 patients with high diagnostic performance and assigned SS in good agreement with the experienced radiologist17. Lanza et al. also used computer-aided quantitative analysis of CT images to determine compromised lung volumes and predict the need for oxygenation support and intubation18. They found that patients with compromised lung volumes of > 23% were at risk for intubation. Similarly, in our study, we obtained a threshold of 25% for patients meeting intubation criteria.
Our logistic regression models for meeting MV criteria and mortality, combining the significant biochemical and tomographic variables, had two significant variables each. Most of the CT variables adjusted ORs lost significance, as shown by the strong correlation detected. Notably, prognostic (clinical and biochemical) surrogates have shown significant heterogeneity among reports of different COVID-19 populations, showing mixed significance and effects, which is expected in such a new entity19.
Nevertheless, our models could distinguish patients requirements for MV and risk of mortality with an acceptable R2. The overall performance, discrimination, and calibration statistics were favorable for both models and could be used by clinicians for decision-making during hospitalization to predict high-risk patients.
LDH is a widely available, affordable, and rapidly measured biochemical marker that has been associated with severe pneumonia and mortality. Ortiz-Brizuela et al. found that lactate dehydrogenase was significantly higher in patients admitted to the ICU14. Dong et al. found a high accuracy for predicting mortality in critically ill patients20 with a 353 U/L threshold and a hazard ratio of 5.98. Similarly, in a pooled analysis including 1,532 COVID-19 patients, elevated lactate dehydrogenase levels had a 6- and 16-fold increase in odds for severe disease and mortality, respectively21. In addition, it has also been evaluated as a potential marker to assess treatment response; increased and decreased levels correlate with radiographic progress or improvement22.
Likewise, troponin I is an efficacious, inexpensive, and rapidly measured cardiac injury biomarker. Several studies have identified it as an independent risk factor for the need for mechanical intubation, severe disease, and transfer to the ICU23-25. Shah et al. reported OR of 5.18 and 4.95 for MV and admission to the ICU, respectively24. In a New York cohort of 2736 hospitalized COVID-19 patients, 36% had elevated troponin I within 24 h of admission. Patients with levels higher than 0.09 ng/mL had a significant mortality risk (adjusted Hazard ratio 3.03)25.
In another study that evaluated AI CT software, Zhang et al. proposed a prognostic model for a Chinese population-based on radiographic and biochemical criteria to predict mortality, the clinical need for MV, or the need to be transferred to the ICU, with an AUC of 0.847 for imaging features alone, and 0.909 combined with clinical data26. Francone et al. also found that CT AI scores were positively correlated with inflammatory biomarkers and associated higher scores with mortality27. In conjunction with our findings, these studies support the use of AI to classify risk, monitor patients response to treatment, and evaluate disease progression in COVID-19, thereby opening a door for AI to improve resource allocation.
This study has several limitations. This research used a retrospective design. All included patients were from a single tertiary referral center, and only hospitalized patients were enrolled. We analyzed only reconstructions with a slice thickness of 1.5 mm; thinner reconstructions may have a higher diagnostic yield, as the software company recommends. Aside from improving the interobserver agreement mentioned before, AIs performance requires specialized software and has been tested by trained radiologists so far, which might not be widely available.
Further multicenter studies with larger cohorts are encouraged to establish new scenarios for evaluating and externally validating risk prediction performance in similar hospitalized populations. Other quantitative variables obtained by AI may be studied for their clinical implications as a tool in the patient follow-up, quantifying the diseases possible sequelae. AI can be beneficial in different scenarios throughout the evolution of this pandemic and validation of the information obtained through this tool in our daily practice is imperative.
In conclusion, CT-SS and total opacity percentage had good diagnostic utility for mortality and MV requirement. The proposed prognostic models using variables measured by the AI software in chest CT (severity score for meeting MV criteria and percentage of total opacity >51% for mortality) and predetermined laboratory elements (troponin I for MV and lactate dehydrogenase for mortality) had good risk classification performance in hospitalized COVID-19 patients, strengthening the evidence for the use of this tool as part of the triage process in the CT analysis of COVID-19 patients.
SUPPLEMENTARY DATA
Supplementary data are available at Revista de Investigación Clínica online (www.clinicalandtranslationalinvestigation.com). These data are provided by the corresponding author and published online for the benefit of the reader. The contents of supplementary data are the sole responsibility of the authors.

