


 text new page (beta)
 English (pdf)
 Article in xml format
 Article references
 Send this article by e-mail
 Cited by SciELO
  Similars in
SciELO
Similars in
SciELO 
 Permalink
INTRODUCTION
On December 31, 2019, China reported to the country’s office of the World Health Organization (WHO) an outbreak of cases of pneumonia of unknown etiology. From December 31, 2020, to January 3, 2020, 44 cases of pneumonia of unknown origin in Wuhan city, Hubei Province, were reported to the WHO. On January 7, the Chinese authorities announced that these cases were caused by a new coronavirus (nCoV-2019), now called SARS-CoV-21. Phylogenetic analyses were immediately performed showing that the new coronavirus is related to the SARS coronavirus which emerged in Guangdong, China, in 2002 and with the MERS-CoV that emerged in Saudi Arabia in 20132,3. On January 30, the new coronavirus was declared the sixth Public Health Emergency of International Concern according to the guidelines of the International Health Regulations3. Until March 3, the WHO reported 90,869 cases confirmed globally and 3112 deaths, from which 80,304 confirmed cases and 2946 deaths were reported by China, while 10,565 confirmed cases and 166 deaths were notified in 72 countries4. According to the experience of the influenza pandemic due to influenza virus A (H1N1) in Mexico in 2009, it is cardinal to estimate the arrival time of the outbreak and spreading of SARS-CoV-2 in our country, to strengthen the activities according to the Health Emergency Preparedness and Response Plan for the current SARS-CoV-2 epidemic that is evolving, and from which new information is generated each day. For this reason, new methods and techniques have been developed to qualitatively understand this type of phenomenon.
METHODS
In 1927, doctors Kermack and McKendrick developed a mathematical model to study the Spanish Influenza pandemic of 19215. This model, with some modifications, was used for forecasts and analyses of the 2009 influenza outbreak in Mexico City6. This same model, supplemented with classical diffusion (which in the context of an epidemic is managed as a dispersion of the infection), has been quite useful in studies of the spread of some infections, for example, rabies7. In this work, we developed a new method to analyze the dissemination of a novel virus, such as SARS-CoV-2, between different cities by airline routes for the purpose of estimating the arrival of the pathogen from one city to another. Our method uses the Kermack and McKendrick model to simulate the way the outbreak grows and evolves when it arrives in the different cities, and we also use classical diffusion on a graph to model the way the infection travels between cities by the airline routes8. We used this deterministic model with classical diffusion and not a more general stochastic one because the latter models usually contain a much greater number of parameters, which are very difficult to measure for a new infection. Classical diffusion can be interpreted as a Brownian motion model, so it includes the main characteristics of a symmetric random process. The purpose of using a simple model for our analysis is to have the least number of parameters, but with enough precision to be able to give an estimate of the date of arrival of the outbreak, for instance, to Mexico City. By this date, it is well established that infection by this type of coronavirus is transmitted from person to person through droplets expelled by an infected individual when coughing or sneezing; it is also transmitted through contact with surfaces or objects contaminated with the virus and then touching the mouth, eyes, or nose9. There is evidence that once the infectious outbreak has started, there is some homogeneity in its development in the affected city for these influenza-like infections. For these reasons, the Kermack and McKendrick model is applicable in the cities that we use as nodes of the graph, in which the edges represent the flights between one city and another.
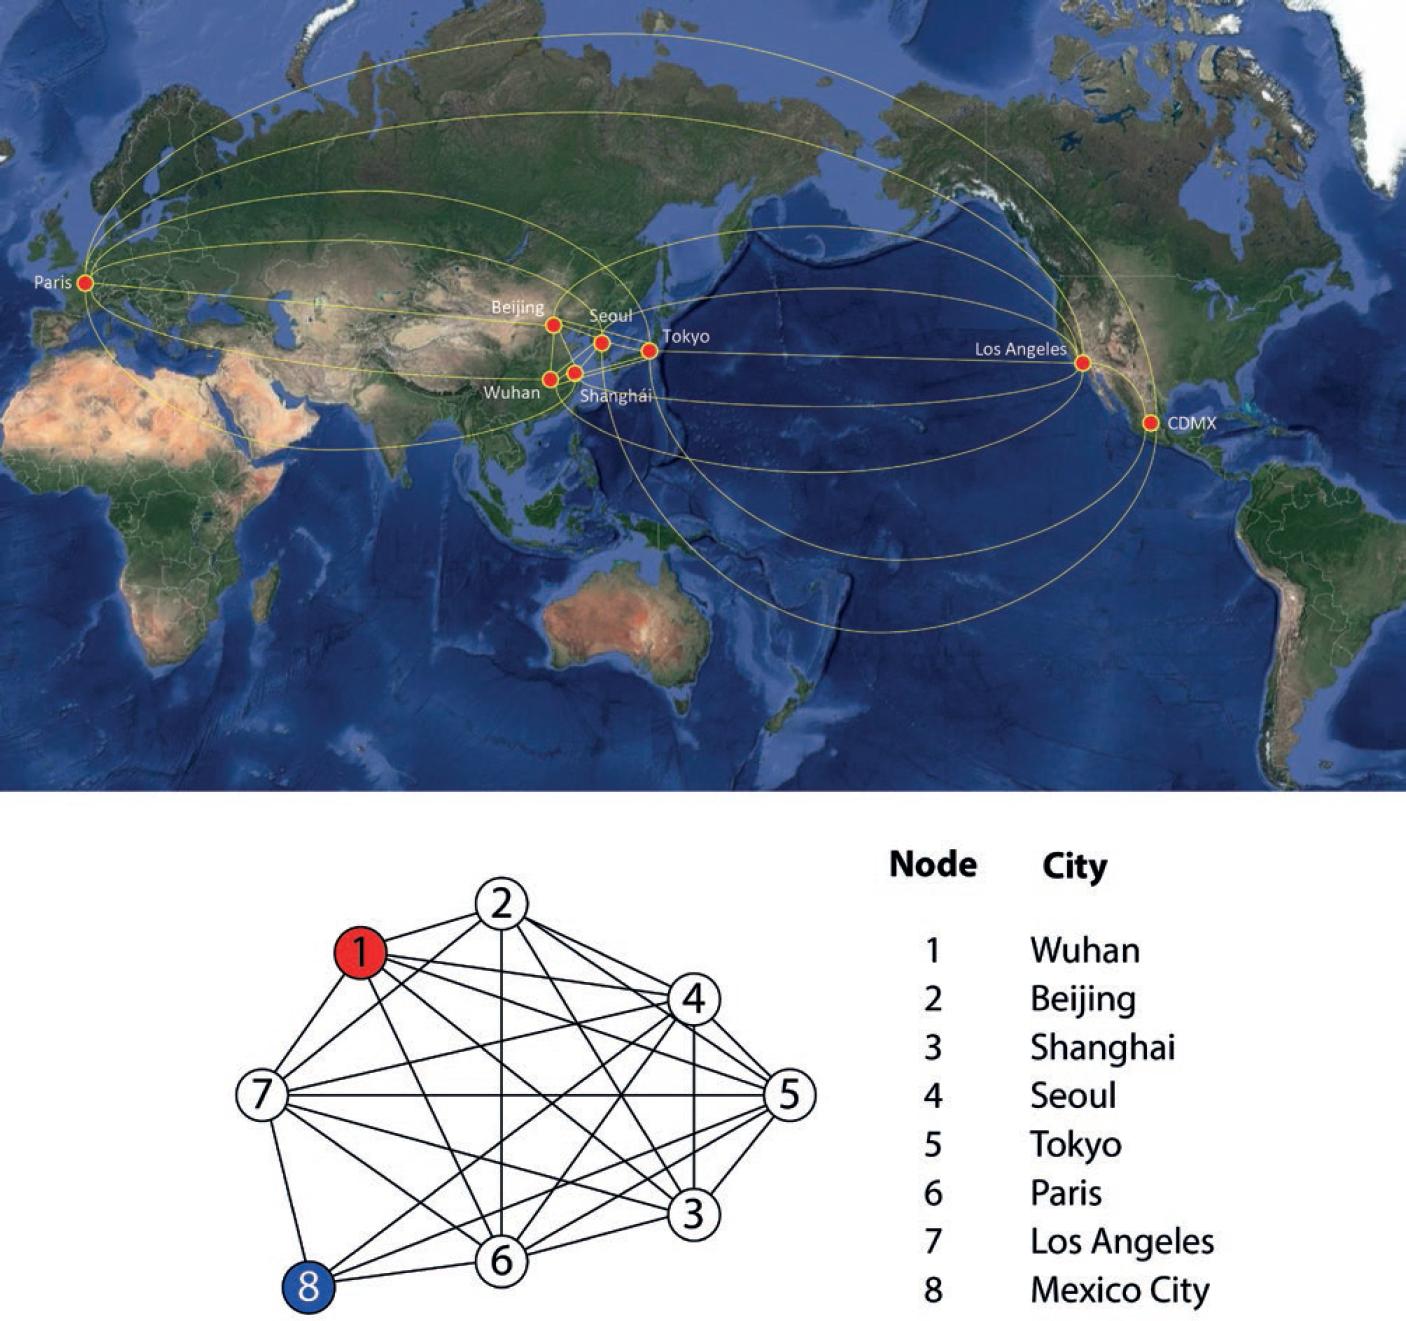
The basic reproductive number was estimated using the data reported for Hubei and Guangdong10. An adjustment was made to the data at the beginning of the outbreak to estimate the force of infection λ, which is related to the basic reproductive number as follows: R0 = 1 + λ/β. The setting of λ for Hubei and for Guangdong gives β = 0.3. One over β is a measure of the average time an infected individual is infectious. Its value from reference11 was adjusted to β = 0.2 for a better fitting of the model to Wuhan’s data. These estimates give an R0 = 2.5, which is in very good agreement with the estimate of Wun11 of R0 = 2.53 and is well into the interval of the estimations reported by read12. The diffusion coefficient D was estimated by adjusting with numerical simulations. The solutions of our model to match the outbreak started in Singapore around February 15, 2020, when they registered 75 infected cases. This is an inverse method of adjusting coefficients to a differential equation; the best fit was with a diffusion coefficient D = 10−6. In Figure 1, the nodes of the graph represent cities that were chosen because their airports function as important distribution points to other airports. In the model, some of these nodes also function as a representation of other airports in the region. For example, the Paris node represents the main international airports of that European region: Paris, Amsterdam, and Frankfurt. Using this graph and the estimated epidemiological parameters, the model was solved numerically to study in several scenarios the time of arrival of the infection in Mexico City.
RESULTS
Using the parameters estimated, the model was solved numerically, using the routine Runge–Kutta 9 methods with the software package Wolfram Mathematica 12, to study in several scenarios the arrival of the outbreak in Mexico City. All our simulations have initial conditions in which only node 1 corresponding to the city of Wuhan has been infected, and the other cities are not yet infected or represent a very small number with respect to their populations. In the city of Wuhan, an infected number of 20 is assumed12 and January 10, 2020, was taken as the initial date for this analysis and as the starting point of the numerical simulations. The result is shown in Figure 2, where the vertical axis is the proportion of infected persons among the whole population of the city in question. The peak of the first outbreak in red corresponding to Wuhan is reached around February 24, 2020. The curves corresponding to the simulations of nodes 2-7 are identical, so they are one above the other and only the violet curve of node 7 is seen. This is because the corresponding graph is all interconnected (they form what is called a complete graph); if one excludes node 8, the remaining graph does not distinguish one node from the others. This numerical simulation also indicates that the maximum of the first curve reaches 0.23, which means that, at the maximum point of the graph, 23% of the urban area of Wuhan was infected. Data from Johns Hopkins University showed that the number of reported cases was peaking at approximately 63,000. The urban area of Wuhan comprises around 20 million inhabitants (this is the population served by Wuhan airport); therefore, 23% correspond to 4,600,000, which indicates that for each case reported, there are about 73 individuals infected in the city. In this scenario, the infectious outbreak of node 8 (peak in green), corresponding to Mexico City, begins its growth between t = 70 and t = 80, which gives an estimate of the arrival of the outbreak in Mexico between March 20 and March 30 (blue vertical line). This information was made available to the Mexican Ministry of Health on February 24, 2020.

Figure 2 The curves in colors show a numerical simulation of the time evolution of an infectious outbreak that begins at node 1, Wuhan – red curve. After peaking at node 1, it spreads to nodes 2-7 – violet curve. Finally, it arrives to node 8, Mexico City – green curve. The curves in black show a simulation in which the R0 has been changed as follows: R0 = 2.1 (black in dashed line) and 1.9 (black). In both cases, the corresponding peaks at node 8 only slightly lagging behind.
To simulate the isolation measures imposed on Wuhan since the end of January, numerical simulations were performed lowering the value of R0 from 2.5 to 2.1 first and then to 1.9; this is shown in Figure 2 by the black dashed curve for R0= 2.1 and by the black curve for R0= 1.9. As it can be seen, this does not affect the height and width of the rest of the peaks and only delays the arrival of the rest of the nodes, including node 8 corresponding to Mexico City, by around 4 days. This shows that not so small changes in R0 do not substantially alter the result of the arrival of the outbreak at node 8. Simulations with R0 = 3, when adjusted to match the outbreak in Wuhan, only anticipated the outbreak in Mexico City by 4 days. We performed other numerical simulations changing the R0 in other nodes of the graph around 10% of its value; this changed the outbreaks at these nodes, but it did not change significantly the date of the outbreak arrival in Mexico City. Changes on the graph structure cutting some edges, meaning canceling some airline routes, did not modify importantly the date of arrival of the outbreak to the last node. Even cutting all the edges connecting to node 8 except one, only delayed the arrival of the outbreak in Mexico City around 6 days. Reducing the coefficient D had a larger impact on the delay of the outbreak: reducing D by one order of magnitude, from 10−0 6 to 10−0 7, delayed the arrival of the outbreak to node 8 around 2 weeks.
Figure 2 also shows an important observation: the time, at which the first node reaches the maximum moves forward as the R0 decreases, indicating that the isolation measures carried out in Wuhan only decreased the R0 by 5-tenths. This is because, according to the data presented by Johns Hopkins University, the report of cases begins to stabilize approximately on February 28; therefore, the maximum is expected to be reached close to this date.
DISCUSSION
This model estimates the arrival of the SARS-CoV-2 infectious outbreak in Mexico between March 20 and March 30. This estimation allows for a time window to implement and strengthen preventive measures aimed at the general population, as well as to strengthen hospital infrastructure and training of human resources. However, this period should be considered as an estimate of the maximum time of arrival of the outbreak in Mexico City, since the infection can arrive by other routes, such as sea or land through any of our borders.
This model shows that the isolation measures that can be implemented in the cities where the outbreak first arrives are very important for local control, but do not affect significantly the time of arrival in other cities. The coefficient that best controls the spread of infection for the rest of the cities, when this dispersion is by air travel, is the parameter D. Therefore, surveillance at airports should be strengthened, with special emphasis on those connecting Mexico, directly or indirectly, with Asian countries. Finally, this model shows that all of these measures can only delay the arrival of SARS-CoV-2. However, if it could be delayed long enough, it would be very important to have as much time as possible to establish the appropriate prevention and control measures allowing for better management of the outbreak.
With reports of infected individuals registered by the Mexican Ministry of Health in the urban area of Mexico City up to April 6, clearly, the outbreak has begun in this region. The number of infected persons grows monotonically and at an accelerated rate, matching well an exponential fitting since around March 27, 2020. This is the first outbreak of COVID-19 in Mexico.

