


 text new page (beta)
 English (pdf)
 Article in xml format
 Article references
 Send this article by e-mail
 Cited by SciELO
  Similars in
SciELO
Similars in
SciELO 
 Permalink
INTRODUCTION
Kidney dysfunction is a risk factor for morbidity and mortality in patients with liver cirrhosis (LC)1. The importance of kidney function in the prognosis of patients with LC was established with its inclusion in the model for end-stage liver disease (MELD), which is currently utilized to determine the inclusion and prioritization of patients on a transplantation waiting list2.
Kidney function in the patient with LC is difficult to establish, given that the glomerular filtration rate (GFR) is largely estimated with the use of formulas based on serum creatinine (SCr). Those formulas overestimate kidney function because the LC population has a high frequency of low creatinine levels due to conditions that do not depend on kidney function, such as malnutrition, edema (hemodilution), muscle atrophy, hyperbilirubinemia, and protein-restrictive diets3,4. Several studies have evaluated formulas based on cystatin C for estimating the GFR in patients with LC. The advantages of using cystatin C, a non-glycosylated protein produced in all nucleated cells, lies in the fact that it has a better theoretic profile than creatinine because it is not significantly modified by factors such as poor muscle mass, malnutrition, or hyperbilirubinemia. Its performance, when compared with creatinine-based estimates, has been better and more accurate in different populations. Although the cystatin C-based formulas have shown a superior performance and accuracy than the SCr-based formulas in the LC population, their performance has been poor in subjects with kidney function < 45 ml/min/1.73 m2.3-5 Other groups have evaluated formulas that use both biomarkers (SCr and cystatin C), finding their results to be better than those of the formulas based only on creatinine or on cystatin C. However, performance in subjects with LC and a measurement of GFR (mGFR) < 60 ml/min was poor, agreeing with previously reported results6,7.
Recently, a group of researchers at the Royal Free Hospital (RFH) in England developed and validated a new formula for estimating GFR in patients with cirrhosis of the liver8, which was also validated by a group from Denmark9. The novelty of this formula lies in that, apart from being created in a population with LC, it includes the variables of ascites, INR, and serum sodium, in addition to those of creatinine, age, and sex. Its results showed good performance, higher accuracy, and less bias, compared with other estimation formulas based on creatinine and/or cystatin C.
Due to the scarcity of methods for estimating kidney function in subjects with LC, the aim of this study was to conduct an external validation of the RFH formula in a cohort of Hispanic patients with LC and compare its performance with formulas based on creatinine and cystatin C.
METHODS
Patients
The study is a retrospective and cross-sectional analysis that includes a cohort of Hispanic subjects with LC who participated in a previous study, conducted at an academic medical center in Mexico City4. The study was designed in compliance with the Declaration of Helsinki and submitted to and approved by the Ethics Committee of the Instituto Nacional de Ciencias Médicas y Nutrición Salvador Zubirán, in Mexico City. All the patients signed written statements of informed consent. The inclusion criteria were: (1) age above 18 years; (2) diagnosis of LC made by a hepatologist and according to biochemical, endoscopic, imaging, and histologic assessment; (3) stable SCr (values maintained with a variation under 0.3 mg/dl over a 3-month period); and (4) subjects should have had the required measurements for estimating GFR with the new formula. The exclusion criteria were: pregnancy, hyperthyroidism, active hepatocellular carcinoma, end-stage renal disease or dialysis, inability to adequately measure glomerular filtration due to technical problems, and lack of informed consent.
Of the 90 patients in the original cohort recruited between January 2013 and July 2014, we included 76 patients from whom a frozen serum sample was available to determine serum sodium (samples taken while GFR was being measured with Tc-99m DTPA), as well as INR that was calculated at the time of GFR determination or within a maximum interval of 15 days before or after GFR measurement. To establish the presence of ascites at the time of measuring GFR through Tc-99m DTPA clearance, the clinical records and/or imaging studies performed on the corresponding dates were reviewed, and only considered if ascites was recorded within 1 month before or after the evaluation. MELD and Child-Pugh scores were calculated for all patients.
GFR determination
mGFR determination with Tc-99m DTPA
The administration of Tc-99m DTPA was initiated after a period of hydration (10-20 mL/kg) with a bolus of 150 µCi and a subsequent continuous infusion of 300 µCi for 240 minutes (75 µCi/h). After a 60-min period of distribution, urine and blood samples were obtained every half-hour for four periods (when calculating the GFR, only the past three periods, at 120, 150, and 180 minutes, were considered). Samples were analyzed in duplicate in a gamma counter (Packard® COBRA II, USA) and the activity of 1 mL of each vial was registered for 1 min (counts/ml/min). Urine samples were obtained through spontaneous voiding, and blood samples were collected by venipuncture in the arm contralateral to the infusion. Clearance was calculated with the following formula: U×V/P [(P1+P2+P3)/3], where U = counts in 1 ml of urine, V = urinary volume per minute (ml/min), and P1, P2, and P3 = counts in plasma at 120, 150, and 180 minutes. The GFR was adjusted to a total-body surface area of 1.73 m2.
Determination of estimated GFR (eGFR)
SCr measurement was standardized in accordance with international guidelines10 (the Jaffe kinetic method, also known as alkaline picrate, Syncron System, Beckman Coulter, Ireland). Cystatin C was measured by ELISA and was also standardized according to the international guidelines11. GFR estimation formulas were calculated with the variables and recommendations applicable to each (Cockcroft-Gault [CG], 6-variable Modification of Diet in Renal Disease formula [MDRD-6], CKD-EPI Creatinine [CKD-EPI Cr], CKD-EPI cystatin C [CKD-EPI CystC]10, and CKD-EPI cystatin C-Creatinine [CKD-EPI CystC-Cr])12.
GFR was estimated with the RFH formula established by Kalafateli et al.:8 eGFR=45.9×(creatinine−0.836[µmolL])×(urea−0.229[mmolL])×INR−0.113×(age−0.129[years])×(sodium0.972[mmolL])×1.236(if male)×0.92(if moderate/severe ascites).
Statistical analysis
Results were expressed according to the type of variable, and the results are presented in measures of central tendency (mean and median) and their respective measures of dispersion (standard deviation and interquartile intervals [IQR 25-75]). The differences between means and medians were evaluated using Students t-test for related samples and the Wilcoxon singed-rank test for the non-parametric variables. Following the 2002 K/DOQI13 clinical practice guidelines for the performance validation of formulas estimating GFR, we used the following statistical method:
Bias = mGFR - eGFR
Bias (%) = (Measured GFR estimated GFR) ÷ measured GFR
Accuracy p (30) = Percentage of estimated GFR close to 30% of the measured GFR
Precision = Amplitude of the interquartile interval (IQI)
Subgroups were analyzed to evaluate the formulas performance between different mGFR groups (<60 ml/min/1.73 m2), the presence of ascites, and the Child-Pugh stage. Results for continuous variables were analyzed by one-way variance analysis and 95% confidence intervals (95% CI). The Bonferroni method was used for between-group comparisons. For categorical variables, the Chi-square test was applied. p value < 0.05 was considered significant. The SPSS version 21 statistical package and Microsoft Excel 2013 were used for data analysis.
RESULTS
Of the 76 patients included in the study, 53% were women. The general characteristics of patients are shown in Table 1. All the patients were Hispanic, and the mean age was 51 years (SD ± 9). The main cause of LC was chronic hepatitis C virus (HCV) infection, present in 37% of the patients. 70% of the cohort presented with advanced hepatopathy (Child-Pugh B and C) and 30% had different grades of ascites. Mean levels of SCr and cystatin C were 0.72 mg/dl (0.59-0.9) and 1.23 mg/l (0.93-1.59), respectively. The rest of the variables is shown in Table 1.
Table 1 General characteristics of patients
| Variables (n = 76) | Mean (±SD) n (%) |
|---|---|
| Women | 40 (53) |
| Age (years) | 51 (±9) |
| Etiology | |
| Alcoholism | 6 (7.9) |
| HBV | 2 (2.6) |
| HCV | 28 (36.8) |
| AIH | 13 (17.1) |
| PBC | 8 (10.5) |
| NASH | 5 (6.6) |
| Cryptogenic liver disease | 10 (13.2) |
| Others | 4 (5.3) |
| Patients with ascites | 23 (30.3) |
| Child-Pugh | |
| A | 22 (28.9) |
| B | 35 (46.1) |
| C | 19 (25) |
| Child-Pugh score | 8 (±9) |
| MELD score | 13 (±4) |
| Serum creatinine mg/dl | 0.72 (0.59-0.9) |
| Cystatin C mg/l | 1.23 (0.93-1.59) |
| Sodium mEq/l | 134 (131-137) |
| Urea mg/dl | 34 (27-49) |
| Serum albumin g/dl | 3.1 (2.7-3.5) |
AIH: autoimmune hepatitis, HBV: hepatitis B Virus, HCV: hepatitis C virus, NASH: nonalcoholic steatohepatitis, PBC: primary biliary cirrhosis
The mean GFR of the cohort by Tc-99m DTPA was 64 ml/min/1.73 m2. More than half of the patients (54%) had a GFR < 60 ml/min/1.73 m2 at the time of the evaluation, and 34% of the patients had a GFR < 45 ml/min/1.73 m2. Patients with ascites had a mean mGFR of 43.45 ± 22.95 ml/min/1.73 m2, compared with mGFR of 72.48 ± 29.42 ml/min/1.73 m2 in patients with no ascites (p < 0.000).
There was a significant difference between the means of the eGFRs obtained through the classic formulas based on SCr (CG, MDRD-6, CKD-EPI Cr, and CKD-EPI CystC-Cr), compared with the GFR measured using Tc-99m DTPA. The RFH formula and the CKD-EPI CystC formula showed no significant differences when compared with the mGFR (measured through Tc-99m DTPA clearance). However, when only patients with a mGFR <60 ml/min/1.73m2 were analyzed, all the formulas overestimated kidney function, with a statistically significant difference when compared with the gold standard (Table 2).
Table 2 Performance of the Royal Free Hospital, Cockcroft-Gault, MDRD-6, CKD-EPI Cr, CKD-EPI CystC, and CKD-EPI CystC-Cr equations, stratified by the level of liver failure (Child-Pugh B and C), and the level of measured GFR (≥ 60 or < 60 ml/min/1.73 m2)
| Equations | Tc-99m | Royal Free Hospital | CKD-EPI Cystatin C | MDRD-6 | CKD-EPI creatinine | Cockcroft-Gault | CKD-EPI CystC-Cr |
|---|---|---|---|---|---|---|---|
| All the patients (n=76) | |||||||
| GFR ml/min/1.73 m2 |
63.69±30.57 | 63.92±25.64 | 65.40±25.90 | 97.98±47.47* | 99.13±25.31* | 109.62±51.76* | 79.10 (23.50)* |
| p30 (%) | 62 | 59 | 12 | 33 | 25 | 49 | |
| Bias Mean±SD ml/min/1.73 m2 |
−0.22±26.96 | −1.71±24 | −34.06±22.89a | −35.43±26.53a | −45.92±44.62a | −15.41±21.6a | |
| % Bias Mean±SD ml/min/1.73 m2 |
−15.6±54 | −16.49±46.52 | −57.77±43a | −122.7±109a | −97±105.22a | −44.1±55.84a | |
| GFR < 60 ml/min (n=41) | |||||||
| GFR ml/min/1.73 m2 |
40.17±13.05 | 55.65±28* | 51.29±18.41* | 83.14±52.3* | 90.22±28.34* | 96.95±56.43* | 66.21±19.21)* |
| p30 (%) | 46 | 54 | 12 | 5 | 12 | 22 | |
| Bias Mean ±SD ml/min/1.73m2 |
−15.49±25.21 | −11.12±16.01 | -27.48±25.54a | −50.05±25.11a | −56.78±52.6a | 26.05±15.88a | |
| % Bias Mean ±SD ml/min/1.73m2 |
−44.63±59.55 | −36.73±49.65 | −68.73±55.49 | −199±88.65a | −149±117.94a | −76.32±55.57a | |
| Child-Pugh B and C (N=54) | |||||||
| GFR ml/min/1.73m2 |
57.62±29.08 | 63±28.45 | 58.85±23.17 | 95.51±52.57* | 99.64±24.87* | 111.91±56.65* | 74.40±29.08)* |
| p30 (%) | 63 | 59 | 13 | 20 | 11 | 41 | |
| Bias Mean ±SD ml/min/1.73m2 |
−0.22±26.96 | −1.23±25 | −32.5±25.22a | −40.6±25.45a | −54.29±47.74a | −16.78±21.86a | |
| % Bias Mean ±SD ml/min/1.73m2 |
−15.58±55 | −17.54±48.41 | −60±49 | −143.4±106.5a | −117.7±110.22a | −49.93±56.15a | |
| Ascites (n=23) | |||||||
| GFR ml/min/1.73m2 |
43±23 | 51±22.04 | 50.48±21.76 | 79.16±44.02* | 90.7±30.48* | 96.89±57.06* | 65.3±20.71* |
| p30 (%) | 48 | 52 | 17 | 9 | 4 | 22 | |
| Bias Mean ±SD ml/min/1.73m2 |
−7.58±22.73 | −7.03±22.2 | −28.16±22.87a | −47.24±28.66a | −53.44±52.62a | −21.85±19.7a | |
| % Bias Mean ±SD ml/min/1.73m2 |
−32.8±53.44 | −33.8±58 | −67.1±51 | −196±108a | −148±125a | −72.86±63a | |
Mean (SD),
*p < 0.05, comparison versus Tc-99m,
ap = 0.000, comparison of all the formulas with the Royal Free Hospital formula.
Formula performance with respect to subgroups
Overall, the RFH formula and the CKD-EPI CystC formula had the best performance for accuracy, p30: 62% and 59%, respectively, and best bias, −0.22 ± 26.96 ml/min/1.73 m2 and −1.71 ± 24 ml/min/1.73 m2, respectively (p>0.05). The rest of the formulas showed statistically significant differences when compared with the measured filtration (Tc-99m) (Table 2). The RFH and the CKD-EPI CystC formulas showed the best performance for the subgroups of sex, grade of advanced liver damage, and decreased kidney function (GFR <60 ml/min/1.73 m2, p30: 46 and 54%, and bias −15.49 ± 25.21 and −11.12 ± 16.01).
Bland-Altman plots describe the changes in bias according to the measurement with Tc-99 m DTPA. The overestimation of the different formulas increased with the decrease in measured filtration in all the formulas, but to a lesser degree with the RFH, CKD-EPI CystC, and CKD-EPI CystC-Cr formulas (Fig. 1). Creatinine-dependent formulas (except RFH formula) overestimated kidney function, even in patients with adequate kidney function (>60 ml/min/1.73 m2). On the other hand, the RFH and CKD-EPI CystC formulas performed similarly, although both tended to underestimate glomerular filtration when it was >60 ml/min/1.73 m2 and to overestimate filtration when kidney function was under 60 ml/min/1.73 m2.
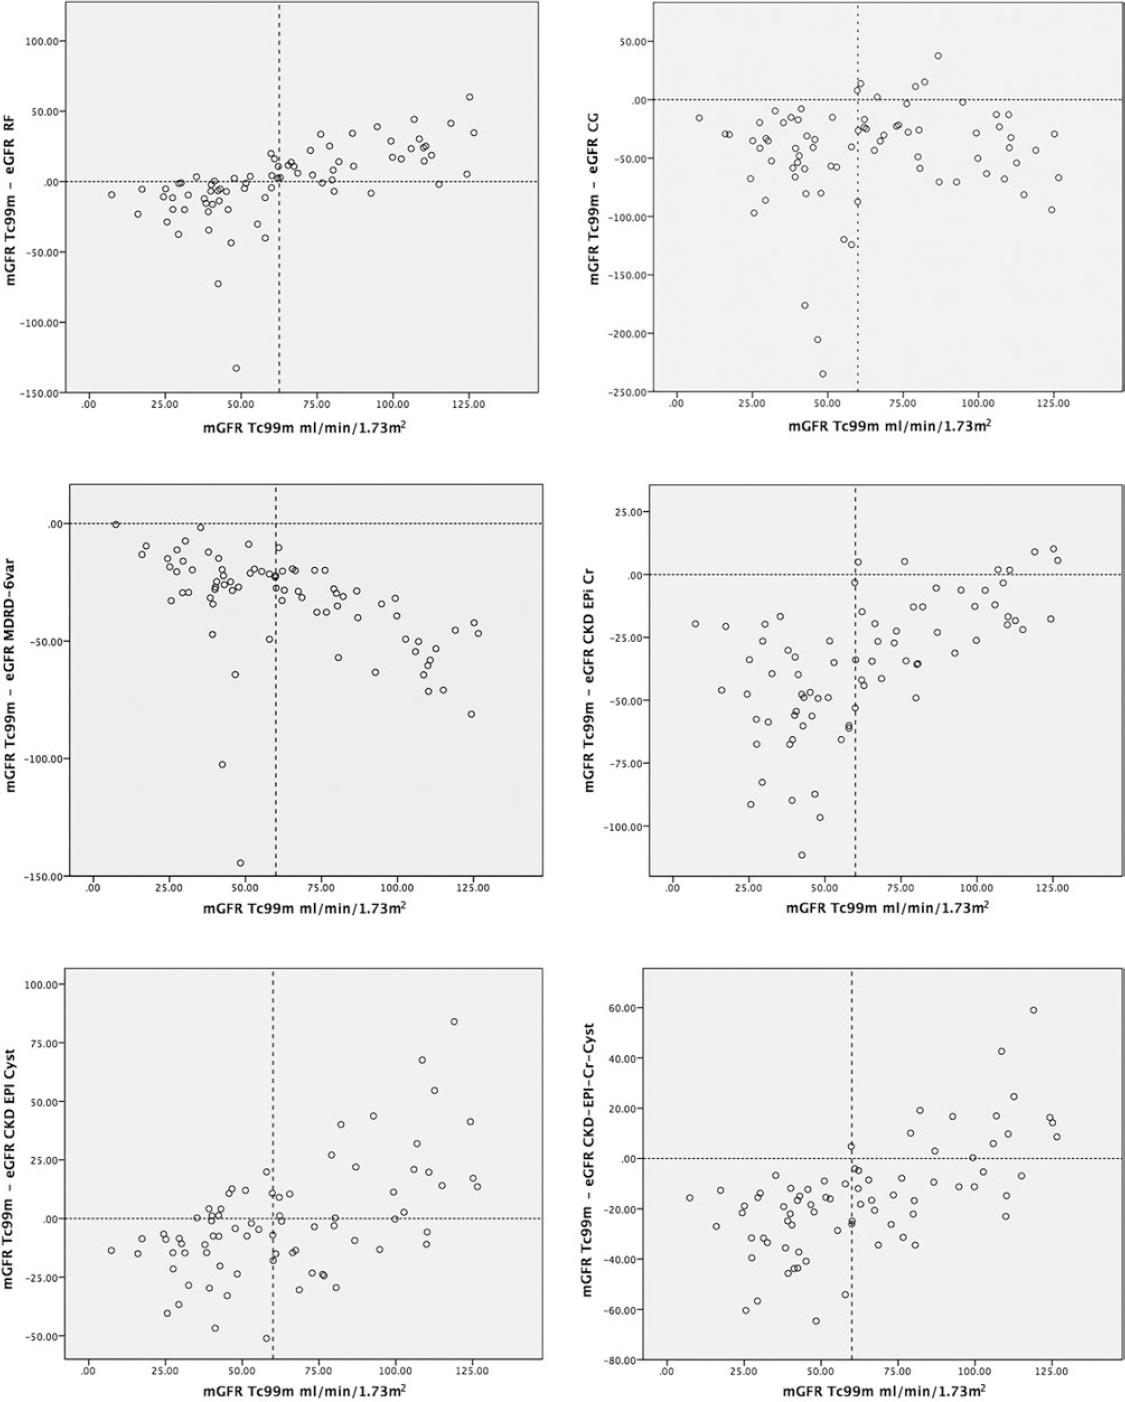
Figure 1 (A-F) The plots represent the measured glomerular filtration (GFR) rate (Tc-99m) and the difference between the measured GFR minus estimated eGFR. The dotted vertical line represents the cutoff point of the mGFR <60 ml/min/1.73m2. The horizontal dotted line represents 0, signifying no difference between the estimated GFR and the measured GFR. The values above that line describe a difference that overestimates the GFR, and the values below that line describe a difference that underestimates the GFR.
Classification according to the different GFR estimates
According to the GFR through Tc-99m DTPA, 54% of the subjects had GFR < 60 ml/min/1.73m2. The GFR was >90ml/min in 22%, 60-90 ml/min in 24%, 30-59 ml/min in 41%, 15-29 ml/min in 12%, and in 1% it was <15 ml/min/1.73 m2. According to the RFH and CKD-EPI CystC formulas, 55% and 50% of the patients showed an eGFR <60 ml/min, respectively, whereas the CG, MDRD-6, and CKD-EPI Cr formulas showed a lower percentage of the population with a GFR under 60 ml/min (17%, 17%, and 9%, respectively) (Fig. 2).

DISCUSSION
In patients with LC, kidney function plays a relevant role in all the disease stages. Its influence ranges from the adjustment of medication dose to being considered a prognostic factor for pre-transplantation and post-transplantation survival14. In the MELD score, which is the international classification for organ allocation for liver transplantation, SCr has been included as an essential marker for the evaluation of transplantation, and it is the section of the score that has the most impact on mortality15. Today, GFR calculated through equations based on creatinine has been shown to be inaccurate and imprecise in patients with cirrhosis, when compared with measured GFR, because the formulas are standardized in the general population4,16,17. In addition to presenting with factors that modify SCr concentrations, such as age, female sex, muscle mass, and nutritional status, among others, patients with LC present with high bilirubin levels that directly interfere with the diagnostic assay15.
The RFH formula is an interesting, recently published equation for estimating GFR, which, unlike the previously evaluated formulas, was developed in a population with LC. The formula includes the variables of age, sex, the presence or absence of ascites, creatinine, urea, sodium, and INR8,9. It was validated through an original, or training, cohort, and an external validation cohort9. The authors found a promising performance with outstanding accuracy and precision, although the methodology utilized for measuring GFR was not ideal. The RFH formula has the following important characteristics: its most significant feature is that it was carried out in a population with LC; it considers factors which stratify the severity of LC, such as INR and ascites; and finally, it includes serum sodium, also making a correction for a potential state of dilution.
Due to the scarcity of formulas that adequately estimate GFR in patients with LC, we proposed to validate the new RFH formula in our cohort of patients with LC4, which only included Hispanic patients. The performance of the formula for estimating GFR was less favorable than in the original study (Table 2). However, it is important to note that there were some differences which could have influenced our results. The most important was the use of different techniques to measure GFR. In our study, it was determined through renal clearance using Tc-99m DTPA, which is based on the quantification of the level of the radiopharmaceutical in plasma, as well as in urine. This means that it is not influenced by an increase in the volume of distribution, thus preventing the error observed in the methods based on the plasma clearance of a radiopharmaceutical. Plasma clearance is not necessarily the same as renal clearance, especially in subjects with an increase in volume of distribution, in whom part of the clearance (or disappearance) of the radioisotope from the plasma is due to the redistribution of the radiopharmaceutical into a third space (edema and/or ascites) and, consequently, kidney function is overestimated. Therefore, the K/DOQI11-13 guidelines and the British guidelines18 recommend renal clearance more than plasma clearance in patients with an increase in the volume of distribution (ascites and/or edema). In the study by Kalafateli et al.8, GFR measurement in the RFH training and internal validation cohorts was done through plasma clearance of Cr-51 EDTA. To correct the overestimation of GFR associated with the increase in the volume of distribution, they made a mathematical adjustment (previously published in two cohorts, of 13 and 111 patients)19,20. However, despite such correction, it is not the ideal method for creating and validating a formula, especially because the correction was made merely for the patients with ascites (it is not stated in the study that there were patients with edema and no ascites, which could also influence the GFR result). In the external validation cohort (according to the text in the supplement), only GFR measurement through plasma clearance of Cr-51-EDTA was carried out, with no mathematical adjustment for ascites, even though 77 patients (93.9%) presented with that criterion. Glomerular filtration measurement through plasma clearance in cirrhotic patients with ascites can produce an overestimation of up to 200%, due to the loss of the radioisotope from the plasma into the ascitic fluid.
Another possible explanation for the difference in performance of the RFH formula in our cohort was the mean GFR through Tc-99m DTPA. It was much lower in our study than in the two cohorts of the original article (59.8 ml/min/1.73 m2 vs. 78 ml/min/1.73 m2 in the internal validation and 73 ml/min/1.73 m2 in the external validation). The importance of the decrease in the measured glomerular filtration is shown by the 20% decrease of p30 when comparing patients with mGFR ≥ 60 ml/min versus those with mGFR < 60 ml/min. It is important to emphasize that the precision and accuracy reported by Kalafateli et al.8 with the CKD-EPI CystC formula (assessed only in the external validation cohort of 82 patients) was a p30 of 26.8% (95% CI: 17.8-37.1). Such figure contrasts considerably with the results from our cohort and with the majority of studies published at present3-5,17,21, in which in the cystatin C-based formulas, cystatin C is considered the biomarker with greater precision and accuracy for estimating glomerular filtration in patients with LC. Both formulas (RFH and CKD-EPI CystC) performed very similarly with respect to precision and accuracy, as well as to the underestimation of kidney function in patients with filtration > 60 ml/min/1.73m2 and overestimation in those with filtration <60 ml/min/1.73m2 (Fig. 2, Supplementary material). The RFH formula has the advantage that it does not need cystatin C determination (which is costly), and utilizes clinical and biochemical parameters that, in general, are routinely measured in the LC population (INR, sodium, and SCr), thus not increasing costs.
Our results showed poor performance of the SCr -based formulas (CG, MDRD-6, and CKD-EPI Cr), especially in patients with more advanced hepatopathy. The performance of the CKD-EPI CystC-Cr formula was slightly better, perhaps due to the presence of cystatin C in the equation. Our results were similar to those observed by Kalafateli et al. and other authors4,5,8. The most important limitation of our study was its retrospective design and the sample size. We could not include the entire population of the previous study because it incorporated patients with anticoagulation and/or TIPS, which could affect the performance of the RFH formula, as well as the fact that not all the patients had the necessary data available (ascites, INR, and sodium) for applying the formula.

