


 nueva página del texto (beta)
 Inglés (pdf)
 Artículo en XML
 Referencias del artículo
 Enviar artículo por email
 Citado por SciELO
  Similares en
SciELO
Similares en
SciELO 
 Permalink
INTRODUCTION
Breast cancer is the most frequently diagnosed neoplasia and a leading cause of cancer death among women1. Understanding the foundation of the differential response to treatments based on the molecular signature of the tumor is crucial to stratify patients who may benefit from a targeted therapeutic approach. Among the different phenotypes, the human epidermal growth factor receptor-2 (HER2) positive and the triple-negative breast cancer (TNBC), characterized by the lack of expression of estrogen receptor (ER), progesterone receptor, and HER2, are the most aggressive and clinically challenging tumors2. While most of TNBC tumors express the epidermal growth factor receptor 1 (EGFR), the coexpression of HER2 and EGFR worsens the prognosis, giving rise to poorly differentiated tumors with a high metastatic index2. Indeed, overexpression of EGFR and/or its ligands is a common trait usually found in multiple cancer types favoring tumor growth, which makes EGFR a useful marker for molecular targeting therapy3,4. Therapeutic agents utilized in the clinic for EGFR-positive tumors include small-molecule tyrosine kinase inhibitors (TKIs). Gefitinib, a TKI used as a single agent for EGFR-targeted therapy, has shown to be effective mainly in patients with non-small-cell lung carcinoma-bearing EGFR-activating mutations5. Moreover, this TKI inhibits the growth of both human tumor xenografts and breast cancer cell lines expressing different levels of EGFR or HER26-8. In breast cancer patients, gefitinib is not currently being considered for therapeutic purposes, mainly due to the low response rates for some types of breast tumors9-11. Nevertheless, gefitinib treatment has resulted in a significant difference in the complete pathologic response between non-TNBC and TNBC tumors12, showing promise in treating this latter type of tumors. Whether tumors will or will not respond to EGFR inhibitors depend on many factors including mutations that drive EGFR hyperactivation, rendering the cell addicted to EGFR pathway and, therefore, very sensitive to TKI therapy13. On the opposite, cells that are insensitive to TKIs may depend on other pathways to survive. Interestingly, one common pathway that drives breast cancer cells proliferation independently of the expression of common molecular markers is the one initiated by the oncogenic potassium channel ether-à-go-go 1 ([EAG1], Kv10.1, KCNH1)14-17. EAG1 channels are responsible for the potential membrane hyperpolarization that induces human breast cancer cell progression into the G1 phase of the cell cycle, resulting in cell proliferation16,18. Accordingly, reducing these currents with EAG1 blockers or downregulating EAG1 expression inhibited cell proliferation, an effect that has been observed in ER-positive, HER2-positive, and TNBC cells19-22. In general, EAG1 overexpression is a hallmark of cancer23-25, particularly in breast tumors (95% abundance, independently of the molecular signature)25. Given that, EAG1 is implicated in carcinogenesis and is a surface-expressed protein; it has been extensively studied as an oncological target due to its accessibility by extracellular pharmacological tools such as astemizole24-26.
Astemizole, a non-sedating second-generation H1-histamine receptor antagonist, has shown a significant association with reduced mortality among cancer patients, especially if a concurrent chemotherapy is used27. The latter may be explained by the following facts: (1) astemizole inhibits EAG1 currents by binding to open channels from inside the cells28; (2) it reduces EAG1 gene expression in breast cancer19,20; (3) the blockade of histamine H1 receptors by astemizole decreases histamine-dependent growth of cancer cells26; (4) astemizole enhances both lysosomal- and caspase-dependent cell death pathways27; and (5) astemizole sensitizes breast cancer cells to chemotherapy while reverts multidrug resistance27.
On the other hand, protein tyrosine kinases, particularly EGFR kinase, stimulate EAG1 channel activity by phosphorylating the tyrosine residues Tyr90, Tyr344, and Tyr48529. Therefore, TKIs are expected to shutdown EAG1, as shown in HEK293 cells transfected with EAG1 and treated with AG556, a compound that selectively inhibits EGFR autophosphorylation29. Indeed, EGFR blocking, at the level of activity and/or expression, significantly reduced EAG1 currents29. Consequently, the inhibition of EAG1 accounts in part for the antiproliferative effect of specific EGFR kinase inhibitors.
Based on this background, we investigated the antiproliferative effect of the combination of astemizole with gefitinib, in an effort to decrease both EAG1- and EGFR-dependent cell proliferation by maximizing target inhibition. For this study, we chose an ER-positive cell line so that it represents one of the most common tumor phenotypes, but importantly, it also coexpresses EAG1, EGFR, and HER2, all markers of poor prognosis.
MATERIALS AND METHODS
Cell culture
The breast cancer cell line BT-474 was purchased from American Type Culture Collection (ATCC) and maintained in Hybri-Care medium (ATCC) supplemented with 1.5 g/L sodium bicarbonate, 100 units/mL penicillin plus 100 µg/mL streptomycin, and heat-inactivated FBS (all from Invitrogen Life Technologies, NY, USA) to a final concentration of 10% in humidified atmosphere with 5% CO2 at 37°C. All experimental procedures were performed in supplemented Hybri-Care medium conditioned with 5% charcoal-stripped-heat-inactivated FBS.
Characterization of cells by immunocytochemistry
Cells were grown on Lab-Tek Chamber Slides (Thermo Scientific) and fixed in 96% ethanol. Antigen retrieval was achieved by autoclaving in immuno/DNA retriever with EDTA solution (BioSB, CA, USA) during 5 min. Slides were blocked with ImmunoDetector peroxidase blocker (BioSB) for 5 min and further incubated during 2 h with anti-EAG1 (1:300, Novus Biologicals, CO, USA) or 1 hour with anti-EGFR (1:250, BioSB), anti-ERα (1:250, BioSB), or anti-HER2 (1:100, Cell Signaling Technology, MA, USA) antibodies. Slides were sequentially incubated with ImmunoDetector Biotin-Link and ImmunoDetector HRP label (BioSB) during 10 min each, washed with Tris-buffered saline, stained with diaminobenzidine, and counterstained with hematoxylin.
Cell proliferation and drug combination studies
Cells were seeded in 96-well plates at a density of 1000 cells per well. After 24 h, cells were incubated in the presence of different concentrations of astemizole (Sigma, St. Louis, MO, USA), gefitinib (kindly provided by AstraZeneca, Mexico City, Mexico), or the vehicle alone (dimethyl sulfoxide, DMSO) during 6 days. Cell proliferation was studied using the colorimetric XTT assay (Roche Applied Sciences, IN, USA) following the manufacturers instructions. Absorbance was determined at 492 nm in a Multiskan spectrophotometer (Labsystems Inc., Canada). Furthermore, cell density was determined using the protein-binding dye SRB30. The concentrations that caused 20% and 50% cell proliferation inhibition (inhibitory concentrations [IC]20 and IC50, respectively) were calculated by non-linear regression analysis using sigmoidal fitting from the sigmoidal dose-response curve by means of the scientific graphing software Origin (OriginLab Corporation, Northampton, MA). Subsequently, using the IC20 and IC50 of astemizole and gefitinib, we studied the effect of the drug combination to determine a possible synergism on cell proliferation. Then, combination index (CI) values were determined applying CI equation31. For this analysis, an additive effect, synergism, or antagonism were defined as CI values = 1.0, < 1.0, and > 1.0, respectively, as previously reported31.
Cell cycle distribution
BT-474 cells were incubated in the absence or presence of the respective IC50 values of astemizole or gefitinib alone or combined during 96 h. After treatment, the cells were collected, washed with phosphate buffer pH 7.2, and fixed in 70 % ethanol v/v. Then, the samples were washed and incubated in RNAse (10 µg/ml), 0.1 % v/v Triton X-100, and 7-aminoactinomycin D (7-AAD) (BioLegend, San Diego, CA) (50 µg/ml) solution in the dark at room temperature for 20 min. The DNA content was determined using a FACSCanto II flow cytometer (Becton Dickinson, San Jose, CA, USA). For cell cycle analysis, a total of 30,000 events from 7-AAD area versus 7-AAD wide gate were acquired. Results were analyzed using FlowJo software (LLC, Ashland, OR, USA).
RESULTS
Cell characterization
The cells were characterized by immunocytochemistry to evaluate the expression of the molecular targets of astemizole and gefitinib. BT-474 cells showed positive immunostaining for EAG1, HER2, and EGFR, which suggest sensitivity to astemizole and gefitinib. In addition, we confirmed ERα presence in BT-474 cells (Fig. 1).
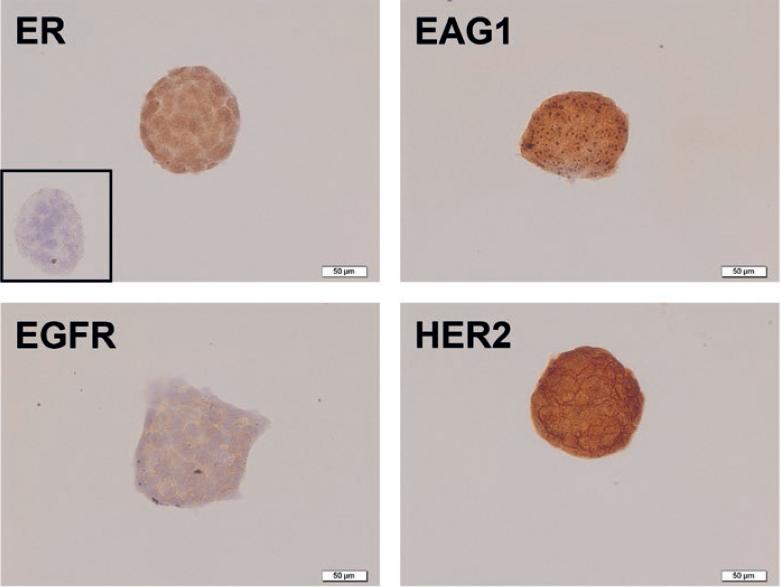
Figure 1 Immunocharacterization of breast cancer cells. BT-474 cells showed strong immunoreactivity (brown staining) for estrogen receptor α (ER), ether-à-go-go-1 (EAG1), epidermal growth factor receptor 1 (EGFR), and epidermal growth factor receptor 2 (HER2). Negative control is shown in the inset and was carried out in the absence of primary antibody. Representative images are shown.
Antiproliferative effects of astemizole and gefitinib
To test the functionality of EAG1/HER2/EGFR-targeted treatment, BT-474 cells were incubated in the presence of increasing concentrations of astemizole or gefitinib. A concentration-dependent antiproliferative effect of both compounds was observed (Fig. 2), indicating that these cells greatly depended on EAG1/HER2/EGFR signaling pathways to grow. Based on the range of concentrations tested, we calculated the IC20 and IC50 values for the experimental compounds (Table 1).
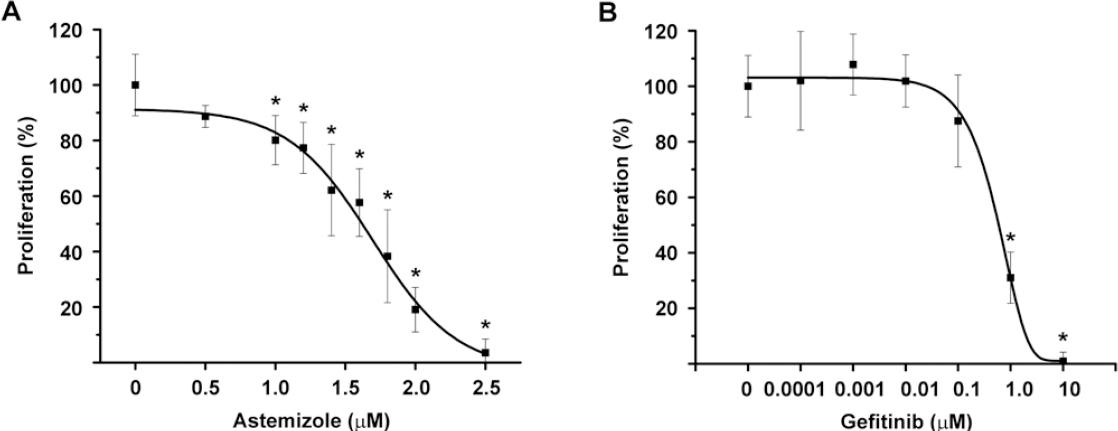
Figure 2 Astemizole and gefitinib antiproliferative effects on BT-474 cells. The cells were incubated in the presence of increasing concentrations of astemizole (A) or gefitinib (B) during 6 days. Both compounds inhibited cell proliferation in a concentration-dependent manner. Results are depicted as the mean ± standard deviation of sextuplicate determinations and represent at least five different experiments. Data from vehicle treated cells were set to 100% and the rest was normalized accordingly. *p < 0.001 versus control. Proliferation was assayed by measuring the metabolic activity of viable cells by using the XTT colorimetric method.
Drug combination effects on cell proliferation
To analyze the potential synergistic antiproliferative effect of astemizole and gefitinib, drug combination studies were carried out using their corresponding IC20 and IC50 values. Results showed that cell proliferation was inhibited in a greater extent when combining the drugs, as compared against each compound alone. Statistical significance was reached using gefitinib at IC20 with astemizole at IC50 and gefitinib at IC50 in combination with astemizole at both concentrations tested, reaching approximately 80-90% cell growth inhibition (Fig. 3A). Furthermore, cell density was significantly reduced by the combined treatment compared with non-treated cells (Fig. 3B).
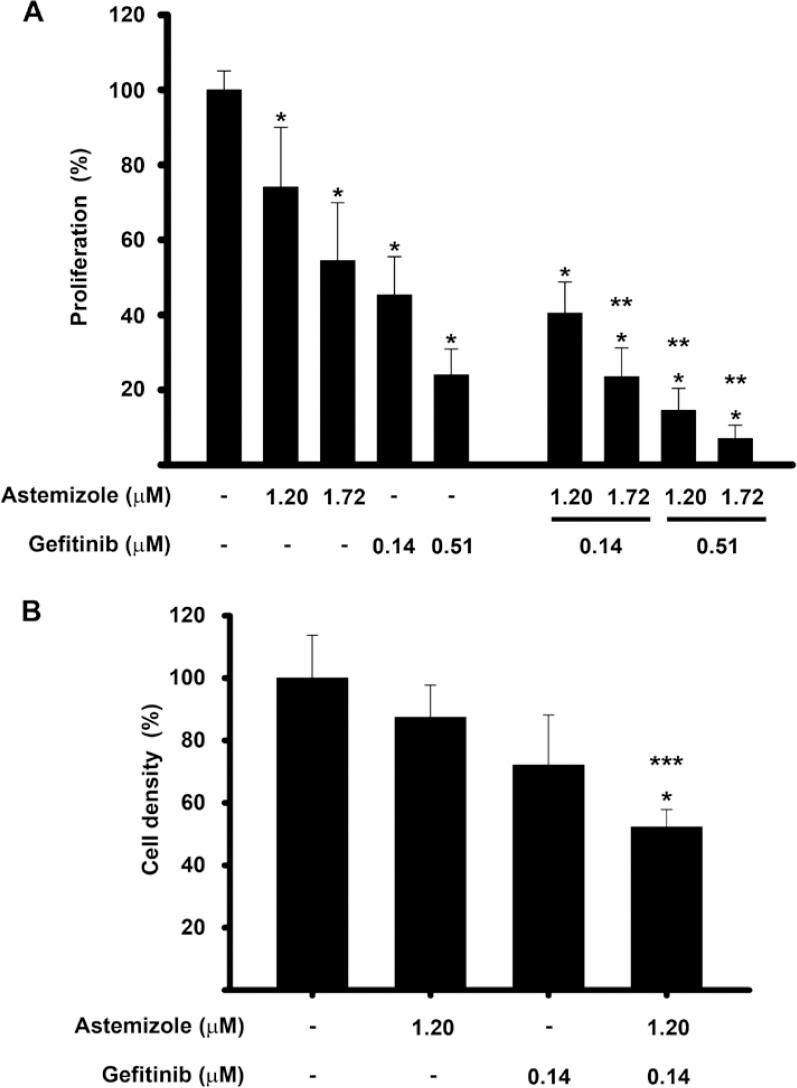
Figure 3 The combination of astemizole and gefitinib inhibited cell proliferation in a greater extent than each compound alone. The cells were incubated in the presence of astemizole and gefitinib alone or combined at their corresponding Inhibitory concentrations (IC)20 and IC50 values. (A) cell proliferation was evaluated using XTT method. (B) cell density was measured by SRB assay. Results are depicted as the mean ± standard deviation of sextuplicate determinations and represent at least five (A), and three different experiments (B). Data from vehicle treated cells (-) were set to 100% and the rest was normalized accordingly. *p < 0.05 statistical significance versus vehicle, **p < 0.05 versus each compound alone and ***p < 0.05 versus astemizole.
To determine the pharmacological effect that resulted from the drug combinations, CI equation was used31. A graphic of the fraction affected of cells versus CI value for the drug combination is shown in figure 4. All the combination schemes resulted in CI < 1, which reflect synergism in every case. Accordingly, as the concentrations of astemizole and gefitinib increased, the values depicting CI ranged from 0.75 to 0.26, indicating moderate to strong synergism, respectively.
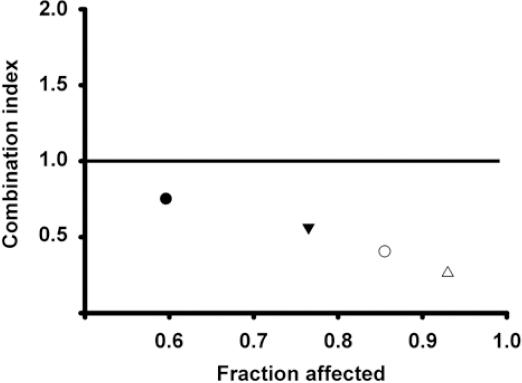
Figure 4 Combination index (CI) values and fraction affected from different schemes of drug combinations. The BT-474 cells were co-incubated at the corresponding inhibitory concentrations (IC) IC20-IC20 (), IC50-IC20 (▾), IC20-IC50 (○) and IC50-IC50 (△) values of astemizole and gefitinib, respectively. CI value of 1 indicates additive effect (denoted by the horizontal line) and the values below this line mean synergistic effect. All the combination schemes showed synergism at different intensities.
Astemizole combined with gefitinib diminished the percentage of cells in G2/M-phase
To determine whether the combined treatment modified the cell cycle distribution of BT-474 cells, flow cytometric analysis using a fluorescent marker for DNA was performed. Figure 5 shows the cell cycle profile after treating the cells with astemizole or gefitinib at their corresponding IC50 values, alone or combined during 96 hours. As depicted, astemizole and gefitinib per se reduced the percentage of cells in G2/M phase compared to untreated cells. The combination of both drugs further reduced this value, achieving statistical significance when compared with both vehicle- and astemizole-treated cells. Accordingly, the percentage of cells arrested in G0/G1 increased, while the S phase diminished in the combined treatment when compared to vehicle-treated cells. These observations are consistent with more cells exiting the cell cycle after being exposed to the combined treatment. The S phase was not modified.
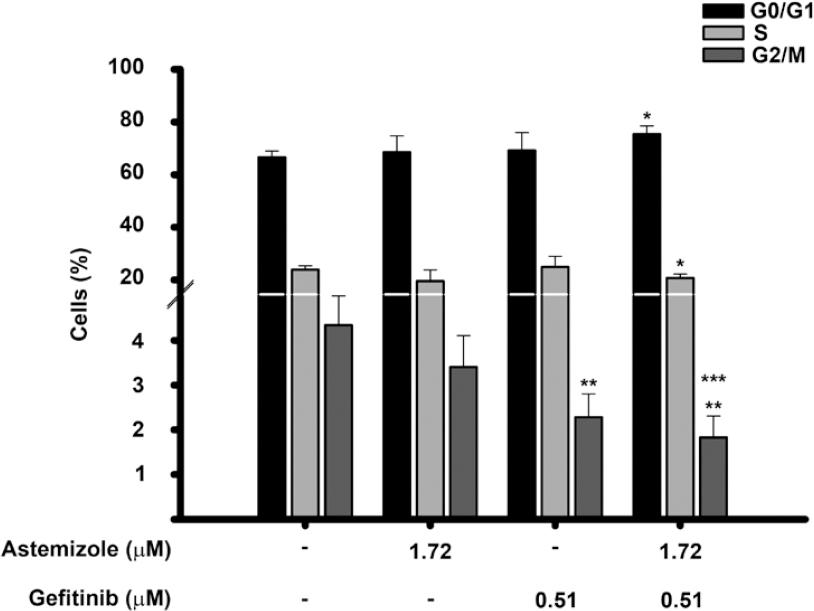
Figure 5 Effects of the astemizole-gefitinib combination on the cell cycle profile in breast cancer. Cells were incubated in the absence () or presence of their corresponding IC50 value of astemizole and gefitinib alone or in combination for 96 h. The percentage of breast cancer cells in different phases of the cell cycle is shown. *p < 0.05 versus untreated cells (t-test), **p = 0.002 versus untreated cells (one-way ANOVA). ***p = 0.002 versus astemizole-treated cells (one-way ANOVA). Bars represent data from at least three different experiments.
DISCUSSION
Recently, the use of antihistamines for cancer therapy has gained interest due to their efficacy, safety, and low cost27. In this study, we tested the commonly prescribed antihistamine astemizole with the EGFR-blocker gefitinib, and we show for the first time that this combination had a synergistic effect on growth inhibition of cultured breast cancer cells. The synergistic interaction observed between these two compounds might be due to several mechanisms including the dual target of EAG1, both at the level of activity and expression, and the concomitant blocking of EGFR signaling. Indeed, the rationale to use astemizole and gefitinib in combination was based on preclinical data showing that TKIs abate the ability of EGFR to phosphorylate EAG1, while astemizole inhibits both EAG1 activity and expression, resulting in decreased cell proliferation and tumor progression16,19,20,29. The combination of gefitinib and astemizole has previously been tested in human lung cancer cell lines, showing, in a similar manner to our results, that the drug combination at their IC20 had a superior effect in reducing cell proliferation and survival while increased apoptosis in comparison to each compound alone32.
It is worth mentioning that some TKIs have been shown to inhibit members of the cytochrome P450 family (CYPs), which should be considered when combining TKIs with drugs that are CYPs substrates, due to the possibility of increased drug toxicity or reduced pharmacological effects33. In this regard, astemizole, used in this study, is catabolized by CYP3A4, a cytochrome that also plays a role in gefitinib metabolism. Previous reports demonstrated that gefitinib inhibits CYP3A4 activity in almost 20%33; therefore, we hypothesize that lower concentrations of astemizole will result in a greater effect in vivo when combined with gefitinib, in a similar manner as seen in this in vitro study.
Of note, herein, we showed that the calculated IC20 and IC50 of gefitinib in BT-474 cells are in the range of clinically achievable concentrations. As a reference, the steady-state plasma concentrations of gefitinib observed in cancer patients receiving 225-300 mg/day of TKI ranged between 0.35 µM and 0.53 µM, with clinically meaningful disease stabilization in a range of different tumor types34,35. In our study, IC20 and IC50 values of gefitinib were 0.14 and 0.51 µM, respectively. Therefore, it might be possible to lower the dose of gefitinib to patients by the concomitant administration with astemizole, which may result in benefit to reduce undesirable side effects of TKI.
In the case of astemizole, reported therapeutic and toxic serum levels are 0.05 µg/mL (0.10 µM) and 14 µg/mL (30.5 µM), respectively36; therefore, the IC20 and IC50 values calculated in this study are higher than the therapeutic values but significantly lower than those associated with toxicity. Nevertheless, it should be noted that astemizole therapeutic levels have been calculated when prescribed as an antihistamine, not as an anticancer agent, which remains to be determined in future studies and are expected to be higher. In this regard, this study suggests that under in vivo conditions, astemizole might be used at lower doses when combined with gefitinib, due to the synergy that results from the interaction of these drugs and the gefitinib-dependent inhibition of CYP3A4.
Our results showing that the combination of gefitinib and astemizole synergistically inhibited cell proliferation while significantly reduced the G2/M and increased the G0/G1 phases of the cell cycle, allow us to suggest that the combination of the drugs can modify the cell cycle profile in breast cancer cells favoring cell death. This assumption is supported by previous reports showing that astemizole and gefitinib alone can inhibit cyclin D1 and E expression and provoke cell cycle arrest in G0/G1 and/or cell death in breast cancer14,37. Given the strong dependence of EAG1 proliferative potential on EGFR expression and activity, we believe that the drug combination studied herein might be a good therapeutic option for patients bearing tumors coexpressing HER2/EGFR/EAG1, regardless of the presence of ER, and irrespective of the tumor dependence on estrogens to survive. Moreover, since EAG1 may also be upregulated by estrogens, as previously shown in cervical cancer cells38, the combination of astemizole/gefitinib represents a good option to further abate estrogen-dependent EAG1-induced cell proliferation.
In summary, the results of the present study suggest that strategies involving the dual blockade of EAG1 may significantly improve the benefits of standard chemotherapy regimens, including tyrosine kinases inhibition, in patients affected with breast cancer.

