


 nueva página del texto (beta)
 Inglés (pdf)
 Artículo en XML
 Referencias del artículo
 Enviar artículo por email
 Citado por SciELO
  Similares en
SciELO
Similares en
SciELO 
 Permalink
Introduction
Ground-level magnetic field data are crucial for several applications, including monitoring of evolving geomagnetic storms and the space weather conditions (Love, 2008; Matzka et al., 2010; Love & Finn, 2011; Mandea & Korte, 2011; Onsager, 2012; Love & Chulliat, 2013; Waters et al., 2015).
A geomagnetic storm is the strongest perturbation in the Earth's environment. The general triggering for geomagnetic storms is the magnetic interaction/reconnection between the Earth's magnetosphere and interplanetary magnetic field. These disturbances result in intense currents in the magnetosphere and ionosphere (Ganushkina et al., 2018). The strongest geomagnetic storms occur when coronal mass ejections (CMEs) are emitted toward the Earth, causing a substantial injection of energetic particles drifting around the Earth causing a compression of the magnetosphere (Tsurutani et al., 1988; Gosling et al., 1991; Gopalswamy et al., 2005; Chen, 2011; Joshi et al., 2011; Webb & Howard, 2012), and at the same time an intensification of the currents in the magnetosphere-ionosphere system (Ganushkina et al. , 2018). The current systems that can be affected during a geomagnetic storm are: (1) the magnetopause currents shielding earth's dipole and the ring current; (2) the symmetric ring current; (3) the cross-tail current along with the closure currents on the magnetopause; and (4) the partial ring current, which connects the Region 2 field-aligned currents (Ganushkina et al. , 2018).
During the storm, the ring current particles which are energized causing a compression of the low-latitude horizontal component of the terrestrial magnetic field and change the magnetospheric ring current during a prolonged time interval (Gonzalez et al., 1994). To quantify the effect of this current, the 1-hour-disturbance storm time (Dst) index is employed to characterize the intensity of the geomagnetic storms (Sugiura, 1964). This index uses the geomagnetic field data from 4 low latitude stations: Kakioka KAK (36.2°N, 140.2°E) in Japan; Honolulu HON (21.3°N, 158.0°W) in Hawaii; San Juan SJG (18.1°N, 66.2°W) in Puerto Rico; and Hermanus HER (34.4°S, 19.2°E) in South Africa. From these stations, the time series of the horizontal (H) component of the geomagnetic field is obtained by subtracting the background magnetic field and the solar quiet (Sq) variation of the geomagnetic field. Thus, the H component is averaged over these stations and normalized to the geomagnetic equator, as
Geomagnetic storms evolve in three phases: (1) the initial phase is an abrupt positive variation in the Dst index, called sudden storm commencement (SSC). An SSC is produced by sudden compression in the magnetosphere caused by an increment of the dynamic pressure of the solar wind. (2) the main phase where the Dst index takes negative values during the injection of energized plasma in the equatorial ring current until it reaches a minimum Dst value; and (3) the recovery phase where Dst values increase until they reach pre-sudden commencement values during the return of the geomagnetic field to normality (Gonzalez et al., 1994; Loewe & Prölss, 1997). During this process, Dst values decrease from close to zero to negative until a minimum Dst value of later increases recovers values closer to zero. According to this minimum value, storms are classified into: weak (-30>Dst>-50 nT, with 0≤Kp≤5), moderate (-50>Dst>-100 nT, with 5<Kp<7), and intense (Dst<-100 nT, with 7≤Kp≤9) categories (Gonzalez et al., 1994; Matzka et al., 2021). Thus, a negative Dst index value indicates increasing intensity of the ring current (Gonzalez et al., 1994; Loewe & Prölss, 1997). This Dst decay is controlled by the ring current and the magnetospheric tail current. During the main phase, the ring current increases its density of O+ ions, of ionospheric origin, contributing to the plasma pressure in the inner magnetosphere (Keika et al., 2013; Daglis et al., 1999; Welling et al., 2011). During the recovery phase, particle transport into the ring current slows, allowing various loss processes to reduce ring current particle fluxes to their quiet-time level. The loss mechanisms are more efficient near dawn and dusk (Le, 2013) and explain why the ring current and the ionosphere control the electric fields in the interior of the magnetosphere at dawn and dusk (Bogdanova et al. , 2014). These effects are due to the electric fields that appear during dusk near the equatorial ionosphere (Tsurutani et al., 2012). Thus, the ring current becomes the dominant Dst source during intense geomagnetic storms, but during moderate storms, its contribution to Dst is comparable with the tail current's contribution (Kalegaev & Makarenkov, 2008).
Intense storms could represent a latent hazard for space technology systems and human activities on the Earth's surface (Hapgood, 2011; Love & Finn, 2011; Love et al., 2014). To study these events, magnetic ground stations around the world monitor the onset of solar-induced storms and give warnings that help diminish related economic losses (Love & Finn, 2011; Onsager, 2012; Love & Chulliat, 2013). Magnetometer measurements of ground stations at low latitudes are used to monitor the electrodynamics of the ionosphere that control ionospheric plasma distributions during a geomagnetic storm (Kamide et al., 1981; Richmond & Kamide, 1988; Yizengaw et al., 2014; Anderson et al. , 2004).
In this contribution, we studied five intense geomagnetic storms during the maximum phase of solar cycle 24 by using ground-level magnetic field data gathered at the La Serena low-latitude magnetic ground station as a response to development of new in situ tools and ground-based data sets that support magnetospheric research.
Solar Cycle 24
Solar activity (such as sunspot area, radio flux, solar flares, CMEs, and other related phenomena) can increase or decrease following an 11-year cycle of activity (Schwabe, 1844). Each solar cycle has unique characteristics; however, solar cycle 24 has exhibited hitherto unusual and unprecedented solar activity (Richardson, 2013; Kamide & Kusano, 2013; Gopalswamy et al. , 2014; Pesnell, 2014; Watari, 2017).
Solar cycle 24 (2008-present) (Pesnell, 2014), preceded by the lowest and the longest solar minimum in the last solar cycles (Russell et al., 2010; Richardson, 2013), is the most recently completed solar cycle (Kamide & Kusano, 2013; Gopalswamy et al., 2014; Watari, 2017). The extended minimum from ~2008 to 2010 (Gopalswamy et al., 2014; Lingri et al., 2016) was followed by high activity during a short phase beginning at the end of 2011 (Lingri et al., 2016; Watari, 2017) with an activity peak reached before 2013, as it then decreased and peaked again in 2014 (Gopalswamy et al. , 2014; Lingri et al. , 2016), registering its maximum activity phase from 2014 to 2015 (Pesnell, 2014). Several authors have speculated that this extraordinarily low minimum has shown unexpected Sun and solar wind conditions compared only with strange states of the Sun occurred in the past, such as Maunder and Dalton minima (Agee et al., 2010; McDonald et al., 2010; Feynman & Ruzmaikin, 2011; Hao & Zhang, 2011; White et al., 2011; Williams & Pesnell, 2011). The Maunder minimum (1645-1715) and Dalton minimum (1790-1820) were periods with extremely low sunspot numbers where the Earth experienced abnormal cooling times (Eddy, 1976; Mauquoy et al. , 2002; Owens et al., 2017).
Instruments and Data
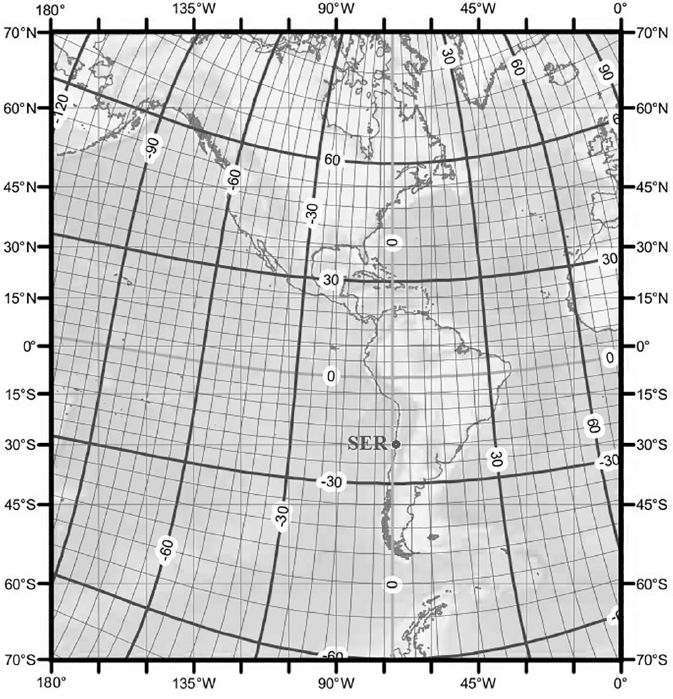
In this study, we used data recorded by a low-latitude magnetic ground station. The La Serena magnetic ground station (SER) in the Villa Juan Soldado sector at the outskirts of La Serena, Chile (see Figure 1), is far from urban settlements. For reference, the geographical coordinates of SER are 29.827° S, 71.261° W, at 28 [masl], with corrected geomagnetic coordinates to -16.55 latitude, 0.17 longitude, and L-value of 1.09. SER is supported by the University of La Serena's Laboratory for Space and Atmospheric Physics (LAFESAT) through the Department of Physics of the University of La Serena (DFULS).
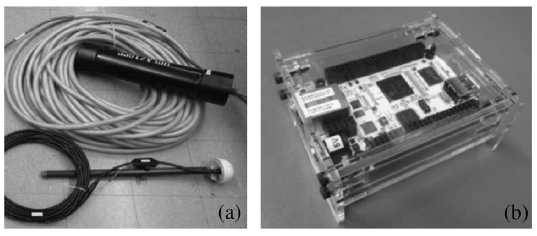
SER records geomagnetic field intensity data in nT units using the X (North) Y (East) Z (Down) coordinate system in both ASCII and CDF formats at 1 sec and 1 min time resolution by using a fluxgate magnetometer from the University of California Los Angeles (UCLA). Figure 2 details this instrumentation (Engebretson & Zesta, 2017). Our study applies to five geomagnetic storms observed from 2014 to early 2016. To describe these storms, the geomagnetic Dst index was obtained from Kyoto's World Data Center for Geomagnetism (WDC) database at 1 h resolution (http://wdc.kugi.kyoto-u.ac.jp/).
Comparison of local measurements and global indexes
We investigate five intense geomagnetic storms (Dst<-100 nT, 7≤Kp≤9) that occurred during the maximum phases of solar cycle 24. Note that the magnetosphere and solar wind parameters (e.g. IMF and plasma parameters) and other solar sources (e.g. CME) of these storms are not studied here. Thus, we select the most intense events registered between 2014 and early 2016 whose characteristics and sources many authors reported (see, Table 1). This Table summarizes the main characteristics of the selected storms.
Table 1 List of intense geomagnetic storm reported during the maximum phase of solar cycle 24 (in decreasing order).
| Code | Start | End | Dstmin [nT] | Kp | Type | Solar sources | Reports |
|---|---|---|---|---|---|---|---|
| I1 | 2015/03/17 | 2015/03/21 | ‒223 | 7.7 | SCa | PHc(sheath, MCd) CHe |
(Astafyeva et al., 2015) |
| (Liu et al., 2015) | |||||||
| (Baker et al., 2016) | |||||||
| (Jacobsen & Andalsvik, 2016) | |||||||
| (Kalita et al., 2016) | |||||||
| (Goldstein et al., 2016) | |||||||
| (Hairston et al., 2016) | |||||||
| (Nava et al., 2016) | |||||||
| (Salinas et al., 2016) | |||||||
| (Verkhoglyadova et al., 2016) | |||||||
| (Wu et al., 2016) | |||||||
| (Yao et al., 2016) | |||||||
| (Zakharenkova et al., 2016) | |||||||
| (Ray et al., 2017) | |||||||
| (Watari, 2017) | |||||||
| (Zolotukhina et al., 2017) | |||||||
| I2 | 2015/06/22 | 2015/06/24 | ‒204 | 7.7 | SC | PH (sheath, MC) multiple |
(Liu et al., 2015) |
| (Baker et al., 2016) | |||||||
| (Gromova et al., 2016) | |||||||
| (Reiff et al., 2016) | |||||||
| (Le et al., 2017) | |||||||
| (Piersanti et al., 2017) | |||||||
| (Watari, 2017) | |||||||
| I3 | 2015/12/19 | 2015/12/22 | ‒155 | 6.3 | SC | Hf (MC) | (Watari, 2017) |
| I4 | 2014/02/18 | 2014/02/22 | ‒119 | 6.3 | GCb | PH (MC) multiple |
(Atulkar et al., 2014) |
| (Zakharenkova et al., 2015) | |||||||
| (Ghamry et al., 2016) | |||||||
| (Durgonics et al., 2017) | |||||||
| (Watari, 2017) | |||||||
| I5 | 2015/12/31 | 2016/01/02 | ‒110 | 6.0 | SC | PH (MC) | (Berdichevsky et al., 2016) |
| (Watari, 2017) | |||||||
a SC: sudden commencement; bGC: gradual commencement; cPH: partial halo CME; dMC: magnetic cloud; eCH: coronal hole;f H: fulll halo CME.
To describe these events from ground-level measurements, we employ a graphical description based on: (i) the local records of the XYZ-components of the geomagnetic field taken from SER (http://magnetometers.bc.edu/) to obtain horizontal component H=( X2+Y2)1/2 and the rates dH/dt; (ii) the geomagnetic Dst index taken from the WDC database (http://wdc.kugi.kyoto-u.ac.jp/); and (iii) the Kp index taken from GFZ Helmholtz Centre Potsdam (https://www.gfz-potsdam.de/), and included to complement the geomagnetic activity produced by each storm. In these descriptions, we use universal time (UT) and the day of the year (DOY) to specify the sudden commencement and the phases of each storm.
March 17 (2015) Storm
The March 17-21, 2015 event, called St. Patrick's Day geomagnetic storm, was the most intense storm of solar cycle 24, with a minimum Dst value of -223 nT (Kamide & Kusano, 2015; Wu et al., 2016; Watari, 2017). Figure 3a shows a graphical description of this storm using the H-component of the geomagnetic field recorded by SER at 1 min resolution. Note that in this and the following cases, the baseline for the H component was obtained using the same methodology employed in the derivation of the Dst index (see Sugiura & Kamei, 1991). On March 17 (DOY 76), around 04:45 UT appears the SSC with a 63 nT increase of the H component and a rate dH/dt=32 nT/min. Next, the geomagnetic component values fell to a minimum up to H=~-200 nT at 17:00 UT with rates up to dH/dt=-32 nT/min. Later, a second storm intensification reached H=-339 nT at ~22:00 UT on March 17, and with rates of dH/dt=10 nT/min. A few hours later, the geomagnetic component values slowly increased during a recovery phase that lasted several days. Besides, Fig. 3b shows a good correlation between Dst index and the H component for all storms phases.
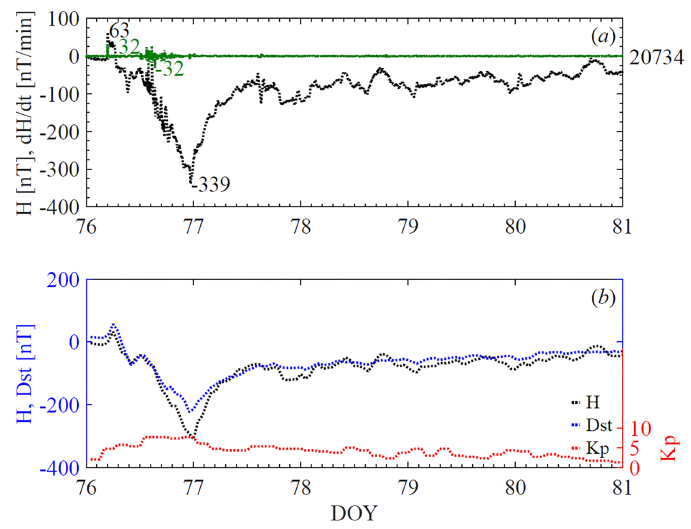
Figure 3 Geomagnetic field variations during the St. Patrick's Day storm (I1 recorded by SER. (a) H component and rate dH/dt; (b) comparison of geomagnetic field variations recorded by SER, and the Dst index reported by WDC during this storm. Here, the baseline for the H component was obtained using the method reported by Sugiura & Kamei (1991). The number at the right of the top panel is the reference value obtained by SER. The Kp index in the bottom panel was included to complement the geomagnetic activity due to the storm.
June 22 (2015) Storm
The geomagnetic storm of June 22-24, 2015, is so far the second most intense event of solar cycle 24 (Le et al., 2017; Piersanti et al., 2017; Watari, 2017). Figure 4 shows its graphical description by using the H-component of the geomagnetic field recorded by SER at 1 min resolution. Fig. 4a displays positive H peak values marking an SSC observed at 06:00 UT on June 22 (DOY 173) with a rate dH/dt>10 nT/min. A second SSC was observed around 18:00 UT registering H=80 nT and dH/dt=48 nT/min. This storm followed a two-step development during its main phase with a first moderate peak at ~20:00 UT with H=~-190 nT and dH/dt=-18 nT/min; and a second peak of H=-239 nT at ~04:00 UT on June 23 (DOY 174). Next, the recovery phase also unfolded in two-steps observed at ~22:00 UT on June 23 and at ~14:00 UT on June 24, both with much rate variation of dH/dt. In addition, Fig. 4b shows the contrast of records of geomagnetic fields measured by SER and the Dst index reported by WDC. In the Dst data, two minimum value events emerged. One occurred around 05:30 UT on June 23, and the other more powerful event causing a Dst peak of -204 nT on June 24. The storm's main phase lasted about half a day, but its recovery phase took many days. Here, the H component record similar observations as the Dst index.

Figure 4 Geomagnetic field variations during the June 22-24, 2015, storm (I2) recorded by SER. The description of this Figure is similar to Fig. 3.
December 19 (2015) Storm
The measured H values by SER (at 1 min resolution) for the December 19-22, 2015, storm and its graphical description appear in Fig. 5a. It shows positive H peak values, corresponding to two SSC at 18:00 UT on December 19 (DOY 353) with H=~110 nT and dH/dt=32 nT/min; and another at 22:00 UT on December 19 with H=~116 nT and a rate dH/dt=10 nT/min. Its main phase started during December 20 (DOY 354) and peaked around 22:00 UT that same day, with H=-219 nT and dH/dt=~-12 nT/min. Then, the geomagnetic component values increased slowly until December 23 (DOY 357). Also, Fig. b5 exhibits the contrast of records between the geomagnetic field measured by SER and the Dst index reported by WDC. Here Dst index shows a minimum of -155 nT at 22:00 UT on December 20 (DOY 254), and similar behavior as H component.
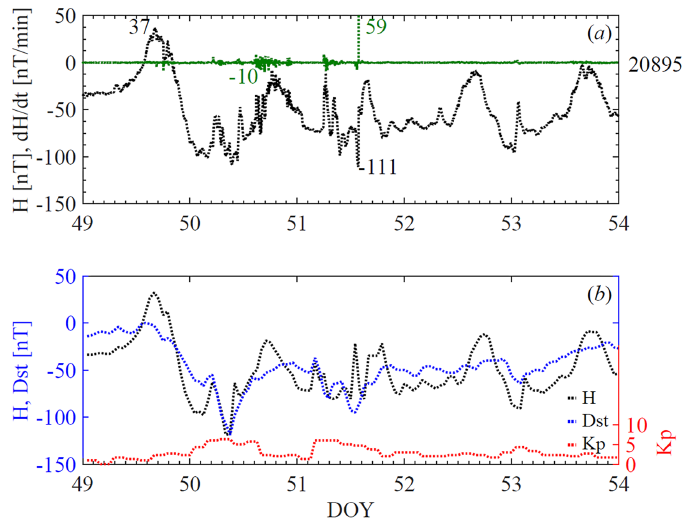
Figure 5 Geomagnetic field variations during the December 19-22, 2015, storm (I3) recorded by SER. The description of this Figure is similar to Fig. 3.
February 18 (2014) Storm
A graphical description of the February 18-22, 2014, storm appears in Figure 6. This Figure details two successive storms that hit the Earth's magnetosphere, recorded by the H component of the geomagnetic field (at 1 min resolution) in SER. Fig. 6a shows the positive values on the H component of the geomagnetic field with amplitude H=37 nT at ~14:00 UT marking the SSC that started the first storm on February 18 (DOY 49). This manifests with a rate dH/dt=~5 nT/min. The peak of this first event (H=-109 nT) was observed at ~09:00 UT on February 19 (DOY 50) with a rate dH/dt=6 nT/min. The second event started ~04:00 UT on February 20 when this storm's main phase started a two-step development and registered rate dH/dt=-10 nT/min. On February 20 (DOY 51), the H component dropped to -111 nT at ~12:30 UT but recovered rapidly to ~25 nT and fell again to -58 nT at 02:00 UT on February 22. Besides, contrasting these observations with the ones provided for the Dst index from WDC, shows the same behavior as the H component with a minimum Dst=-119 nT during the first storm (DOY 50) and another minimum of -95 nT for the second storm on February 20 (DOY 51) as in Fig. 6b.
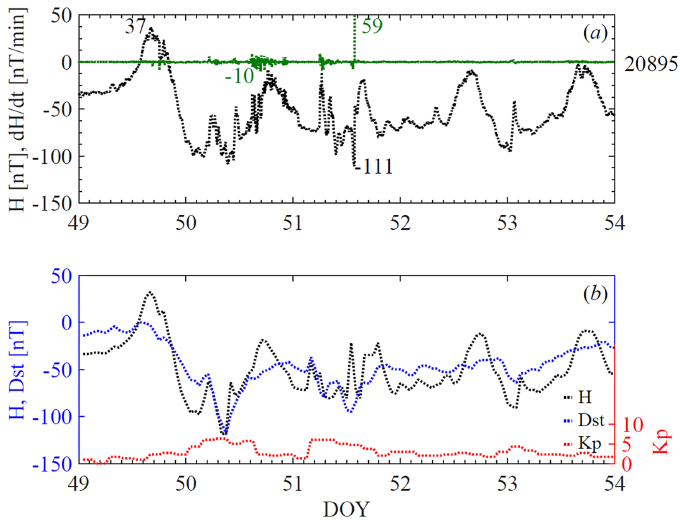
Figure 6 Geomagnetic field variations during the February 18-22, 2014, storm (I4) recorded by SER. The description of this Figure is similar to Fig. 3.
December 31 (2015) Storm
Figure 7 shows the graphical description of the December 31, 2015-January 02, 2016 storm using the H component of the geomagnetic field recorded by SER at 1 min resolution. In Fig. 7a, successive positive H component values evidence two SSCs measured at ~12:00 UT and ~16:00 UT on December 31 (DOY 365) during the initial phase of this storm. The maximum amplitude of SSC was H=49 nT, with a rate dH/dt=~10 nT/min. The peak of the storm with H=-148 nT occurred at ~00:30 UT on January 01, marking the end of its main phase. After this peak, geomagnetic field values increased slowly during its recovery phase. In addition, Fig. 7b shows the H component of the geomagnetic field taken from SER, and the Dst index taken from WDC at 1h resolution. As is observed, a good correlation between Dst index and H component of the geomagnetic field emerges. Here, the SSC peak in the initial phase (DOY 365), and the minimum Dst index value of -110 nT observed at 00:00 UT on January 01 during the main phase are in agreement with those recorded by the H component in SER.

Figure 7 Geomagnetic field variations during the geomagnetic storm on December 12, 2015-January 01, 2016 (I5) recorded by SER. The description of this Figure is similar to Fig. 3.
Discussion
The previous section showed that the instrument seems to be working as expected. The SER detected the five geomagnetic storms and showed a good correlation with the Dst index variations reported by WDC. (see Figs. 3 to 7). In terms of H component, the records obtained by SER can characterize all storm phases, such as the higher H values in the initial phase, followed by the dropped ones of the H component during the main phase, and its restitution to normal levels in the recovery phase. Also, the SSC signatures were evidenced with the rates dH/dt, because they are powerful indicators of disturbances in the ring current (Doumbia et al., 2017).
Table 2 shows the correlation coefficient (R) between the hourly Dst index and the geomagnetic field H-component (at 1h resolution) obtained for each storm analyzed (see columns 3 to 6). For total storm disturbance Rstorm, only storm I4 shows Rstorm<0.8 while all others show Rstorm from 0.85 to 0.96. When analyzing the R values for the different storm phases, both the initial and main phases present Rinitial and Rmain from 0.8 to 0.97, while the recovery phase shows Rrecovery from 0.5 to 0.94 being the lowest value for storm I4. In general, the measurements of the H component of the geomagnetic field recorded by SER show minor discrepancies with the storm behavior described by the Dst index. Note that the Dst index is an average obtained from different stations. The behavior of individual stations is expected to vary with respect to global value, and the local site response is the important one for each region, but also this discrepancy can be associated with phenomena that contribute to the H component variation, such as (1) the magnetopause current, (2) the symmetric ring current, (3) the cross-tail current, and (4) the partial ring current (Maltsev, 2004). To distinguish the action of these magnetospheric currents on the selected storms, we have represented the time at which the minimum Dst value occurs for each storm. Figure 8 shows the graphical representation of the instant of the minimum Dst at UT and magnetic local time (MLT). In this Figure, the Earth is represented from the North Pole as follows: day side-night side, and dawn-dusk sectors, with the UT represented by the inner circle and the MLT by the outer one. To clarify, the MLT in SER at UT noon is 16:00 MLT. As is observed, storms I1 and I3 measured the maximum depression of the H component at 18:00 MLT (but on different dates), and as both have an SSC, they developed the initial and main phases in the dusk zone. In the zone between dusk and midnight, storms I2 and I5 (at 20:00 and 00:00 MLT, respectively) developed both their initial and main phases, and a few hours later their recovery phase went toward the day side. Storm I4 developed the initial and main phases in the midnight-dawn zone at 04:00 MLT, and its recovery phase also began more on the day side. Contrasting the analyses in Table 2 and Figure 8, we notice that the observations recorded by SER agree with Li et al., 2011, who researched the distribution of the H depressions with magnetic local times (MLT). They proposed that in the ring current injection that occurs during a geomagnetic storm, the particles are mostly present between dusk and midnight sectors, with drifting toward dusk, and producing a highly asymmetric geomagnetic disturbance with MLT. Then, for the storms analyzed, the partial ring current in the dusk sector is the predominant contributor to the depressions of the H component during the main phase, as the higher R values between the Dst index and H component prove during the initial and main phases of storms I1, I2, I3, and I5. Weak H varitions affected storm I4 in the dawn sector, so the storm obtains lower R values during the initial and main phases. For the recovery phase, the dawn-dusk asymmetry of the H component weakens gradually until it disappears when values return to normal.
Table 2 Summary of correlation coefficients (R) obtained between Dst index (taken from WDC Kyoto) and H component (recorded by SER) for the phases of each storm studied (columns 3 to 6). In addition, the signs for the difference between their minimum magnitudes, and for its time difference are included in columns 7 and 8, respectively.
| Code | Storm | Correlation coefficients between Dst and H |
Δ = Dst - H | |||||
|---|---|---|---|---|---|---|---|---|
| Rinitial | Rmain | Rrecovery | Rstorm | Δmagnitude | Δtime | |||
| I1 | 2015/03/17‒2015/03/21 | 0.970 | 0.975 | 0.944 | 0.951 | + | + | |
| I2 | 2015/06/22‒2015/06/24 | 0.957 | 0.959 | 0.902 | 0.902 | + | + | |
| I3 | 2015/12/19‒2015/12/22 | 0.838 | 0.865 | 0.852 | 0.855 | + | + | |
| I4 | 2014/02/18‒2014/02/22 | 0.917 | 0.879 | 0.504 | 0.717 | - | - | |
| I5 | 2015/12/31‒2016/01/01 | 0.808 | 0.806 | 0.940 | 0.860 | + | + | |
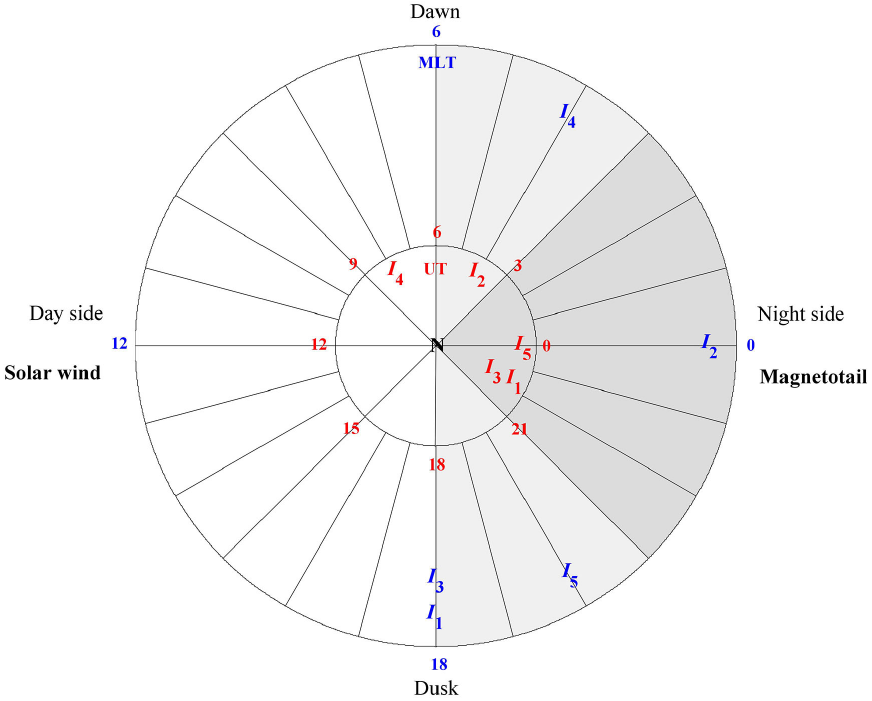
Figure 8 Location of geomagnetic storms studied at the time of their occurrence as a graphical representation of the maximum depression of H component (or the minimum Dst) at UT (the inner circle) and MLT (outer circle). Here, grey sectors represent the night side and white sectors the dayside. Regions of currents are the magnetotail electrojet on the night side, the dawn, the dusk, and the dayside.
Besides, to distinguish the action of the ionospheric currents on the selected storms, we have calculated the difference between the minimum magnitudes of Dst index (taken from WDC) and H component in SER, and the time difference at which this minimum magnitude occurs (see Table 2, columns 7 and 8, respectively). Thus, a negative (positive) Δmagnitude indicates that the minimum magnitude is a little higher in SER than in the Dst index (or it is greater in the Dst than SER); and a negative (positive) Δtime means that the minimum magnitude appears first in SER and afterward in the Dst index (or first in the Dst index than SER). As is shown, the storms I1, I2, I3, and I5 (located from dusk till pre-dawn sectors in the night side) exhibit positive values for both differences, so they occur earlier and with greater intensity in SER than in the Dst. These results show that during the ring current injection of these storms, the ions were mostly present in the dusk and pre-midnight sectors (see examples in Li et al. 2011). In addition, these storms were located near the magnetotail zone just when the electrojet was injected directly into the ring current (see examples in Martínez-Bretón et al., 2016). However, only I4 (located in the dawn sector) presents negative values in both differences so it happens earlier and with greater intensity in the Dst than SER. This fact can be influenced by a dawn current just in the transition to dayside (Martínez-Bretón et al., 2016), and by the equatorial electrojet, which is very strong during the daytime (Kalegaev et al., 2008). As storm I4 shows low correlation coefficients (relative to the Dst index), we compare our data with the data recorded by Jataí station JAT, in Brazil, from EMBRACE array (Denardini et al., 2018) to discard any malfunction of our instruments (see Figure 9). This analysis show correlation coefficient values of R>0.9 for all phases of the storm. Note that a similar comparison was made for all storms studied, and for all cases, the correlation coefficient values were more than 0.9. In general, all our data and results are consistent with the strong influence of the magnetospheric/ionospheric current systems over the H component during an intense geomagnetic storm.
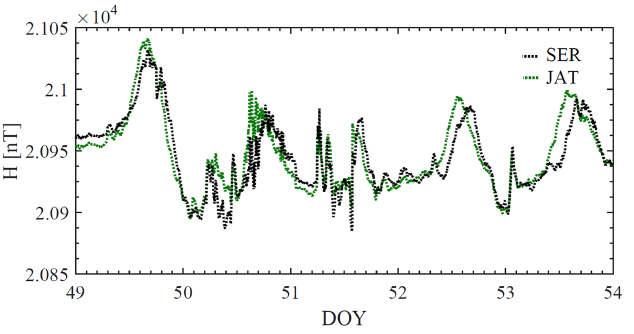
Figure 9 Comparison between the H component data recorded by SER and JAT stations (with geomagnetic latitudes of -16.55° and -12.3°, respectively) during the February 18-22, 2014, storm (I4). JAT station is located in Brazil (17.9°S, 51.7°W) and is part of the EMBRACE array.
On the other hand, Häkkinen et al. (2003) investigated the daily and seasonal variability of the H component using time series of magnetometer data taken from official Dst stations. They demonstrated that only ~50% of this variability can be explained by three external drivers of geomagnetic activity, such as the heliographic latitude, the equinoctial effect, and the Russell-McPherron effect. Therefore, they suggested that the other 50% of the daily and seasonal variability could be explained by the distribution of the hemispheric stations. Note that the distribution is key because the hemispheric asymmetry of the geomagnetic field (that is mainly evidenced for the field minimization at the South Atlantic Magnetic Anomaly) can cause N-S amplitude differences without a specific annual pattern and randomly distributed over time (Pinto et al., 1992). Thus, both the installation and management of southern magnetic ground stations such as SER according to modern standards are crucial for monitoring magnetospheric disturbances and other related phenomena.
Also, it should be noted that this work aims to show the measurements of a new geomagnetic station in the South American region and to compare their signatures concerning the global Dst index. However, it must be remembered that each local magnetic signature is unique, and the global index is obtained from the average of some of these. Saiz et al. (2021) showed that is possible to miss hazardous space weather disturbances using the global Dst index, and that large negative H peak recorded at any geomagnetic station might disappear in the average of the H-component from the global index observatories. Also, they proposed that the assessment of extreme events should be based on local records instead of the commonly used global indices. For this, the operation of new magnetometers for the South American region is good news to have better regional coverage of space weather events and to understand the particular characteristics of the Chilean region.
Finally, we declare that the geomagnetic field data SER recorded are consistent with the Dst index variations reported, and were obtained according to modern standards for magnetic stations. The University of La Serena's Laboratory for Space and Atmospheric Physics (LAFESAT) has developed quality infrastructure that guarantees SER's correct operation. For interested researchers, SER has recorded geomagnetic field data uninterrupted from late 2013 to now, which are available on the SAMBA website (http://magnetometers.bc.edu/). SER constitutes a new in situ tool of a low-latitude ground-based station that can contribute to magnetospheric research.
Conclusions
We studied five intense geomagnetic storms during the maximum phase of solar cycle 24 by using ground-level magnetic field data reported by the La Serena low-latitude magnetic ground station.
Based on the results and discussions in this study, these main conclusions obtain: (i) Due to the complexities of magnetospheric research, the installation and management of new magnetic ground stations according to modern standards is crucial. In response to development of new in situ tools and ground-based data sets that facilitate these studies, the records generated by the La Serena low-latitude magnetic ground station to describe magnetospheric disturbances and other related phenomena are available; (ii) Results evidence that H component variations measured by the La Serena station are consistent with the Dst index variations reported for each storm analyzed, obtaining correlation coefficient values of up to 0.97 for storms with Dst<-200 nT; (iii) The partial ring current in the dusk and night side sectors are the predominant contributor to the depressions of the H component during the main phase of the storms analyzed; (iv) Geomagnetic field values recorded by the La Serena station are useful in studies related to geomagnetic activity and reliable because the University of La Serena's Laboratory for Space and Atmospheric Physics (LAFESAT) has developed quality infrastructure that guarantees correct operation.

