


 nueva página del texto (beta)
 Inglés (pdf)
 Artículo en XML
 Referencias del artículo
 Enviar artículo por email
 Citado por SciELO
  Similares en
SciELO
Similares en
SciELO 
 Permalink
Introduction
Antarctica has endured repeated ice sheets since the Cenozoic, while continuous glaciations have been experienced in the Northern Hemisphere since the beginning of the Pliocene (Wilson et al., 2012). Therefore, broad areas are now covered with glacially deposited sediments. Populations settled in such areas, mainly in the northern hemisphere, obtain water from, and place waste in these sediments (Stephenson et al., 1988). Consequently, knowledge of the different mineral lithotypes, and therefore, the lithology present in these geological materials is important for both the development of engineering projects and for geophysical assessments. Despite their significance, there is a scarcity of information about their lithological features since such sediments are frequently located in remote areas (Brink & Jarrard, 1998; Niessen & Jarrard, 1998; Niessen et al., 1998) making it difficult to obtain appropriate geophysical data sets used to describe the lithology of these sediments. In this sense, we make use of the existence of density and velocity core log data obtained from the AND-2A to assist in identifying lithology using ternary Rock Physics Templates. RPTs are built using rock physics modelling with the purpose of relating the physical properties of rocks to their particular geological features and to identify fluid content (Close et al., 2012). Here, we attempt to use ternary mineral RPTs to relate the AND-2A drillcore’s elastic properties to mineral lithotypes (mineral assemblage facies), and then to lithology. The AND-2A drillcore was obtained by the ANtartic DRILLing project (ANDRILL) as part of the Southern McMurdo Sound Project (SMS) (Florindo et al., 2008-2009). Drilling started over a sea ice platform (8.5 m thick) while lying on the surface of a 380 m seawater column and finished at 1138 meters beneath the seafloor [mbsf] (Wonik et al., 2008-2009). The elastic properties corresponding to the AND-2A drillcore that are used in this contribution are the ρWBD and the VP core log data, while the ternary mineral diagrams are generated from a micromechanics SC modelling using the scheme implemented by Sabina and Willis (1988). This SC scheme seeks to compute the effective elastic properties of a heterogeneous isotropic rock composite assuming that the composite contains an isotropic mineral matrix embedded with n isotropic inclusions (minerals and the fluid that saturates the porous space of the rock). As such, in our case, the heterogeneous isotropic composite represents the AND-2A drillcore. This SC approach has been already implemented to calculate the elastic properties of gas-oil shale systems (Valdiviezo-Mijangos & Nicolás-Lopez, 2014; Nicolás-López & Valdiviezo-Mijangos, 2016; Lizcano-Hernández et al., 2018; Nicolás-López et al., 2020; López-Lena-Estrada et al., 2021), to compute the elastic properties of shale rock samples from diverse geological origins (Nicolás-López et al., 2019) and, to estimate attenuation effects and dispersion of velocities on sandstones saturated with brine (Valdiviezo-Mijangos et al., 2020).
The ternary mineral RPTs that we used here to study the AND-2A drillcore were built in terms of the elastic properties of mixed clays, quartz, and calcite. We chose these minerals because the AND-2A drillcore mainly contains siliciclastic sediments consisting of diamictite [a poorly sorted sedimentary rock, characteristic of glacial sediments that contain clasts of various sizes ranging from clay to boulders embedded in either a sand or mud matrix], sandstones, and mudstones which are cemented by calcareous minerals (Fielding et al., 2008; Hunze et al., 2013; Iacoviello et al., 2015). Furthermore, smectite and illite are the main clay minerals present along the drillcore with a minor presence of kaolinite and chlorite (Iacoviello et al., 2012). We also consider that the rock’s porous space is brine saturated. As such, brine is considered as an inclusion form.
In the next section, a summary of the SC method is first given, followed by a description of the methodology used to obtain the core logging data from the AND-2A drillcore. Results are then compared to the lithology interpreted from the implementation of Gardner-type density-velocity cross plots (Gardner et al., 1974). Results from SC and Gardner methods are also compared to the lithology reported by Fielding et al. (2008) and with the visual description of six selected rock specimens that were trimmed off the AND-2A drillcore at different depths.
Methods
Self-Consistent method
In the SC scheme proposed by Sabina and Willis (1988), the effective elastic properties of the AND-2A drillcore such as both the bulk and the shear moduli, κ eff and μ eff , and the wet bulk density ρ WBDeff can be modelled using the following equations:
In equations (1) through (3), κ n+1 , μ n+1 and ρ n+1 are respectively both the bulk and shear moduli and the density of the mineral matrix while the bulk modulus, the shear modulus, the density and the volume fraction for a given inclusion r are represented by κ r , μ r , ρ r and αr where r=1,2,…,n. If the volume fraction of the mineral matrix is represented by α n+1 , then it follows that
Later, equation (4) can be rewritten as follows:
Table 1 Physical properties of the minerals and the fluid used as input in the SC modelling (Mavko et al., 2009): * values for mixed clays, ** values calculated at atmospheric pressure, at 20 °C and 3.5% salinity.
| Mineral or fluid | ρr [gr/cm3] | Vpr [km/s] | Vsr [km/s] |
|---|---|---|---|
| Clays | 2.6* | 3.41* | 1.63* |
| Quartz | 2.65 | 6.05 | 4.09 |
| Calcite | 2.71 | 6.64 | 3.44 |
| Brine | 1.02** | 1.52** | ------ |
AND-2A Drillcore Settings: Physical Characteristics
Core logging data includes the wet bulk densities ρWBD and the compressional wave velocities Vp that were estimated with the Geotek Multi-Sensor Core-Logger (MSCL) system [http://www.geotek.co.uk/].
Compressional travel times were measured across the core diameter by leading the AND-2A drillcore through a couple of pulser-receiver P-wave Acoustic Roller Contact (ARC) piezo-electric ceramic transducers (230 kHz of central frequency). The core diameter was determined by the displacement of the acoustic rollers as they travelled over the core. This technique allows the estimation of Vp profiles by dividing the measured travel times by the measured core diameter [see Dunbar et al. (2009) for additional details].
Then, a pair of 137Cs gamma-ray γ source and detector mounted across the drillcore provide a core wet bulk density ρ WBD profile. Briefly, gamma rays travelling through the composite lose energy as they are dispersed by the electrons present in the medium. The latter leads to the detected radiation being diminished. This energy loss can be associated with the density of the electrons ρ e that correspond to the detected gamma-ray beam as follows:
where the atomic number Z and the molecular weight A of the medium can be taken as
Results and discussion
Figure 1(a) portrays density-velocity ternary mineral RPTs built by using the SC method. In these RPTs, the upper triangle is representative of a solid heterogeneous rock
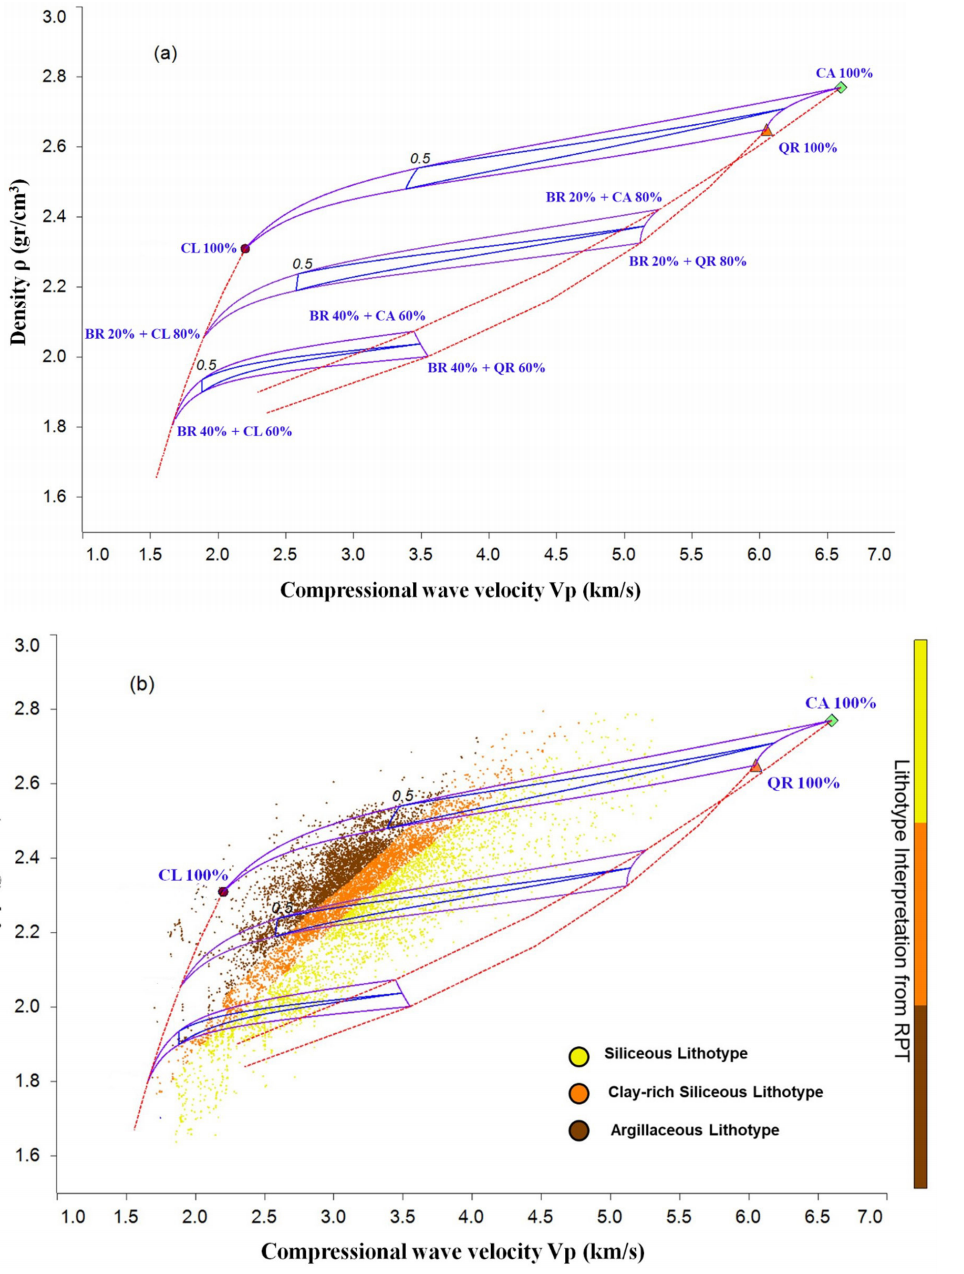
Figure 1 (a). Density - velocity ternary mineral RPTs built from the SC approach to model the AND-2A drillcore’s elastic response. These RPTs integrate the mineralogy and the brine saturation at 0%, 20% and 40% void fractions resulting in vertices for the upper triangle defined as CL100% (clay), CA100% (calcite), and QR100% (quartz) while the vertices of the middle and lower triangles are defined as BR20%+CL80%, BR20%+CA80% and BR20%+QR80%; and BR40%+CL60%, BR40%+CA60% and BR40%+QR60% respectively. (b) AND-2A drillcore’s mineral lithotype interpretation using the RPT portrayed in Figure 1(a). The volume fractions corresponding to the vertices of middle and lower are not shown to improve visualization of the data points. The lithotype zones are related to the mineral elastic response. Three mineral lithotypes are identified: argillaceous lithotype, clay-rich siliceous lithotype and siliceous lithotype.
Figure 1(b) displays the full AND-2A drillcore log data overlapped on the ternary mineral RPTs shown in Figure 1(a). Our mineral lithotype interpretation is carried out in terms of the areas related to the elastic responses of the minerals. In this sense, we identify in Figure 1(b) the following mineral lithotypes: argillaceous lithotype, clay-rich siliceous lithotype and siliceous lithotype (Gamero-Diaz et al., 2013). Note that the contribution of calcite to the observed elastic properties of the drillcore is negligible, as also pointed out by Staudigel et al. (2018) where calcite was found to be a rare constituent of the lithology of the AND-2A instead of occasionally appearing as veins or pore-filling cement.
Also, note that, while mineral ternary diagrams attempt to model the AND-2A drillcore’s elastic response considering the presence of mixed clays, quartz and calcite, the data points lying outside the ternary mineral RPTs could indicate intervals with the presence of minerals whose elastic properties may be significantly different from mixed clays, quartz and calcite, since most rocks are made up of more than three dominant minerals. However, observed high V p (≥ 4.5 km/s) and ρ WBD (≥ 2.6 gr/cm3) in glacial sediments can also be related to the existence of large lonestones (Niessen & Jarrard, 1998; Niessen et al., 1998).
Figure 2 portrays a log density- log velocity cross plot showing the lithotype interpretation of the AND-2A drillcore data carried out by using the relationship between density (ρ) and compressional velocity (V P ) proposed by Gardner (Gardner et al., 1974)
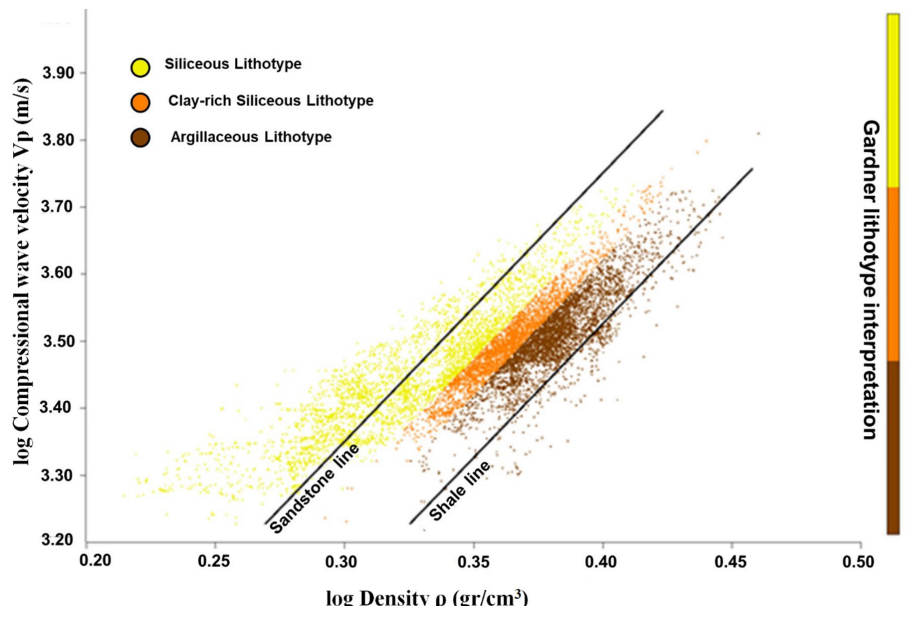
Figure 2 Lithotype interpretation of the AND-2A Drillcore by using Gardner type density-velocity cross plots. This figure shows the shale line, ρ= 1.75V P 0.25 , which defines points with high clay content, while the sandstone line, 𝜌=1.66 𝑉 𝑃 0.25 represents points with high quartz content. In this image, three mineral lithotypes are also identified: argillaceous lithotype, clay-rich siliceous lithotype and siliceous lithotype.
Typical values for coefficient α are α = 1.66 for sandstones and α = 1.75 for shales (Mavko et al., 2009). Thus, the shale line,

Figure 3 This figure shows the mineral lithotype sequences of the AND-2A drillcore identified from the interpretation of Figures 1 (b) and 2 along with the depth intervals related to the fourteen LSUs covering the AND-2A. The red markers indicate theposition in depth of the six selected samples.
Table 2 The lithological description of the AND-2A obtained from SC and Gardner methods compared to the main lithologies along the LSUs reported by Fielding et al. (2008).
| Lithologies | ||||
|---|---|---|---|---|
| LSU | Depth interval (mbsf) |
Self-Consistent | Gardner | Fielding et al 2008 |
| 2 | 37.07 - 98.47 | Mainly siliceous rocks with interbedded clay-rich siltstones and argillaceous rocks | Mainly siliceous rocks with the sparse presence of clay-rich siltstones and argillaceous rocks | Sandy diamictite interbedded with sandstone, siltstone and sandy conglomerate |
| 3 | 98.47 - 122.86 | Mainly siliceous rocks with interbedded clay-rich siltstones and argillaceous rocks | Mainly siliceous rocks with the sparse presence of clay-rich siltstones and argillaceous rocks | Sandstone and sandy conglomerate |
| 4 | 122.86 - 224.82 | Mainly siliceous rocks with intervals containing clay-rich siltstones and argillaceous rocks | Mainly siliceous rocks | Sandy to silty diamictite, sandstone and siltstone |
| 5 | 224.82 - 296.34 | Argillaceous rocks and minor siliceous rocks | Argillaceous rocks with minor siliceous rocks and clay-rich siltstones | Muddy and sandy diamictite, sandstone |
| 6 | 296.34 - 339.92 | Argillaceous rocks and siliceous rocks with minor clay-rich siltstones | Argillaceous rocks and siliceous rocks with minor clay-rich siltstones | Muddy diamictite, fine-grain sandstone, siltstone and claystone |
| 7 | 339.92 - 436.18 | Siliceous rocks and argillaceous rocks with minor clay-rich siltstones | Siliceous rocks and argillaceous rocks with minor clay-rich siltstones | VB sandy diamictite and volcanic-bearing sandstone |
| 8.1 | 436.18 - 502.69 | Interbedded sequences of argillaceous rocks, siliceous rocks and clay-rich siltstones | Argillaceous rocks interbedded with clay-rich siltstones | VB mudstone, sandstone and muddy diamictite |
| 8.2 | 502.69 - 544.47 | Interbedded sequences of argillaceous rocks, siliceous rocks and clay-rich siltstones | Argillaceous rocks interbedded with clay-rich siltstones | VB muddy diamictite, mudstone and sandstone |
| 8.3 | 544.47 - 579.33 | Siliceous rocks interbedded with argillaceous rocks and clay-rich siltstones | Siliceous rocks interbedded with argillaceous rocks and clay-rich siltstones | VB sandstone, mudstone and sandy diamictite |
| 8.4 | 579.33 - 607.35 | Siliceous rocks and argillaceous rocks interbedded with clay-rich siltstones | Argillaceous rocks with minor presence of limestone | VB muddy diamictite, siltstone and sandstone |
| 9 | 607.35 - 648.74 | Mainly clay-rich siltstones with minor presence of siliceous rocks and argillaceous rocks | Mainly siliceous rocks and clay-rich siltstones | VB sandstone and siltstone |
| 10 | 648.74 - 778.34 | Interbedded sequences of argillaceous rocks, siliceous rocks and clay-rich siltstones | Mainly argillaceous rocks, limestones and minor presence of siliceous rocks | VB sandy diamictite, silty sandstone and mudstone |
| 11 | 778.34 - 904.66 | Mainly siliceous rocks and clay-rich siltstones with a minor presence of argillaceous rocks | Mainly siliceous rocks and clay-rich siltstones with a minor presence of argillaceous rocks | Sandy siltstone and sandstone |
| 12 | 904.66 - 996.69 | Interbedded sequences of siliceous rocks and clay-rich siltstones with minor argillaceous rocks | Prevalence of argillaceous rocks interbedded with clay-rich siltstones. Minor presence of siliceous rocks | Sandy diamictite, silty sandstone and mudstone |
| 13 | 996.69 - 1040.28 | Mainly argillaceous rocks interbedded with siliceous rocks and clay-rich siltstones | Mainly argillaceous rocks and with minor presence of clay-rich siltstones and sands | Siltstone, sandy mudstone and muddy sandstone |
| 14 | 1040.28 - 1138.54 | Prevalence of clay-rich siltstones and siliceous rocks | Prevalence of clay-rich siltstones and siliceous rocks | Sandy diamictite and sandstone |

Figure 3 This figure shows the mineral lithotype sequences of the AND-2A drillcore identified from the interpretation of Figures 1 (b) and 2 along with the depth intervals related to the fourteen LSUs covering the AND-2A. The red markers indicate theposition in depth of the six selected samples.
Figures 4 and 5 present photographs and thin sections of six selected samples obtained from the AND-2A. These samples are labelled in terms of the depth interval [mbsf] where they were located and they were chosen as being representative of the fine to coarse grain textures found along the three different geological ages of the AND-2A Drillcore (Acton et al., 2008): lower Miocene (1138.54 to 800 mbsf), middle Miocene (800 to 223 mbsf), and upper Miocene to more recent intervals (223 to 0.0 mbsf). Table 3 shows the lithological visual description of these samples compared to the lithological features obtained from the SC and Gardner methods. Qualitative X-Ray Diffraction (XRD) analysis of these samples (see Table 4) show that their constituents minerals are quartz, clay minerals (illite and smectite), carbonates (siderite), calcium minerals (Phillipsite-Ca, Anorthite), feldspars (Orthoclase, Albite, Sanidine, Microline) and mica (muscovite).

Figure 4 a) Photograph and b) thin section of sample 94: This sample is identified as a sandy diamictite. Quartz minerals (QTZ) and volcanic clasts are shown embedded in a silty matrix. c) Photograph and d) thin section of sample 215: This sample mainly contains coarse sandstone with a minor presence of finer volcanic clasts. c) Photograph and d) thin section of sample 630: identified lithology corresponds to siltstone.
Table 3 Lithology from visual description, SC and Gardner methods of six selected samples cut at different depths along the AND-2A.
| Lithology | ||||
|---|---|---|---|---|
| Sample | Depth interval (mbsf) |
Description | Self-Consistent | Gardner |
| 94 | 94.16-96.41 | Sandy diamictite with a silty matrix | Siliceous rocks, clay-rich siltstone | Siliceous rocks |
| 215 | 215.48-215.57 | Coarse sandstone | Siliceous rocks | Siliceous rocks |
| 630 | 628.81-630.89 | Sandy mudstone (siltstone) | Clay-rich siltstone | Clay-rich siltstone |
| 749 | 747.45-749.9 | Silty Sandstone | Siliceous rocks, clay-rich siltstone | Siliceous rocks, clay-rich siltstone |
| 879 | 879.41-879.58 | Fine-grain sandstone | Siliceous rocks | Siliceous rocks |
| 974 | 974.1-975.42 | Silty sandstone | Siliceous rocks | Clay-rich siltstone |
Table 4 Mineral identification from XR.
| Mineral | |||||||||||
|---|---|---|---|---|---|---|---|---|---|---|---|
| Sample (mbsf) | Quartz | Illite | Smectite | Siderite | Phillipsite-Ca | Anorthite | Orthoclase | Albite | Sanidine | Microline | Muscovite |
| 94 | |||||||||||
| 215 | |||||||||||
| 630 | |||||||||||
| 749 | |||||||||||
| 879 | |||||||||||
| 974 | |||||||||||
From Tables 2 and 3, we can note that the reported lithology from both Fielding et al. (2008) and the six selected samples are consistent with the mineral lithotypes obtained from the SC and Gardner methods. Thus, siliceous rocks and clay-rich siliceous rocks (sandy diamictite, sandstone, siltstone) are prevalent in LSU 2 (37.07 - 98.47 mbsf), LSU 3 (98.47 - 122.86 mbsf) and LSU 4 (122.86 - 224.82 mbsf). These mineral lithotypes are also consistent with the lithology of samples 94 (sandy diamictite with a silty matrix) and 215, (coarse sandstone). On the other hand, LSU 5 (224.82 - 296.34 mbsf) and LSU 6 (296.34 - 339.92 mbsf) represent a transition from siliceous rocks to both argillaceous rocks and clay-rich siltstones, while siliceous rocks (mainly sandstones) are characteristic of LSU 7 (339.92 - 436.18 mbsf). LSU 8.1 (436.18 - 502.69 mbsf) and LSU 8.2 (502.69 - 544.47 mbsf) are dominated by argillaceous rocks and siliceous rocks (Volcanic-Bearing VB mudstone, sandstone, and muddy diamictite). However, LSU 8.3 (544.47 - 579.33 mbsf) and LSU 8.4 (579.33 - 607.35 mbsf) are mainly comprised of siliceous rocks (sandstones, sandy diamictite). A finer lithology arises at LSU 9 (607.35 - 648.78 mbsf) consisting of clay-rich siltstone and sandstone with minor mudstones. The lithology of sample 630, a clay-rich siltstone, agrees with these findings. Then, an assemblage of argillaceous rocks, siliceous rocks, and clay-rich siltstones were found in LSU 10 (648.74 - 778.34 mbsf). Indeed, sample 749, Figures 5 (a) and 5(b), a silty sandstone, is identified as a combination of clay-rich siltstone and a siliceous rock in Table 3. The LSU 11 (778.34 - 904.66 mbsf) mainly comprises siliceous rocks and clay-rich siltstones (sandy siltstone and sandstone). This lithology also agrees with the lithology of sample 879, a fine grain sandstone. LSU 12 (904.66 - 996.69 mbsf) contains interbedded sequences of clay-rich siltstones with minor mudstones. In particular, the lithology of sample 974, a silty sandstone, is related to the siliceous lithotype as portrayed in Figure 3. LSU 13 (996.69 - 1040.28 mbsf) shows a finer grain lithology than the previous LSU 12. In LSU 13, argillaceous rocks interbedded with clay-rich siltstones are prevalent. On the contrary, coarser grain lithologies such as siliceous rocks and clay-rich siltstones are present in LSU 14 (1040.28 - 1138.54 mbsf).
Conclusions
We have implemented a micromechanical SC modelling to generate density-velocity rock physics templates for the determination of mineral lithotypes on the AND-2A drillcore. Results show that calcite is an uncommon component of the lithology in the AND-2A as also reported by Staudigel et al. (2018). Instead, the identified mineral lithotypes correspond to the argillaceous lithotype, the clay-rich siliceous lithotype and the siliceous lithotype.
On the other hand, the mineral lithotype distribution identified by the ternary mineral RPT’s along the AND-2A drillcore is consistent with the interpretation that we obtained from the implementation of Gardner’s relationship. These results are also consistent with the main lithological features reported by Fielding et al. (2008). Furthermore, the lithology of the six selected samples can be directly correlated with the modelled mineral lithotypes. However, since these results attempt to assist in the characterization of glacial sediments, a more robust interpretation should include petrophysical and stratigraphic studies based on resistivity, neutron porosity, and gamma-ray borehole measurements which are commonly used to discriminate lithology. However, resistivity, neutron porosity, and gamma-ray data sets are less commonly available than density and velocity data sets. In this sense, the main advantage of RPT’s generated from SC modelling is that this approach can be used to identify mineral lithotypes in glacial formations merely from the rock’s elastic properties. In addition, any other combination of three minerals can be used. This is particularly useful since the physical properties of a variety of minerals are readily available in scientific literature.
Nevertheless, these results, as presented here, have the potential to add valuable information to the record of Antarctic glacial and geological history obtained from the AND-2A since variations in lithology can be used to describe paleoenvironmental and paleoclimatic changes as well as to identify source rocks (Iacoviello et al., 2012).

