


 nueva página del texto (beta)
 Inglés (pdf)
 Artículo en XML
 Referencias del artículo
 Enviar artículo por email
 Citado por SciELO
  Similares en
SciELO
Similares en
SciELO 
 Permalink
Introduction
Geoscientists use generally the geothermal and heat flow data to provide information on the temperature distributions within the earth and thermal evolution history of a sedimentary basin. The thermal history of a sedimentary basin is an important indicator of the organic compound maturity. The maturity of organic compound can be characterized and described as the gradual process, that includes the release of hydrocarbons from buried organic materials (Deming, 1994).
The amount of heat flow in a sedimentary basin has to be constrained with the radiogenic heat production to provide a better understanding of the total heat budget (Biicker and Rybach, 1996). Different researches have been attempted to explain the radioactive heat production distribution nature within the crust, particularly, along the exposed crustal cross sections that provided an excellent opportunity to get the various rock types constituting the crust (Ketcham, 1996; Kumar and Reddy, 2004; Brady et al., 2006).
The heat production is produced in the rocks through the decay of radioactive elements such as uranium, thorium and potassium. The heat production rate of a given rock can be therefore computed based on the concentrations of those radioactive elements and the density rocks (Rybach, 1988).
This paper aimed at using aerial gamma-ray spectrometric technique and its available data of equivalent uranium (eU) in ppm, equivalent thorium (eTh) in ppm, and equivalent potassium (K) in % to compute and map the radioactive heat production (HP) of the study Area-2 as a whole. The heat production parameter HP will be also characterized separately for different environments represented by the nine lithological scored units (Asfahani et al., 2018).
The airborne gamma-ray spectrometric technique has been already used in different worldwide areas to compute radioactive heat production of Gabal Duwi Area, Egypt (Salem et al., 2005), of Gabal Arrubushi area, Central Eastern Desert, Egypt (Yousef, 2016), in northern Palmyrides (Area-3) (Asfahani et al., 2016), and in Syrian Desert (Area-1), Syria (Asfahani, 2018-a).
The Concentration-number (C-N) model and the log-log plots related to fractal modeling technique ( Hassanpour and Afzal, 2013) is proposed and applied as a new approach to map the HP parameter for Area-2, and to isolate the HP anomalies from background. In fact, the boundaries of the distinguished radioactive ranges, derived by the fractal modeling technique coincide well with the geological boundaries. This coincidence gives this multi-fractal technique its advantages in comparison with other traditional statistical techniques.
The main objective of the present paper is:
to compute the statistical characteristics of the nine lithological scored units of Area-2 (Min, Max, Mean, standard deviation (σ), and coefficient of variability (CV%), for the parameters of total radioactivity (T.C) in Ur, eU, eTh, and K%.
to evaluate the radioactive heat production HP for Area-2 as a whole.
to characterize separately the heat production HP for different environments represented by nine outcropped scored lithological units, already distinguished by using the factor analysis technique (Asfahani et al., 2018).
to map the eU, eTh, K% and HP parameters for the Area-2 with the use of the proposed multi-fractal (C-N) modeling technique.
Methodology
The available data of airborne gamma-ray spectrometry is used in this paper to compute the HP of the Area-2. The fractal technique is used to map the different ranges of eU, eTh, K% and HP parameters.
Aerial Gamma Ray Spectrometry Technique
An airborne gamma-ray spectrometric survey for uranium exploration has been conducted in 1987 by the International Atomic Energy Agency and Riso National Laboratory during the project SYR/86/005 in Syria (Riso, 1987; Jubeli, 1990).
A nominal survey 30 m height at an average speed of 120 km/hr along parallel lines with a spacing of 3-4 km was used during this survey, in order to cover most of the interest areas in the Syrian territory. This aerial survey used a compact lightweight of four window gamma-ray spectrometer (Scintrex, GAD-6, Canada) with a 12.5 L (NaI) volume detector. The detector was maintained before the record of each mission, at a constant temperature with the gain stabilization. The system calibration took place at the calibration pads of the Dafa airport in Sweden (Riso, 1987). An efficient flight path control has been provided through using an IGI Loran-C navigation system, which defines and records automatically all waypoints and fiducials of flight tracks along the flight lines. Intervals of one second were used to record the raw data, corrected for background effects, and for the applicable inter-channel Compton corrections. Exponential attenuation factors for height corrections were established (Riso, 1987).
This airborne survey covered the following three areas shown in Fig.1(A and B):
The Syrian Desert (7189 line km at 4 km line spacing).
Ar-Rassafeh Badyieh (2240 line km at 4 km line spacing).
The Northern Palmyrides (1600 line km at 3 km line spacing).

Figure 1 (A) Total areas covered by airborne gamma-ray spectrometric technique and (B) total radiometric map (Ur) resulting from spectrometric survey (Riso, 1987)
During this survey, it has been observed that the highest gamma-ray anomalies measured are mainly associated with phosphate deposits encountered in Central Syria. A scored lithological map has been recently established through airborne gamma-ray spectrometric data of the Ar-Rassafeh Badyieh Area (Area-2) interpretation by using statistical factor analysis technique (FAT) (Asfahani et al., 2018), as has been already done for (Area-1), (Asfahani et al., 2015).
Radioactive Heat Production Estimation
Radioactive heat production (HP) of a given rock sample was computed by using an empirical relationship, given by the following expression (Rybach, 1976):
In which ρ is the dry density of rock (g/cm3)
The densities are acquired and estimated from web sites such as (http://www.engineeringtoolbox.com/mineral-density _1555.html, http://wiki.chemprime.chemeddl.org/index.php/Density_of_Rocks_and_Soils and http://www.engineering toolbox.com/density-solids-d_1265.html).
Equation (1) computes the energy released during alpha, beta, and gamma decay of the radioelements (Rybach, 1976 ; Birch, 1954).
The constant for uranium (0.0952) in Equation (1) is more than twice the constants for potassium (0.035) or thorium (0.026), meaning that uranium has a dominant role in producing heat compared with thorium or potassium. The dominant role of uranium is due to its alpha decay, which provides most of the radiogenic heat production (Birch, 1954).
Radioactive heat production has been also estimated from the concentrations of radioelements measured in the laboratory (Fernandez et al., 1998), and directly from the gamma-ray logs (Bücker and Rybach,1996; Asfahani, 2018-c). Besides, the radioactive heat production has been recently evaluated using the available data measurements of airborne gamma-ray spectrometric technique and applying the equation (1) (Richardson and Killeen, 1980; Thompson et al., 1996; Salem et al., 2005; Yousef, 2016; Asfahani et al., 2016; Asfahani., 2018-a).
As indicated by the equation (1), the radioactive heat production estimation in the present case study requires the knowledge of both density of the nine treated lithological scored units (Asfahani et al., 2018), and their available concentrations of eU, eTh, and K% obtained from the airborne gamma-ray spectrometric survey.
Fractal technique and C-N model
Models based on fractal geometry as a nonlinear mathematical science proposed by Mandelbrot (1983), have been hugely used in the recent years in different branches of earth sciences. Several fractal/ multifractal models have been recently proposed such as concentration-volume (C-V); (Afzal et al., 2011), concentration-distance (C-D); (Li et al., 2003), and concentration-number (C-N); (Afzal et al., 2012, Hassanpour and Afzal 2013), where those fractal models have been applied on 2D and 3D geophysical data.
In fact, the classical statistical methods for delineation the different geophysical populations from background such as histogram analysis, box plot, summation of mean and standard deviation coefficients and median are not accurate. Those traditional methods consider only the frequency distribution of information, while have no attention to spatial variability since the information about the spatial correlation is not always available (Afzal et al., 2010; 2012). Such classical statistical methods assume the normality or log-normality, and do not consider the shape, extent, and magnitude of the geophysical anomalous areas and disregard spatial distribution (Agterberg et al.,1995; Bíró et al., 2012; Shtiza and Tashko, 2009). Those inconveniences encourage the application of fractal models to isolate the geophysical anomaly from its background, as it will be done herein basically for equivalent uranium (eU) and heat production (HP) parameters.
Log-log plots are used while applying fractal models, where the straight line segments fitted the graphs have some break thresholds points (Zuo, 2011; Wang et al., 2011; Mohammadi et al., 2013; Afzal et al., 2017; Khalajmasoumi et al., 2015; Afzal et al., 2018; Daneshvar and Afzal., 2017).
C-N multifractal model is proposed and applied as a new approach to map the measured parameters of eU, eTh, K, and the computed HP for the study Area-2, and to distinguish between different ranges of radioactive anomalies. The same C-N multifractal model has been recently applied on aerial gamma-ray spectrometric data of Northern Palmyrides (Area-3), where useful radioactive isolation anomalies results have been obtained (Asfahani, 2018-b).
The mathematical expression of the Concentration-number (C-N) fractal model is given by the following equation (Mandelbrot, 1983; Hassanpour and Afzal., 2013; Sadeghi et al., 2012; Afzal et al., 2016):
where μ denotes the treated geophysical parameter values, which are in the present case study including eU (ppm), eTh (ppm), K (%) and HP (μw/m3).
N(≥μ) denotes the cumulative number of the treated geophysical data, which are the cumulative number of the measured equivalent uranium (CNeU), the cumulative number of the measured equivalent thorium (CNeTh), the cumulative number of the measured potassium (CNK%), and the cumulative number of the computed radioactive heat production (CNHP), with the geophysical parameter values greater than or equal to μ, F is a constant and D is the scaling exponent or fractal dimension of the distribution of geophysical parameter values.
General Setting of the Study Area (Area-2)
Topography
The study area is considered as a transition zone between the low-mountain and the flat country. This mountain series form the northern limit of Palmyride range (Jabal AL-Bishri), the relief grades east, northeast and southeastwards flood- plains, until it declines to Al-Furat river course in the north-east direction (out of the study area). The undulate sloping flood- plains are cut by many erosional valleys, where some of them are tectono-genetic (Technoexport, 1967, JICA 1996).
Stratigraphy
Cretaceous, Paleogene litho-facies crop-out, while the Neogene and Quaternary sediments cover vast area of wadis and low-lands and flood- plain terraces of the studied territory, Fig.2.
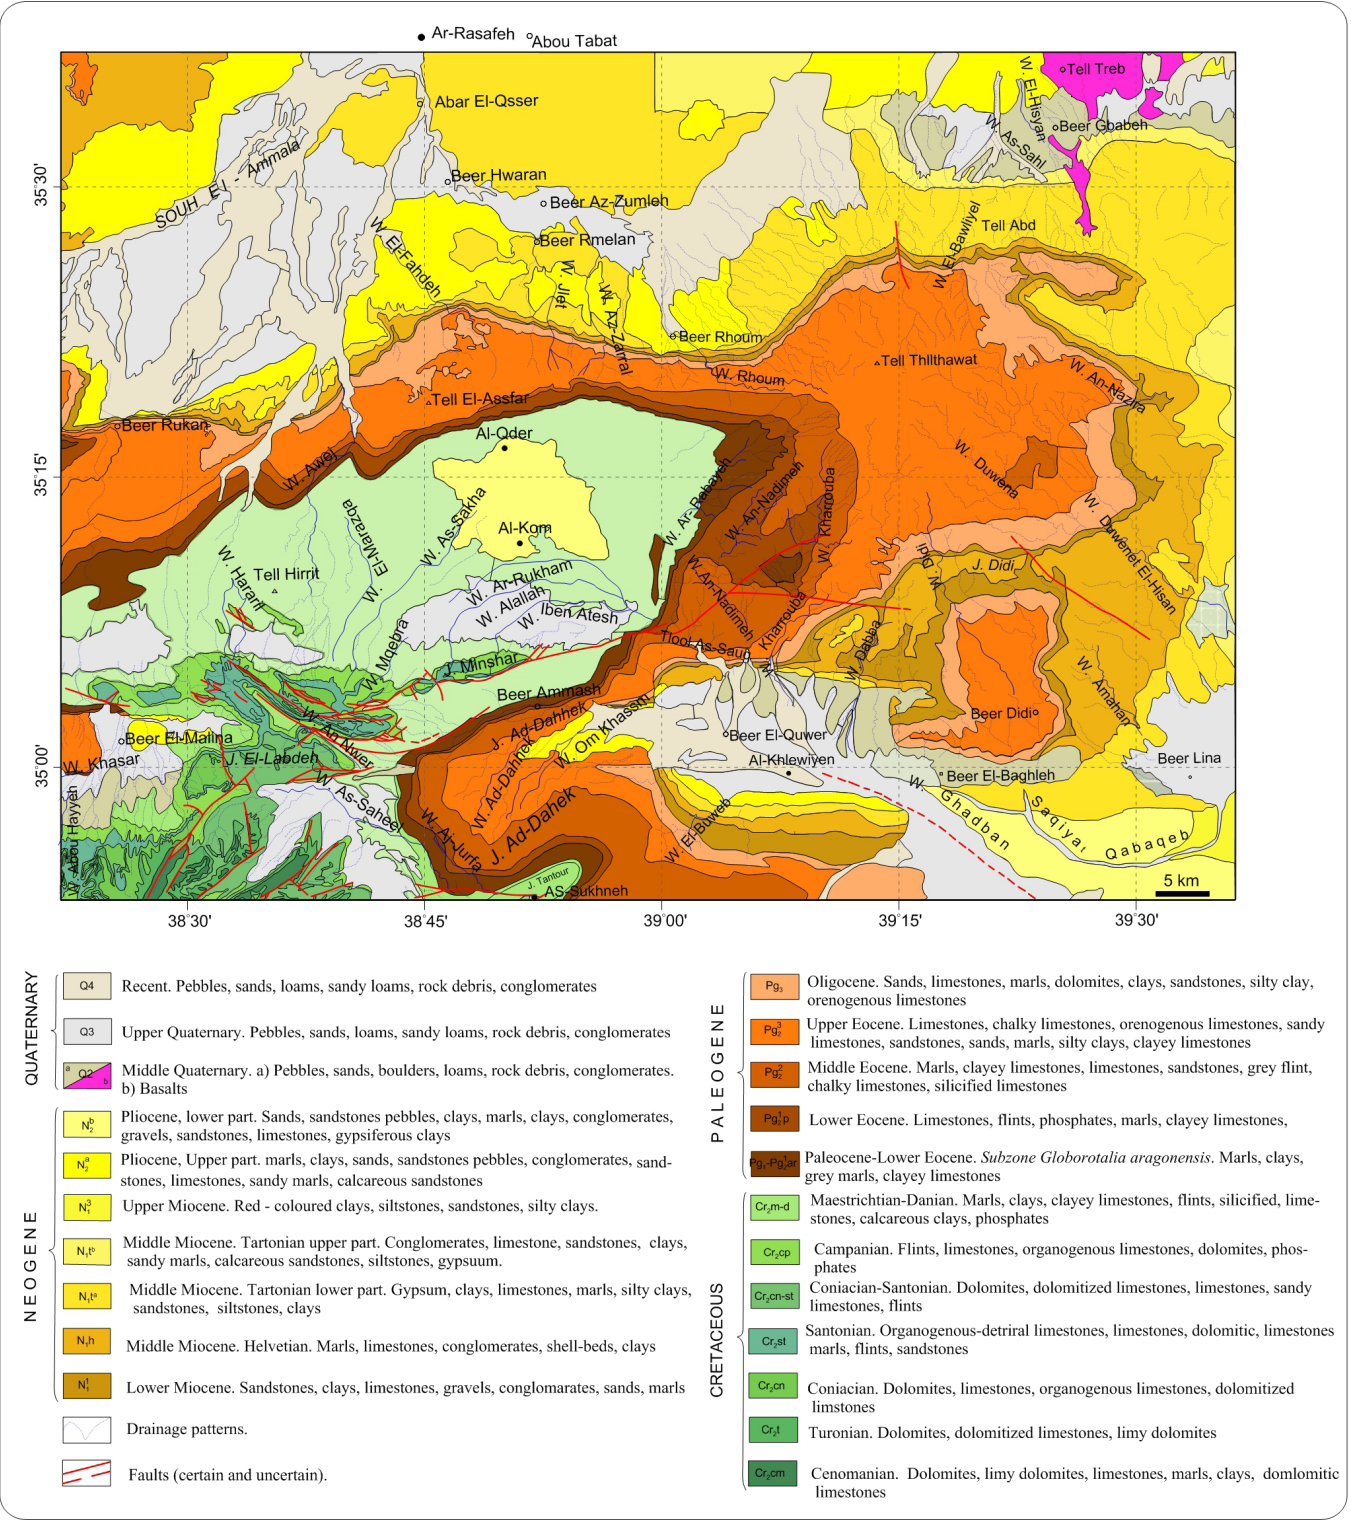
Cretaceous rocks units: The Cretaceous litho- facies are mainly represented by carbonate, marly- clayey limestone, dolomitic limestone, ferruginous sandy limestone organic limestone, phosphate with remnants of fish bones, and flint concretions and bands, sometimes bituminous limestone intercalations, Fig.2.
Paleogene rocks units: the boundary between Cretaceous and Paleogene litho-facies is not prominent. Paleogene outcrops are zonally distributed in the studied territory. It is dominated by the carbonate litho-facies such as clayey limestone, sandy limestone with bitumen occurrences, dolomite, organic limestone, chalky-like limestone, marl, glauconitic- phosphate beds and flint, which are occurred in most of the cross-sections of the studied territory. Those facies denote the palio-shoreline and deltas within littoral zone, Fig.2.
Neogene rocks units: Cover vast tracts of the marginal plains adjacent of Al- Bishri anticline. The lithofacies of Neogene (Technoexport 1967, JICA 1996) denote a continental conditions start with sandy- clayey silt, conglomerates and sandstone with carbonate cement, breccia- like limestone, organic limestone, and dolomite with bitumen and gypsum alternations, Fig.2.
Quaternary and recent rocks units: Eluviation, eolian sands, pebbles of various genetic types and evaporates (JICA 1996), Fig.2.
Tectonic
The study area is located in the mobile part of Arabian platform slope in the northern marginal zone Palmyride folding system (Dill, 2009; Technoexport, 1967) (Fig.2).
The study area is characterized as block folds, brachy-coffer anticlines, depressions, and regional deep faults. The Palmyride folding system is complicated by deep regional faults, which take north- eastern trend (JICA 1996, Litak et al., 1998). Faulted- flexures are also accompanied with coffer fold- axis.
Most of those mentioned structural features are not marked at the surface, but inferred from geophysical data.
Results and Discussion
Statistical factor analysis technique was already used to interpret aerial gamma-ray spectrometric data of Area-2, and to establish a scored lithological map for the study area (Asfahani et al., 2018) as shown and presented in Figure 3. The established scored map includes different geological environments, represented by nine different isolated rock units, that are regrouped mainly in three factors (F1, F2, and F3) groups.

The characteristics of those nine scored units are documented in the legend of Fig.3 and in Table 1.
Table 1 Characteristics of the nine lithological scored units identified on the scored map (Asfahani et al., 2018).
| Factor | Rock units | Environmental litho-facies description | Notices |
|---|---|---|---|
| F1 | A | Granular phosphate, fragmental, brecciated- phosphate. | F1 is called as phosphate-uranium factor. |
| B | Marly phosphate, calcareous- fissured phosphate covered by hydrous ferric oxide. | ||
| C | Calcareous glauconatic concretions, calcite- grains enclosed by glauconite. | ||
| F2 | D | Paleo-delta deposits, clayey sandstone, silty clay, sandy limestone, glauconatic sandstone. | F2 is called as littoral, paleo-delta and alluvium fans factor. |
| E | Volcanic extrusions and basalt sheets. | ||
| F | Valley- fill deposits, alluviums, debris, clayey limestone, dolomatic limestone. | ||
| F3 | G | Detrital, alluvium, conglomerates, limestone. | F3 is called as closed seasonal basin factor. |
| H | Sandy loam, fluvial sediments, lacustrine limestone, sands. | ||
| I | loam, clay, eluviation, eolian sand evaporates, and playa deposits. |
The statistical characteristics (Min, Max, Average, σ, and CV%) of those nine isolated lithological units for the four aerial radiometric variables (T.C, eU, eTh, and K%) in study Area-2 region are shown in Table 2. The normality distribution of the aerial measurements related to the nine lithological scored units is checked by the use of the coefficient of variability (CV) shown also in Table 2.
Table 2 Statistical characteristics of the 9 lithological units for 4 radiometric variables in the Syrian Desert area (Area-2).
| Litho. units | A (1246) | B (1970) | C (9977) | D (325) | ||||||||||||||||
|---|---|---|---|---|---|---|---|---|---|---|---|---|---|---|---|---|---|---|---|---|
| Variables | Min. | Max. | Mean | σ | CV% | Min. | Max. | Mean | σ | CV% | Min. | Max. | Mean | σ | CV% | Min. | Max. | Mean | σ | CV% |
| T.C | 2.30 | 17.11 | 7 | 1.99 | 28 | 1.93 | 8.89 | 5.47 | 0.96 | 17 | 0.23 | 8.36 | 4.57 | 1.14 | 25 | 0.89 | 5.18 | 3.1 | 0.80 | 26 |
| K % | 0.02 | 0.44 | 0.18 | 0.07 | 39 | 0.04 | 0.46 | 0.22 | 0.06 | 27 | 0.02 | 0.63 | 0.25 | 0.08 | 32 | 0.02 | 0.22 | 0.09 | 0.04 | 44 |
| eU | 1.77 | 13.6 | 4.7 | 1.54 | 33 | 1.48 | 4.30 | 2.99 | 0.38 | 13 | 0.16 | 3.29 | 1.67 | 0.56 | 33 | 0.16 | 3.34 | 0.99 | 0.55 | 55 |
| eTh | 0.19 | 4.95 | 2.12 | 0.82 | 39 | 0.33 | 5.59 | 2.45 | 0.76 | 31 | 0.17 | 6.94 | 2.97 | 01.02 | 34 | 01.07 | 6.29 | 3.65 | 0.99 | 27 |
| Litho. units | F (14448) | G (1170) | ||||||||||||||||||
| Variables | Min. | Max. | Mean | σ | CV% | Min. | Max. | Mean | σ | CV% | Min. | Max. | Mean | σ | CV% | |||||
| T.C | 1.18 | 7.37 | 3.6 | 0.88 | 24 | 0.56 | 7.38 | 3.69 | 0.88 | 24 | 4.98 | 12 | 7.26 | 0.67 | 9 | |||||
| K % | 0.04 | 0.41 | 0.17 | 0.05 | 29 | 0.06 | 0.75 | 0.25 | 0.07 | 28 | 0.28 | 0.85 | 0.51 | 0.09 | 18 | |||||
| eU | 0.16 | 3.14 | 01.02 | 0.55 | 54 | 0.16 | 4 | 0.99 | 0.51 | 51 | 0.21 | 3.99 | 1.77 | 0.65 | 37 | |||||
| eTh | 0.92 | 8.57 | 3.88 | 1 | 26 | 0.24 | 7.54 | 3.31 | 0.96 | 29 | 2.99 | 9.28 | 5.83 | 0.85 | 14 | |||||
| Litho. units | H (3228) | I (12648) | ||||||||||||||||||
| Variables | Min. | Max. | Mean | σ | CV% | Min. | Max. | Mean | σ | CV% | ||||||||||
| T.C | 4.38 | 8.35 | 6.17 | 0.60 | 9 | 0.54 | 7.35 | 4.31 | 0.95 | 22 | ||||||||||
| K % | 0.12 | 0.58 | 0.39 | 0.06 | 15 | 0.04 | 0.51 | 0.26 | 0.07 | 27 | ||||||||||
| eU | 0.18 | 04.05 | 1.88 | 0.70 | 37 | 0.16 | 4.58 | 1.48 | 0.65 | 44 | ||||||||||
| eTh | 2.45 | 7.21 | 4.69 | 0.69 | 15 | 0.16 | 6.62 | 3.25 | 0.91 | 28 | ||||||||||
The high uranium levels are concentrated in the phosphatic environments, related to the first three lithological units (A, B, and C) related to upper Cretaceous (Campanian) and Paleogene ages. Those scored units are considered as the main source of uranium in the study area.
The lithological scored map shown in Fig.3 will be the base for estimating the radioactive heat production HP for Area-2 as a whole, and for characterizing this HP separately the nine distinguished lithological units.
The available aerial gamma-ray spectrometry data of eU, eTh, and K% for the Area-2 firstly allow the computation of the heat production HP according to equation (1) for 45935 aerial measured data points in the study area (Area-2).
According to the application of equation (1), HP varies between a minimum of 0.06 μw/m3 and a maximum of 4.28 μw/m3 with an average of 0.548 μw/m3 and a standard deviation σ of 0.27 μw/m3.
The Table 3 shows the correlation matrix between the five radiometric variables of T.C, K, eTh, eU, and HP for the study area. The high correlation of 0.89 between the eU and the HP confirms that uranium is the main responsible of such a heat production.
Table 3 Correlation matrix of the five radiometric variables in Area-2.
| Variables | T.C | K | eTh | eU | HP |
|---|---|---|---|---|---|
| T.C | 1 | 0.59 | 0.48 | 0.68 | 0.67 |
| K | 1 | 0.59 | 0.03 | 0.03 | |
| eTh | 1 | -0.12 | 0.01 | ||
| eU | 1 | 0.89 | |||
| HP | 1 |
It is worth mentioning that the maximum HP value obtained in this paper (4.28 μw/m3) is comparable and in a good agreement with those obtained in Area-1 and Area-3, where a maximum of HP values of 7.23 μw/m3 and 4.17 μw/m3 have been respectively already obtained (Asfahani, 2018-a; Asfahani et al., 2016).
Secondly, the heat production HP is separately computed for different geological environments, represented by the nine lithological scored units shown on the scored map (Fig.3).
The boundaries of those nine scored lithological units are well distinguished and identified, where every unit of them has its specific density and content of eU, eTh and K%. The radioactive heat productions HP are consequently computed according to the equation (1), where eU, eTh, K% and densities of lithological units are available.
The three lithological phosphatic scored units A, B, and C related to the first factor (F1) are characterized by higher values of HP as shown and indicated in Table 4.
Table 4 The heat production HP (µw/m3) for the nine lithological scored units.
| Serial N | Rock Unit | Density ρ(g/cem3) |
No of points |
Min (µw/m3) |
Max (µw/m3) |
Average (µw/m3) |
σ (µw/m3) |
CV% |
|---|---|---|---|---|---|---|---|---|
| 1 | A | 1246 | 0.69 | 4.28 | 1.63 | 0.48 | 29.4 | |
| 2 | B | 3.2 | 1970 | 0.418 | 1.40 | 0.89 | 0.12 | 13.5 |
| 3 | C | 2.50 | 9977 | 0.129 | 1.24 | 0.65 | 0.17 | 26.1 |
| 4 | D | 2.65 | 325 | 0.141 | 0.83 | 0.40 | 0.12 | 30 |
| 5 | E | 2.1 | 923 | 0.17 | 1.14 | 0.60 | 0.16 | 26.7 |
| 6 | F | 3 | 14448 | 0.0.11 | 1.14 | 0.45 | 0.13 | 28.9 |
| 7 | G | 2.4 | 1170 | 0.38 | 1.17 | 0.65 | 0.11 | 16.9 |
| 8 | H | 1.95 | 3228 | 0.22 | 0.77 | 0.47 | 0.09 | 19.1 |
| 9 | I | 1.5 | 12648 | 0.06 | 0.97 | 0.43 | 0.12 | 27.9 |
| Area-2 | 1.85 | 45935 | 0.06 | 4.28 | 0.548 | 0.27 | 49.27 |
σ: Standard deviation, CV%: Coefficient of variability
The three lithological scored units D, E, and F related to the second factor (F2), composed of surficial washing and abrading products are characterized by prevailing of clayey facies, as marly clay, organic limestone, sandy limestone, sandy clay, sandy varieties intercalated with clayey limestone, silty clay, phosphorite and glauconite sands belonging to the Lower and Middle Paleogene (Technoexport, 1967).They are characterized by an average HP of 0.40, 0.60, and 0.45 μw/m3 respectively (Table 4).
The three lithological scored units G, H, and I related to the third factor (F3) reflect an environment of flood-closed basins, evaporation pans, bitumen appearances, and paleo-channels of tectonic origin. They are characterized by an average HP of 0.65, 0.47, and 0.43 μw/m3 respectively (Table 4).
Fig.4 shows the average characteristics of the heat production (HP) for the nine lithological scored units.

The analysis of the empirical relationships between uranium concentration (eU) and computed heat production (HP) for the nine scored lithological units shows strong correlations between those two parameters as shown in Fig.5, where R2 varies between a minimum of 0.756 for unit E and a maximum of 0.979 for unit A.

Weak correlations have been contrarily observed between both equivalent thorium (eTh) and potassium (K%) concentrations and the computed HP for the nine scored lithological units.
Fig.6-a shows high correlation between the average values of uranium and heat production HP (R2=0.885), for the nine lithological units as compared with weaker correlations between the of thorium and HP (0.26) (Fig. 6-b) and between the averages of potassium and HP (0.025) (Fig.6-c).

Figure 6 The relations between a: the averages of (eU and HP); b: the averages of (eTh and HP); and c: the averages of (K% and HP) for the nine lithological scored units.
The strong correlation between uranium eU and HP (R2=0.885) indicates the dominance of uranium in producing heat, compared with thorium and potassium.
Multi-fractal technique with the use of concentration-number (C-N) model and log-log plots is proposed and used herein as a new approach to map and characterize the equivalent uranium (eU), the equivalent thorium (eTh), the potassium (K%), and the heat production (HP) parameters in the study Area-2. The use of this approach allows different environmental populations to be distinguished for those treated parameters.
The break points shown on the log-log plots for the different treated parameters are used as geological boundaries to distinguish between different kinds of environmental geology, and to show the passage from one environment to another.
Log-log plots of N(≥μ) versus μ (eU,eTh, K% and HP) show straight line segments with different slopes−D corresponding to different radioactivity intervals.
The break points of those line segments are considered as thresholds. The geophysical populations of the treated parameters are therefore differentiated according to the linear segments and to the break points indicated in the log-log plots.
Based on the C-N log-log plot presented in Fig.7-a, the equivalent uranium log (eU) shows four threshold break points C1, C2, C3, and C4 at 0.22, 0.5, 0.63, and 1 respectively. The log (eU) values indicate at those four locations an equivalent uranium (eU) of 1.66 ppm, 3.16 ppm, 4.26 ppm, and 10 ppm respectively. Those four break points correspond to five uranium ranges as follows: The first range is less than 1.66 ppm, the second range is between 1.66 and 3.16 ppm, the third range is between 3.16 and 4.26 ppm, and the fourth range is between 4.26 and 10 ppm and the fifth range is bigger than 10 ppm. The high last range is removed from the interpretation because it represents an outlier value.

According to those four eU ranges, a map of the eU distribution is established for the study Area-2 region as shown in Fig.7-b.

Figure 7-b Equivalent uranium eU map derived by C-N fractal modeling in Ar-Rassafeh Badyieh Area (Area-2), Syria
Based on the C-N log-log plot shown in Fig.8-a, the equivalent thorium log (eTh) indicates three threshold break points C1, C2, and C3 at 0.342, 0.549 and 0.793 respectively. The log (eTh) values indicate at those three locations an eTh of 2.20 ppm, 3.54 ppm, and 6.21ppm respectively. The three indicated break points correspond to four eTh ranges as follows: The first range is less than 2.20 ppm, the second range is between 2.20 and 3.54 ppm, the third range is between 3.54 and 6.21 ppm, and the fourth range is bigger than 6.21 ppm.

According to those four eTh ranges, a map of the eTh distribution is established for the study Area-2 region as shown in Fig.8-b.

Figure 8-b Equivalent thorium eTh map derived by C-N fractal modeling in Ar-Rassafeh Badyieh Area (Area-2), Syria
The first range represents the background, and the rest three ranges are of geological significance and could be interpreted in lithological context.
Based on the C-N log-log plot shown in Fig.9-a, the potassium log (K%) indicates four threshold break points C1, C2, C3 and C4 at -0.696, -0.59, -0.347 and -0.15 respectively. The Log (K%) values indicate at those four locations a K% of 0.20, 0.257,0.449 and 0.710 respectively. The above four break points correspond to five K% ranges as follows: The first range is less than 0.20, the second range is between 0.20 and 0.257, the third range is between 0.257 and 0.449, the fourth range is between 0.449 and 0.710 and the fifth range is bigger than 0.710

According to those five K% ranges, a map of the K% distribution is established for the study Area-2 region as shown in Fig. 9-b.

Based on the C-N log-log plot shown in Fig.10-a, the radioactive heat production (HP) log (HP) shows four threshold break points C1, C2, C3 and C4 at -0.11, 0.19, 0.35 and 0.51 respectively.

The log (HP) values indicate at those four locations a heat production (HP) of 0.776, 1.549, 2.24 and 3.20 μw/m3 respectively. Those four break points correspond to five radioactive heat production ranges as follows: The first range is less than 0.776 μw/m3, the second range is between 0.776 and 1.549 μw/m3, the third range is between 1.549 and 2.24 μw/m3, and the fourth range is between 2.24 and 3.2 μw/m3 and the fifth range is bigger than 3.20 μw/m3. According to those five heat production (HP) ranges, a map of the HP distribution is established for the study Area-2 region as shown in Fig.10-b.

Figure 10-b Heat production (HP) map derived by C-N fractal modeling in Ar-Rassafeh Badyieh Area (Area-2), Syria
The new heat production findings presented in the present study are important for future geothermal researches in the area study region. The mathematical multi-fractal modeling technique with C-N model and the log-log plots demonstrates its advantages in clearly distinguishing between different environmental populations for the treated parameters (eU, eTh, K% and HP).
Conclusions
The available aerial gamma-ray spectrometric data (eU, eTh, and K%) related to Area-2, Syria are used to compute and evaluate the radioactive heat production (HP) parameter in the study region. Two statistical techniques are adopted to interpret those aerial gamma-ray spectrometric data. The first one is the factor analysis technique, aimed at establishing the environmental lithological scored map of the study area. The already established scored map includes different geological environments represented by nine scored lithological units, which have been separately characterized for the heat production (HP) parameter. The second statistical analysis technique is a non linear multi fractal modeling technique, oriented towards distinguishing between different radioactive environmental populations for the treated parameters of eU, eTh, K% and HP. The C-N model and the log-log plots associated with this fractal modeling technique are proposed and applied as a new approach to map the measured equivalent uranium (eU), equivalent thorium (eTh), potassium (K%) and the computed heat production (HP) parameters. The environmental phosphatic units in the study Area-2, being the most rich in uranium concentration, have the highest heat production (HP) values, compared with other lithological units in the study area.
The new heat production findings presented in this paper are regarded as a basic and fundamental document for future geothermal and hydrocarbon researches in the study Area-2 region. The established heat production (HP) map will be used for characterizing the sedimentary basins from thermal evolution point of view and for temperature distribution modeling.

