


 nueva página del texto (beta)
 Inglés (pdf)
 Artículo en XML
 Referencias del artículo
 Enviar artículo por email
 Citado por SciELO
  Similares en
SciELO
Similares en
SciELO 
 Permalink
1. Introduction
Vibrations of the ground may be generated by different natural causes. Among them are the processes acting both below and above the Earth surface such as earthquakes and volcanic activity generated by the activity within the Earth interior as well as hurricanes and snowstorms produced by atmospheric disturbances. The mechanical vibrations, outside the solid Earth, represent a subject of so called "environmental seismology" (Lerose et al., 2015). This article is focused on the study of seismic signals recorded during the tracks of air masses above the Mexican zone of the North American continent along the northwest coast and may be considered as a part of the environmental seismology.
An air mass is a large body of air with relatively uniform thermal and moisture characteristics. Once formed, the air masses migrate within the general circulation. Among the air masses that move above the North American continent, may be identified the continental polar and maritime Pacific tropical masses. A boundary between these two air masses is called a cold front. A cold front is the leading edge of a cooler mass of air, replacing at ground level a warmer mass of air, which lies within a fairly sharp surface trough of low pressure. A cold front occurs when a mass of comparatively colder air moves into where warmer air is presented. When the cold front is passing, winds become gusty; there is a sudden drop in temperature with appearance of heavy rains and snowstorms (Rauber et al., 2012).
Figure 1A illustrates the generation of the cold front No 5 (Frente frio) occurring from 2 to 4 November 2016. The continental polar air masses of the frontal system No 5 entered into the northern part of México and interacted with the maritime Pacific tropical air mass that is shown with the arrows marked as "Entrada de humedad". It is seen that the surface trough of low pressure, shown with yellow dashed lines, was elongated along the total territory of the state. The interaction of cold and warm air masses was accompanied with strong winds reaching 60 km/h in the northern part of México (this zone is shown within a green ellipse). As a result, the rainfalls up to 90 mm and a drop of hails (3 to 5 cm) were observed in a few states of northern México (Reporte, 2016).
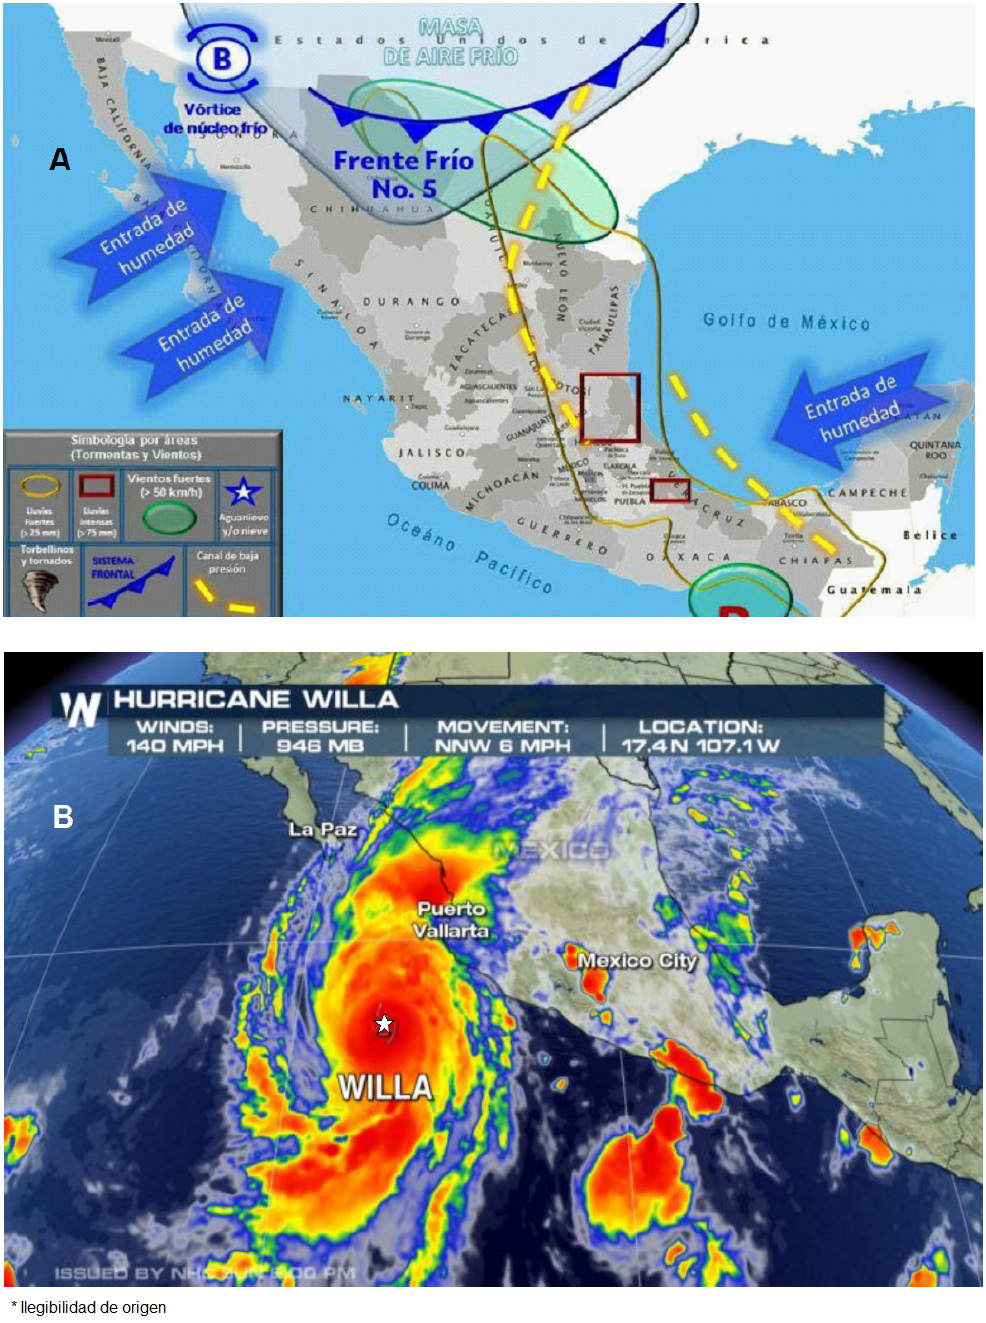
Figure 1 Examples of atmospheric disturbances occurring above the northwest Pacific coast of México. A, Scheme of the generation of the Cold front No 5 (3-4 November 2016) prepared by CONAGUA. There are shown the relative movement of the cold Polar air mass (Masa de aire frio) and of the Pacific maritime tropical masses (Entrada de humidad). Surface trough of low pressure (Canal de baja presión) is shown with a dashed line. The image was taken from http://agendasanluis.com, 3 November 2016. B, Satellite image of hurricane Willa of category 5 that was acting from 20 to 24 October 2018. Shown is the hurricane at peak intensity on 22 October. In the center is seen the eye of hurricane (shown with a star). The image was taken from http://stlucianewsonline.com, October 22, 2018.
Tropical cyclones are low pressure systems that have thunderstorm activity and rotate counterclockwise. The tropical cyclones start from a tropical depression with winds of 60 km/h or less to a tropical storm whose winds reach 60-120 km/h. If the wind of the tropical storm exceeds 120 km/h and occurs in the Atlantic Ocean of northeastern Pacific Ocean, then is called "a hurricane". At this stage, the cloud-free hurricane eye typically forms because rapidly sinking air at the center dries and warms the area. The eye at a hurricane's center is a relatively calm, clear area approximately 30-60 km across. The eyewall, surrounding the eye, is composed of dense clouds that contain the highest winds in the storm. The Saffir-Simpson Hurricane Scale defines hurricane strength by categories. A category 1 storm is the weakest hurricane (winds 120-150 km/h); a category 5 hurricane is the strongest (winds greater than 250 km/h) (Hurricane basics, 1999).
The example of satellite image of hurricane is shown in Figure 1B. This image was obtained for the hurricane of category 5 Willa which occurred along the Mexican coast from 20 to 24 October 2018. The peak intensity of hurricane Willa was estimated equal to 260 km/h; it had relatively small eye diameter of 8-16 km. The minimum pressure was recorded as 925 mb (Brennan, 2018).
Direct measurements of tropical storm and hurricane dimensions and wind speed are taken primarily by reconnaissance aircraft, although ships and buoys also take important measurements. Once a hurricane is near and/or on land, Automated Surface Observation Systems (ASOS) provide surface conditions, and radio sondes take upper air measurements. Indirect observational methods include satellite imagery and Doppler radar. In particular, satellites have greatly improved our ability to monitor and understand hurricanes. Radar data are important once the storm comes close to shore and after landfall for forecasting hurricane-related weather (Rauber et al., 2012).
The wind and products of snowfalls and rainfalls touching the ground generate the seismic signals (Diaz et al., 2014; Dean, 2017). The spectrum of ambient seismic noise showed strong signals associated with tropical cyclones. Through the analysis of more than a decade of seismic data recorded at several stations located in and adjacent to the northwest Pacific Ocean, Gualtieri et al (2018) showed the existence of persistent and frequency-dependent signatures of tropical cyclones in ambient seismic noise depending on characteristics of the storm and on the detailed location of the station relative to the storm. Fan et al. (2019) found that during large hurricanes the interaction of long-period ocean waves with shallow seafloor features, located near the edge of continental shelves, excites coherent transcontinental Rayleigh wave packets in the 20- to 50-s period band. Such interactions produce seismic sources, so called "storm-quakes", with equivalent earthquake magnitudes that can be greater than 3.5.
One of the first identification of hurricane was performed via microseisms by Ebeling and Stein (2011). They showed that the August 1992 category 5 hurricane Andrew was detected using microseisms recorded at the Harvard, Massachusetts, analog seismic station. The storm interacted with sea and was at a distance of about 2000 km from the station. Andrew continued to generate microseisms for a long time before it made its final landfall according to the position of the eye. Based on these results, there was adopted a normalized microseism pseudo power amplitude in the 200 to 143 mHz passband to identify and characterize a seismically identified hurricane.
Monitoring of a cyclone tracks ("cyclone" is named as "typhoon" in the northwestern Pacific Ocean) using the seismic waveforms recorded on the seafloor and on the land was studied by Chi et al. (2010). Using the waveforms, collected by land and ocean bottom seismic stations, equipped with Guralp CMG-3TC broadband three-component seismometers, which were very close to the path of typhoon Shanshan, they have documented at least two source regions: one trailing after the typhoon and another near the coast at shallow water depth.
The studies of excitation of seismic waves by atmospheric pressure changes during two tropical cyclones, tropical storm Lee (2011) and hurricane Isaac (2012), were performed basing on the low-frequency seismic signals in the range of 0.01 and 0.02 Hz (Tanimoto and Valovcin, 2015; 2016). They used the seismic and barometric data from the Earthscope network. The cyclones moved through this network after their landfalls. Seismic and surface pressure amplitudes showed a systematic decreasing trend with distance from the center of the hurricane. The decreasing rate was much higher for seismic waves than for pressure.
The time fluctuations of the surface pressure under the eyewall, surrounding the eye, which were reconstructed from seismic data, allowed to obtain some results about the behaviors of hurricane Isaac (Tanimoto and Lamontagne, 2014). At the time of the landfall, the eyewall was located at a distance of about 75 km from the hurricane center during approximately 10 hrs after the landfall. In the following 24 hrs, the eyewall moved outward from the center of the hurricane to a distance of about 200-300 km. At the end of this period (34 h after the landfall), the raw seismic data did not show any systematic, eyewall-like signature. Therefore, the lifetime of the air circulation for hurricane Isaac was about 1.5 days.
The studies of snowfalls dynamics derived from seismic signals are not widely developed. Practically, they are limited by the studies of the snow avalanches. Heavy snowfall leading to snow accumulation on slopes is one of the basic requirements for the occurrence of an avalanche. An avalanche is basically a moving mass of snow that slides down mountain slopes under the force of gravity and buries all that comes in its path. The main subject of seismic "snow" studies are represented by detection of snow avalanches and estimation of avalanche development and frontal velocities by seismic monitoring systems (Heck et al., 2019; Surinach et al., 2020).
In this article a methodology monitoring of atmospheric disturbances, based on analysis of short-period seismic signals, is developed. Two events are selected for this analysis: hurricane Dora and its preceding tropical storm (June 2017) and the cold front system number 25 (January 2018). For each event the following study was performed. At first, the general description of development of atmospheric event based on satellite observations is presented. Then the description of the waveforms of seismic signatures of the tracks of the atmospheric event and their Fourier spectral characteristics is done. Finally, the reconstruction of dynamics of the tracks of the atmospheric event based on the power spectral densities of the one-hour seismic records is realized. The following results are discussed from the point of view of specific generation of the seismic signals in the cases of rainfalls and snowfalls.
2. The system of seismic monitoring of atmospheric disturbances and the methodology of analysis
The summits of mountains with heights exceeding 3,000-3,500 m may serve as the best site for recording the drops of rain and snow emitted during atmospheric disturbances. In our case, the summit of dormant volcano Nevado de Colima (4,260 m), situated in Jalisco state, México at a distance of about 70 km from the Pacific Ocean coast, was selected (Figure 2A). The summit of dormant volcano, having low level of ambient seismic noise, is a good site for recording of the fall of products of atmospheric disturbances. As is shown in the photo (Figure 2B) of dormant Nevado de Colima and the neighboring active Volcán de Colima (3,860 m), the track of cold front left its snow trace on the dormant volcano but no snow on the summit of active volcano is seen.
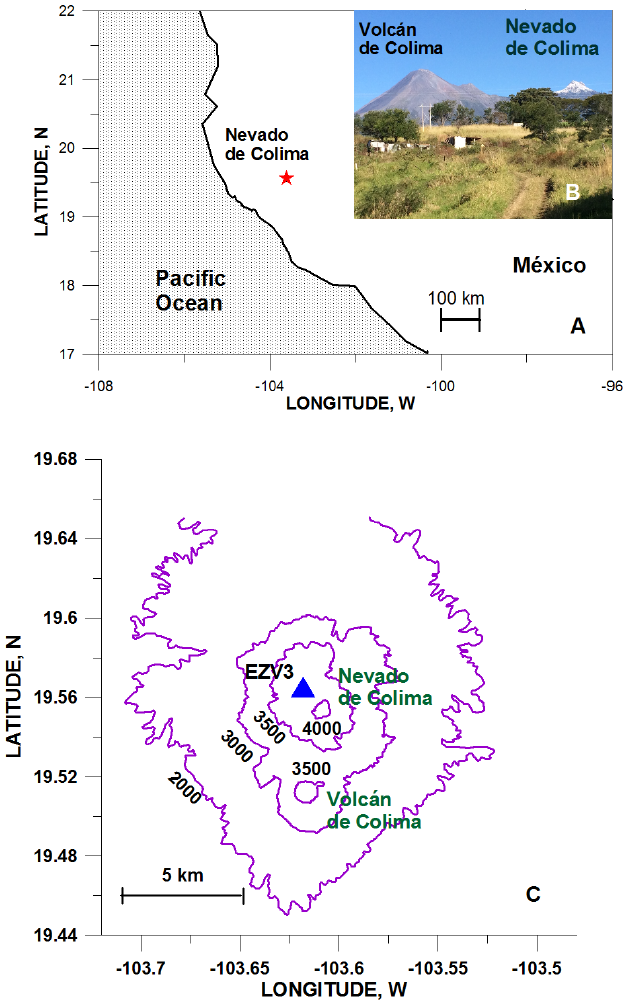
Figure 2 Position of the dormant volcano Nevado de Colima on the western coast of Mexico (A) and within the Colima Volcanic Complex together with the active Volcán de Colima (C). In B is shown the photo of both volcanoes taken on 8 February 2020 after the pass of the cold front 38. The seismic station EZV3 is shown as triangle. Photo was taken by author.
The seismic station EZV3, belonging to the seismic network of Colima University RESCO, was installed at the altitude of3,957 m on the slope of summit of volcano (Figure 2C). The seismic signals were recorded by the short-period (T = 1.0 s) vertical-component analog sensor KINEMETRICS RANGER SS1. This sensor was placed inside the booth located on the ground surface.
The seismic signals, generated by the action of atmospheric disturbances, were studied analyzing their waveforms and their Fourier spectral characteristics. The entering of atmospheric disturbances in a zone of sensitivity of a seismic station and the total period of their activity are good seen on the daily helicorder displays of seismic records (it may be seen later in Figs. 6 and 13). These records represented a sequence of seismic signals of different amplitude and spectral parameters. In our study, one-hour seismograms (Figure 3) were taken in analysis using interactive MATLAB software Seismo_volcanalysis of Lesage (2009). These one-hour records were used for two purposes. At first, for study of the temporal development of atmospheric disturbances. For this purpose, the periodogram power spectral densities of each one-hour records, as is shown in Figure 3, were calculated using a Hanning window. Secondly, there was performed a selection of individual good-written waveforms of seismic signals occurring within every one-hour period of activity. The selected signals were saved separately and processed then with the program DEGTRA (https://degtra-a4-xp.updatestar.com/es). This processing step involved analyzing waveforms of characteristic individual seismic signals and calculation of their Fourier spectra.
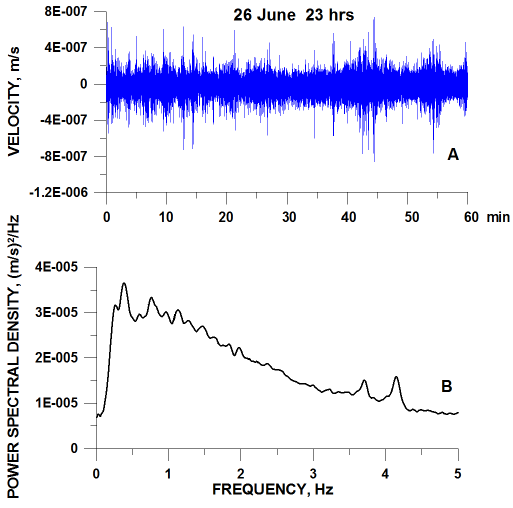
Figure 3 Example of the one-hour plot of seismic signals (short-period unfiltered seismic velocity waveforms, station EZV3) and their spectrum representing the periodogram power spectral densities vs frequency calculated using a Hanning window.
In search for information about hurricanes in México, the Reports of National Hurricane Center (https://www.nhc.noaa.gov/) were used; in search for information about the snowfalls in México, the Reportes de Clima en México (https://smn.conagua.gob.mx/es/reporte-del-clima-en-mexico) were used.
3. Description of the atmospheric events and their seismic signatures during the hurricane Dora
3.1. General description of development of hurricane Dora
Hurricane Dora (Figure 4A) developed from the combination of a large Central American gyre that formed around 15 June 2017 and a tropical wave that moved into the Pacific area of northwestern México by 23 June. Dora moved west-northwestward parallel to the coast of Mexico (Figure 4B) for about five days while located to the south of a mid-tropospheric ridge which extended from northern Mexico westward over the adjacent Pacific waters. Dora developed from a tropical depression, formed by 18:00 UTC (UTC- Coordinated Universal Time in June = CDT-Central Daylight Time +5 h) on 24 June, to a tropical storm by 06:00 UTC 25 June. Beginning from 18:00 UTC 26 June Dora became a hurricane of category 2 situated about 280 km south of Manzanillo, Mexico (See Figure 4B). The intensity of hurricane steadily decreased on 27 June (Berg, 2017).
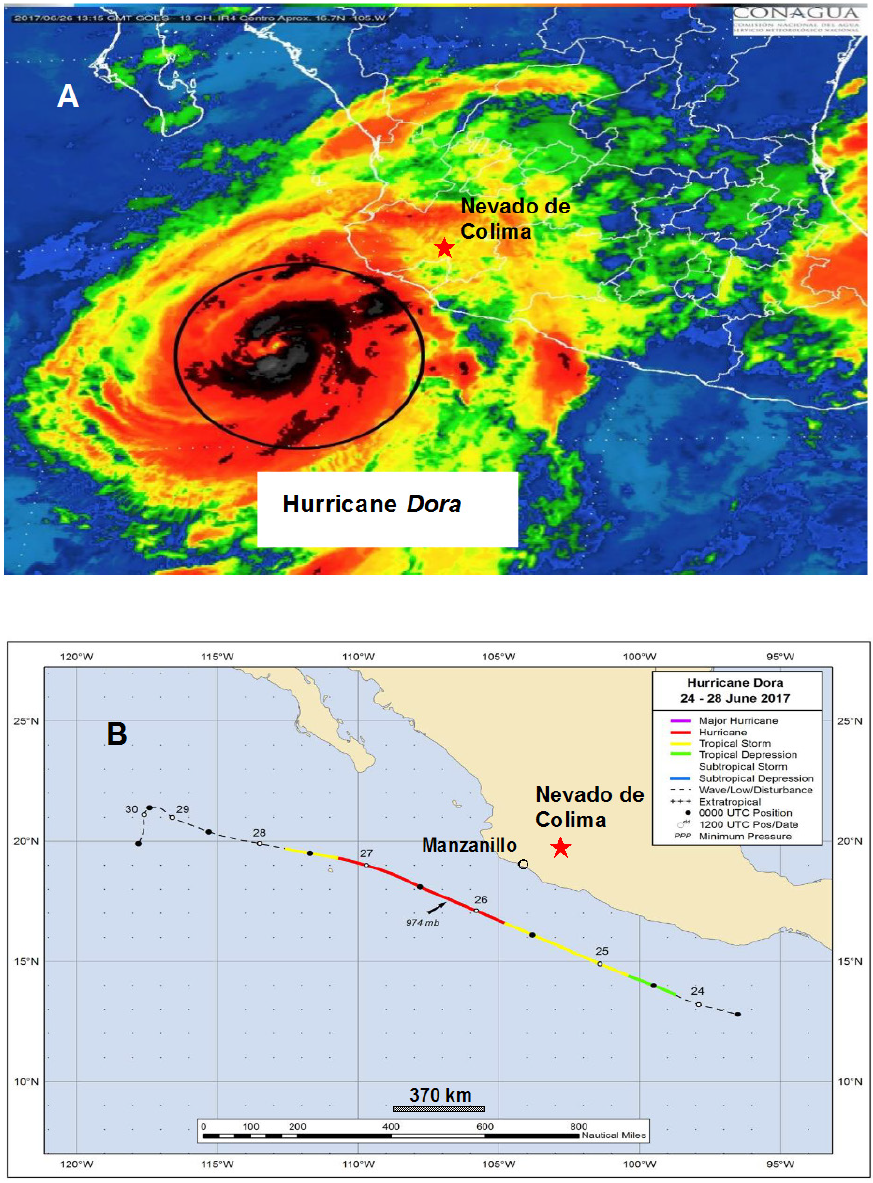
Figure 4 Satellite image of hurricane Dora (A) and its way along the Mexican coast (B). The satellite image was taken by the NOAA GOES-13 on 26 June 2017 at 13:15 UTC and presented by CONAGUA, Mexico (Huracán Dora, 2017). A circle in A mark the position of the eye of hurricane. Position of the dormant volcano of Nevado de Colima in A and B is shown with a star. The track positions for hurricane Dora, 24-28 June 2017, shown in B, are taken from (Berg, 2017).
Figure 5 demonstrates the variations in atmospheric pressure and the wind speed during development of the hurricane (based on the measurements presented in Berg, 2017). It is seen that the tropical storm occurred in conditions of decrease in atmospheric pressure from 1005 to 999 mb and increase of wind speed from 65 to 102 km/h while the hurricane was formed in conditions of atmospheric pressure varied as 999-974-990 mb and the wind speed ranging within 120-167-120 km/h.
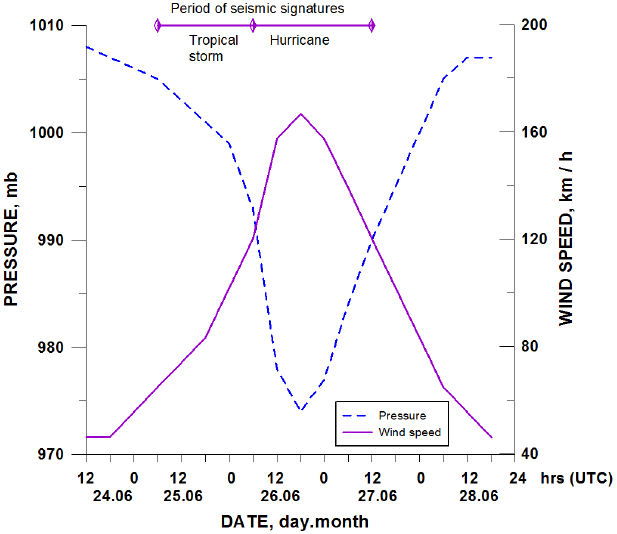
Figure 5 Variations in wind speed and atmospheric pressure during development of hurricane Dora. Data for this figure were taken from the measurements performed by the Cooperative Institute for Meteorological Satellite Studies/ University of Wisconsin-Madison and published in (Berg, 2017). Period of appearance of seismic signatures of the atmospheric disturbances is shown above the diagrams.
3.2. Seismic signatures of the tracks of the tropical storm and hurricane Dora
The sequences of seismic signals of footprints of atmospheric disturbances, recorded on the station EZV3, situated on the summit of dormant volcano Nevado de Colima, began to appear on seismograms (Figure 6) at 8 hrs (hereafter UTC) on 25 June, two hours later the generation of tropical storm from the tropical depression (Berg, 2017). The continuous seismic activity was observed until 14 hrs.
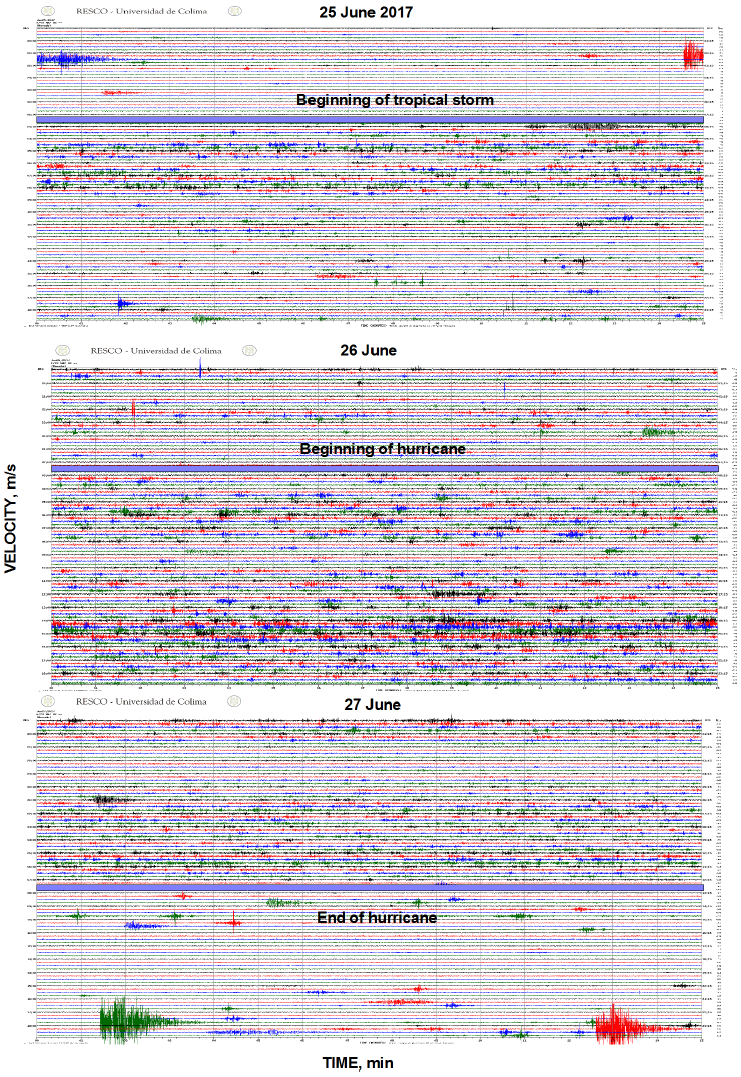
Figure 6 The daily helicorder displays of seismic signals (velocity, vertical component) recorded at short-period station EZV3, installed at the summit of the dormant volcano Nevado de Colima, are shown for 25, 26 and 27 June of 2017. There are indicated the moments of recording of vibrations generated with the arrivals of the tropical storm, of hurricane Dora, and the end of hurricane Dora. In the right side of seismograms is shown the UTC time; in the left side, local time CDT.
Figure 7A shows three typical signals, generated by rainfalls of tropical storm. They represent emergent phaseless waveforms having durations between 7 and 10 s. Their Fourier spectral peak amplitudes within the frequency range of 1.5-1.6 Hz varied from 1.8x10⁻⁷ to 2.5x10⁻⁷ m (Figure 7B). During the storm, the signals of this type appeared as the single events or in the dense sequences (See Figure 6).
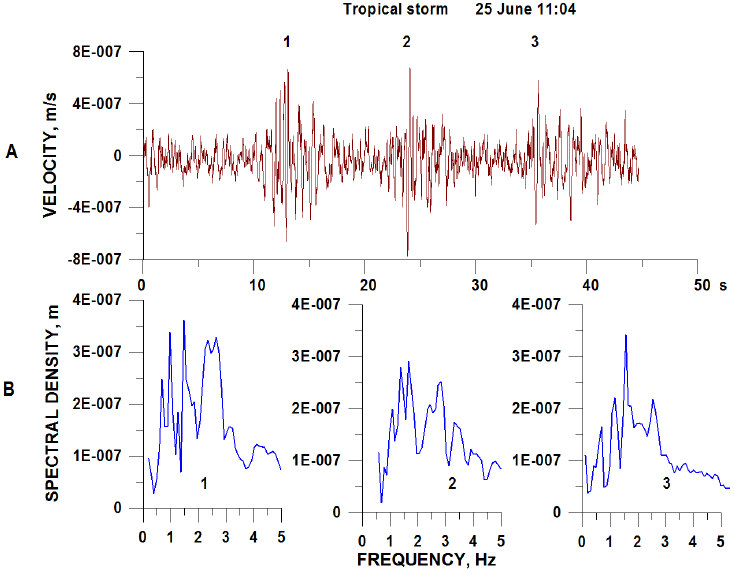
Figure 7 The short-period unfiltered seismic velocity waveforms, station EZV3 (A) and Fourier spectra of seismic signals (B) recorded during the action of the tropical storm on 25 June. 1, 2, and 3 indicate three seismic waveforms and their corresponding spectra.
The stage of hurricane, which began after a short quiescence, was characterized with the dense sequences of the seismic signals. They filled the helicorder display from 7 hrs of 26 June to 12 hrs of 27 June. Among them may be indicated two groups of characteristic waveforms. The signals of the first group, shown in Figure 8A, differed from the signals, appearing during the tropical storm (Figure 7A), by their longer durations (24-30 s). Fourier spectra were characterized by a presence of dominant frequencies in the range of 1.1-1.5 Hz. The spectral peak amplitudes were slightly higher (between 3.6x10⁻⁷ and 5.9x10⁻⁷ m) than those observed for the tropical storm events (Figure 8B).
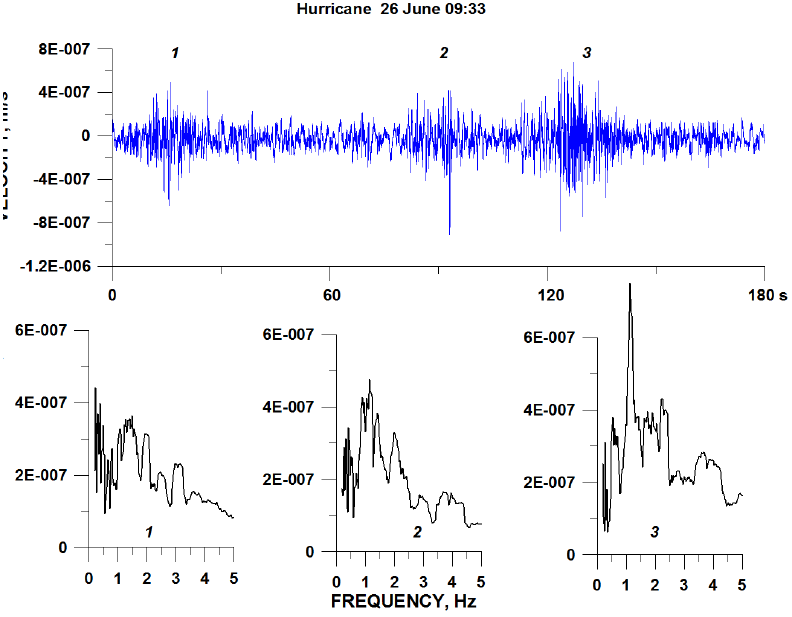
Figure 8 The short-period unfiltered seismic velocity waveforms, station EZV3 (A) and Fourier spectra of seismic signals (B) recorded during the action of the hurricane on 26 June. 1, 2, and 3 indicate three seismic waveforms and their corresponding spectra.
The signals of the second group more reflected the increased intensity of the atmospheric disturbances during the hurricane and might be produced by the storm whirlwinds (Figure 9). A part of these signals represented the sequences of long, spasmodic, high-amplitude waveforms (Figure 9A). The duration of the record, shown in Figure 9A, reached 90 s, the spectral amplitude was of 1x10⁻⁶ m, the peak frequency was of 1.4 Hz (Figure 9C). The next type of waveforms (Figure 9B) represented an individual impulsive signal of high amplitude (5.4 x10⁻⁷ m) and of relatively long duration (17 s). Its peak spectral frequency was of 1.7 Hz (Figure 9C).
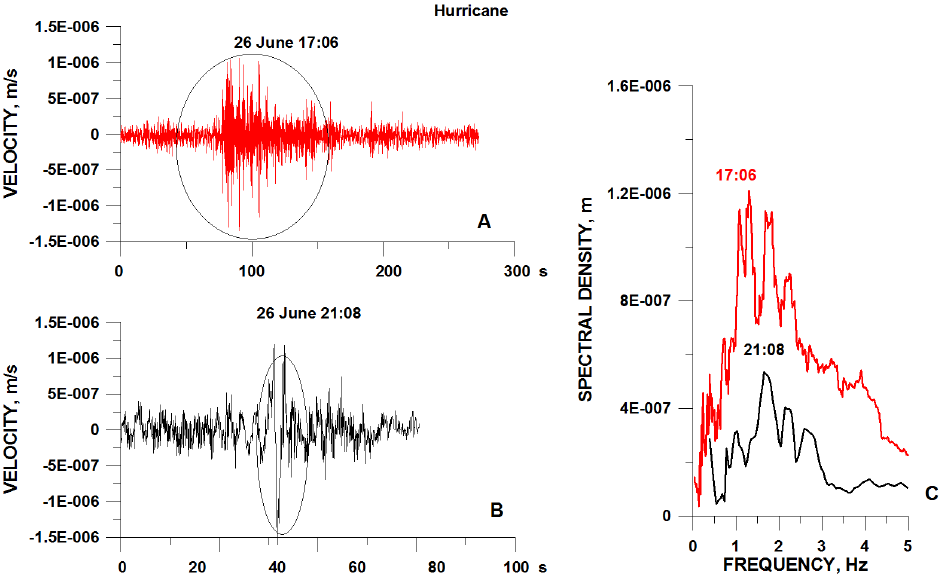
Figure 9 The short-period unfiltered seismic velocity waveforms, station EZV3 and Fourier spectra of seismic signals of large events recorded during the action of the hurricane on 25 June. A, characteristic waveform of a long sequence of events; B, the event of large amplitude; C, their Fourier spectra.
3.3. Reconstruction of dynamics of the tracks of tropical storm and hurricane Dora
The continuous record of the seismic signals during the tracks of tropical storm and hurricane Dora gave a possibility to reconstruct dynamics of the tracks of atmospheric disturbances. The power spectral densities (PSD hereafter) of one-hour seismic records were calculated (See Figure 3). Figure 10 demonstrates the temporal variations of the PSD amplitudes and corresponding frequencies of recorded one-hour waveforms during 25 to 27 June. They allow to specify our estimations of the dynamics of the tracks of tropical storm and hurricane Dora based on seismograms shown in Figure 6.
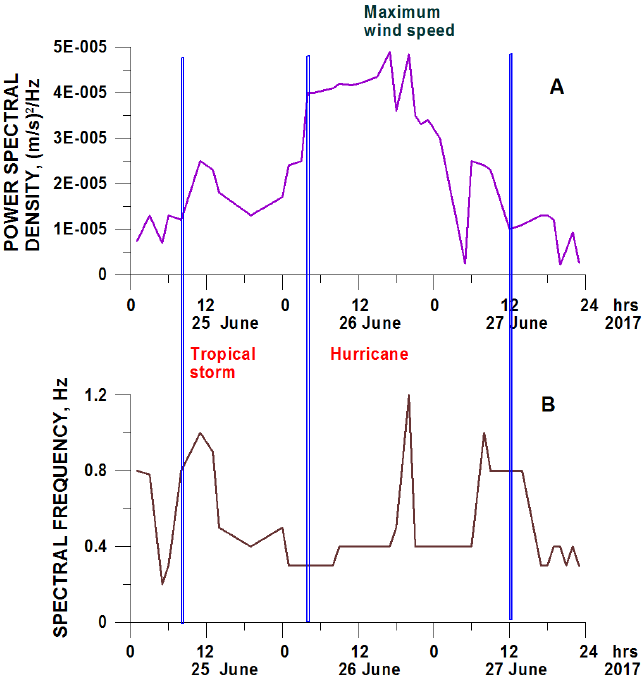
Figure 10 The development of tropical storm and hurricane during 25 to 27 June in variations of amplitudes of power spectral density (A) and corresponding frequencies (B) of one-hour seismic sequences. Vertical lines separate the stages of development.
The variations in spectral amplitudes (Figure 10A) demonstrated the development of intensity of the process. The tropical storm began to appear at Nevado de Colima at 8 hrs of 25 June and reached its maximum activity during the period between 10 and 14 hrs. Then the activity of the storm decreased and reached its minimum at 19 hrs. After this moment, the storm began to develop into hurricane during 8 hrs. At 4 hrs of 26 June, the tropical storm turned into a hurricane. It had a stable development until 15 hrs. During the time interval between 16 and 20 hrs of 26 June, coinciding with the maximum wind speed (See Figure 5), the hurricane reached its maximum intensity. Then its intensity steadily dropped and at 12 hrs of 27 June the hurricane completely wasted its power. As a result, the duration of the tropical storm may be estimated equal to 20 hrs and of hurricane, to 32 hrs.
The variations in frequency content of the seismic signals (Figure 10B) add some details in description of these atmospheric disturbances. At first, the signals, generated by the entrance of the tropical storm, were characterized by increase in frequencies from 0.2-03 Hz to 0.8-1.0 Hz. Then, with decrease of the tropical storm intensity and its development into hurricane, the signals of lower frequencies were formed. These low-frequency signals (0.3-0.4 Hz) were observed practically during the total period of the hurricane activity. The only moment of a sharp increase of frequency up to 1.2 Hz was observed when the wind speed reached its maximum (See Figure 5).
Figure 11 demonstrates the existence of tendencies of direct relationship between the one-hour PSD of the seismic signals, generated by the tropical storm and following hurricane, and the wind speed and an inverse relationship between the one-hour PSD and atmospheric pressure. The values of atmospheric pressure and the wind speed, calculated for every 6 hours of the atmospheric disturbances, were taken from (Berg, 2017). Coefficients of correlations between these parameters are within 0.73-0.76 that is significant at 95% confident level. Therefore, the maximum intensity of seismic signals recorded during hurricane tracks was observed at maximum wind speed and lowest atmospheric pressure.
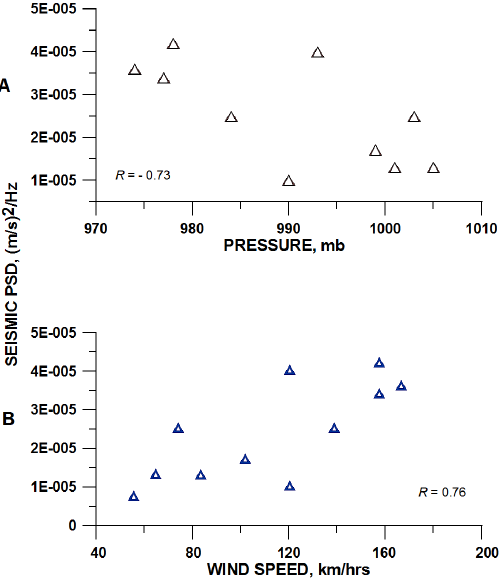
Figure 11 The plot of amplitudes of power spectral densities of one-hour seismic records vs atmospheric pressure (A) and wind speed (B). The values of atmospheric pressure and the wind speed were taken from (Berg, 2017).
4. Description of the atmospheric events and their seismic signatures during the tracks of the cold front No. 25
4.1. General description of development of the cold front No. 25
The system of cold front No. 25 was formed on 27 January 2018 (Figure 12A) and developed in México until 1 February (Reporte, 2018). According to CONAGUA (Comisión Nacional del Água de México), the continental polar air masses started at the United States, and in combination with the strong propagation of humid winds, generated by the southeastern warm Pacific Ocean tropical air masses, produced a significant drop in temperature in a large part of México. On 30 January (Figure 12B), the tropical air masses intersected the cold front distributed along the Mexican territory. On 31 January (Figure 12C), there were observed very strong to intense storms with squalls and hailstorms in the east and southeast of the territory. The intense snowfalls were recorded in the heights above 3000 m including the summit of volcano of Nevado de Colima. According to low temperatures and heavy snowfall, the entrance to the National Park of Nevado de Colima was closed by the Government ofJalisco State during 31 January (El Diario, 2018). Then the cold front began to move to the Gulf of Mexico and lost its activity on 1 February (Figure 12D).
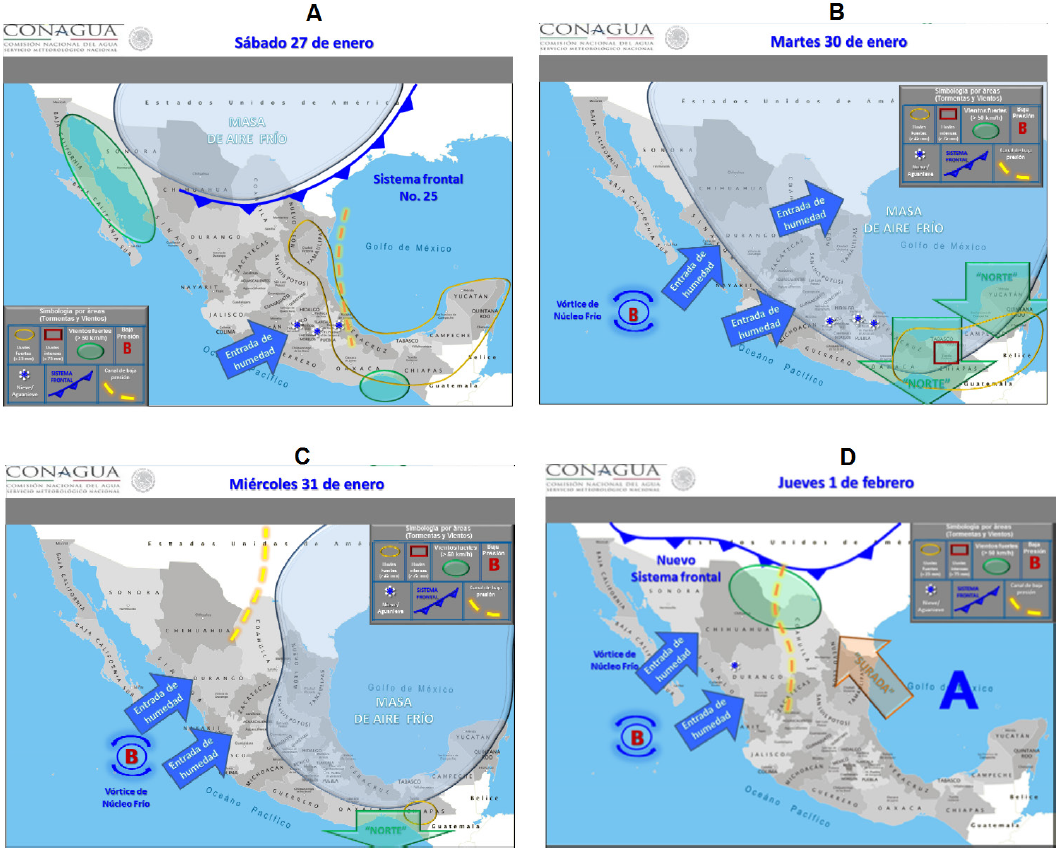
Figure 12 The development of the cold front (sistema frontal) No 25 presented on the satellite images according to CONAGUA (Comisión Nacional del Água de México). A, Entrance of the system of cold front No. 25 on the territory of México on 27 January 2018. B and C, tracks of the cold front during 30 and 31 of January above México. D, Withdrawal of the cold front to the Gulf of México on 1 February. In the map images are used the Spanish terms: masa de aire frio (cold air mass), entrada de humidad (humility entrance), vórtice de nucleo frio (cold core vortex) and nuevo sistema frontal (new frontal system). The images represent the courtesy of CONAGUA.
4.2. SEISMIC SIGNATURES OF THE TRACKS OF THE COLD FRONT NO 25
The seismic signals of atmospheric disturbances recorded on the station EZV3, situated on the summit of dormant volcano Nevado de Colima, began to appear on 30 January with the intersection of the tropical air masses and the cold front No 25 and continued until 1 February. Figure 13 demonstrates the daily helicorders of seismic signals recorded during 30 and 31 January. The appearance of seismic signals occurred due to active rainstorms, hailstorms and snowfalls occurring in this region.
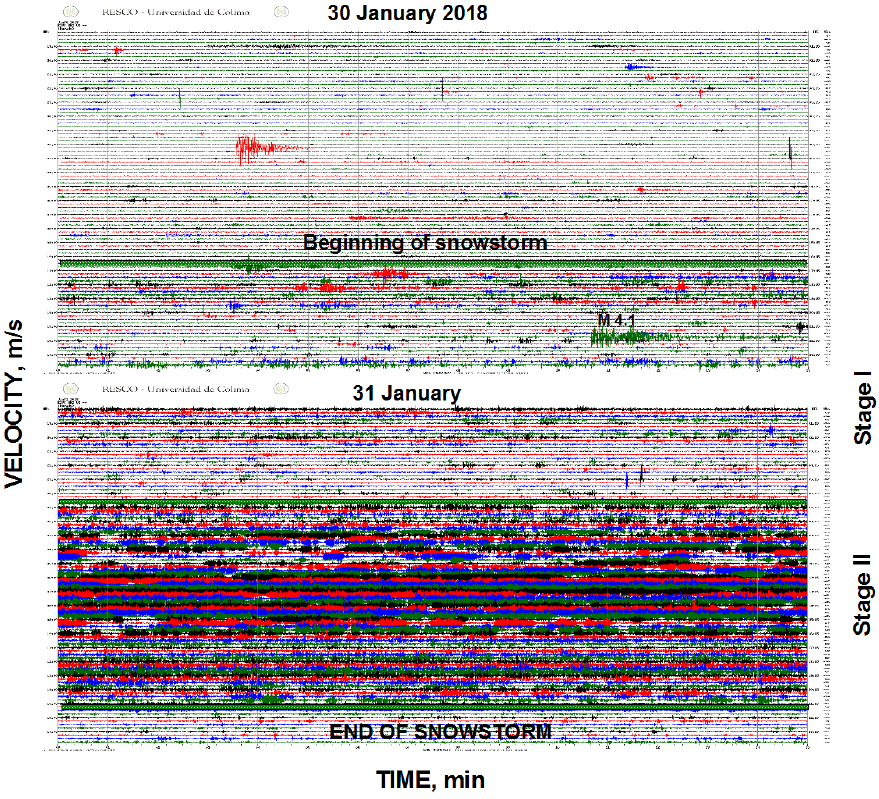
Figure 13 The daily helicorder displays of seismic signals (velocity, vertical component) recorded at short-period station EZV3, installed at the summit of the dormant volcano Nevado de Colima, are shown for 30 and 31 January 2018. There are indicated the moments of recording of vibrations generated with the arrivals of two stages of the tracks of the cold front No 25. In the right side of seismograms is shown the UTC time; in the left side, local time CST.
It is possible to identify two stages in the development of the seismic activity generated by the cold front tracks. The arrival of the cold front was marked by the sequence of seismic signals which began to appear between 17 and 18 hrs UTC (UTC in January = CST-Central Standard Time +6 h) on 30 January. This stage I in seismic activity continued until 6 hrs of 31 January when the amplitudes of seismic signals and the density of their appearance sharply increased indicating the beginning of the stage II (Figure 13). The stage II of intense seismic signals continued until 21 hrs of 31 January. Then the amplitudes of seismic signals decreased.
The seismic waveforms, recorded during stage I, were represented by individual events distributed with intervals from some seconds to some minutes. Their spectral frequencies varied between 1.2 and 2.0 Hz, the durations were within the interval of 10-30 s. The spectral amplitudes varied from 3x10⁻⁷ to 6x10⁻⁷ m. Three typical signals, shown in Figure 14, are characterized by the durations of these events between 25 and 30 s, their spectral amplitudes were of (3-5)x10-7 m and the spectral frequencies varied between 1.2 and 1.5 Hz.
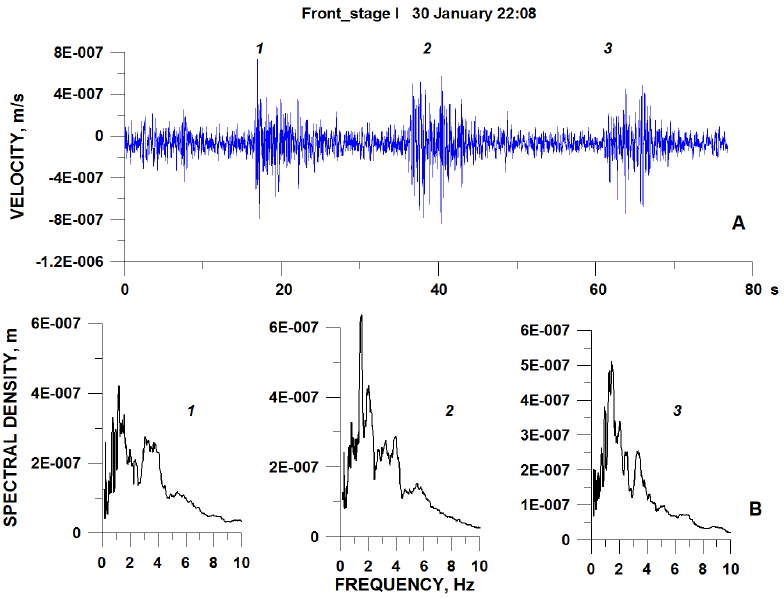
Figure 14 The short-period unfiltered seismic velocity waveforms, station EZV3 (A) and Fourier spectra of seismic signals (B) recorded during the action of the initial stage I of the tracks of cold front on 30 January 2018. 1, 2, and 3 indicate three seismic waveforms and their corresponding spectra.
During the stage II, beginning at about 6 hrs UTC of 31 January (30 January, 23 hrs GST, in the night with decreasing of temperature), the character of waveforms of seismic signals significantly changed (Figure 13). The seismic waveforms were recorded in the dense groups of signals. They differed from the waveforms of the initial stage in their shape and spectral content, representing the harmonic vibrations (Figure 15 and 16).
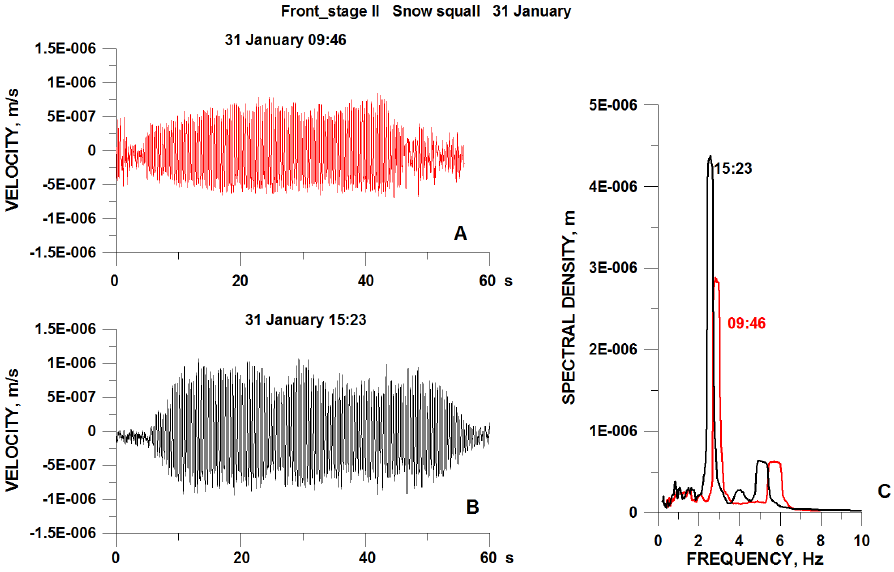
Figure 15 The short-period unfiltered seismic velocity waveforms, station EZV3 (A, B) and Fourier spectra of the long seismic signals (C) recorded during the action of the squall stage II of the tracks of cold front on 31 January 2018.
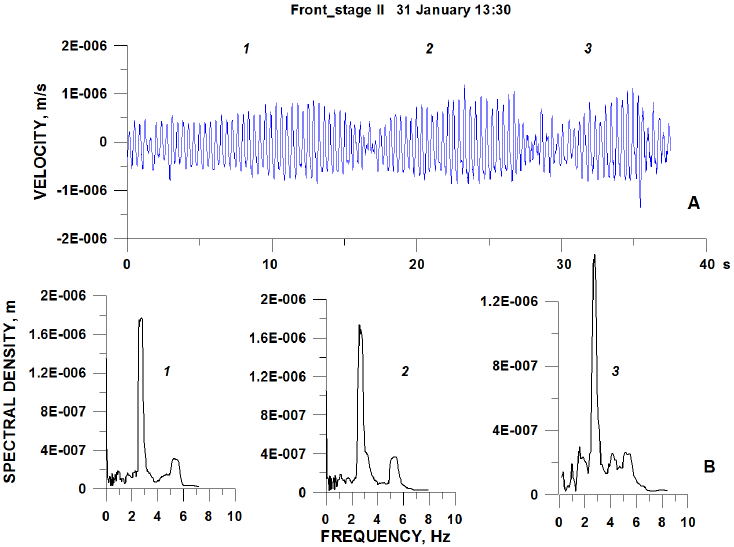
Figure 16 The short-period unfiltered seismic velocity waveforms, station EZV3 (A) and Fourier spectra of seismic signals (B) recorded during the action of the squall stage II of the tracks of cold front on 31 January 2018. 1, 2, and 3 indicate three seismic waveforms and their corresponding spectra.
Part of the signals was rather long, reaching durations of 50-70 s (Figure 15). These waveforms were characterized by two fundamental frequencies of between 2.6 and 2.9 Hz and between 5 and 6 Hz. The spectral amplitudes, corresponding to the first fundamental frequencies, varied between 2x10⁻⁶ and 4x10⁻⁶ m.
The characteristic short single events are shown in Figure 16. Their durations varied between 10 and 15s. The arrivals were emergent as for long signals. They were characterized by two fundamental frequencies of similar range of fundamental spectral frequencies as for long waveforms (2.7-2.8 Hz and 5.4-5.5 Hz). Their spectral amplitudes, corresponding to the first fundamental frequencies, varied between 1.5x10⁻⁶ m and 2x10⁻⁶ m.
4.3. Reconstruction of dynamics of the tracks of the cold front No 25
As was noted in the case of hurricane Dora (Section 3.3), the continuous record of the seismic signals during the tracks of atmospheric disturbances gives a possibility to reconstruct their dynamics basing on the spectral characteristics of one-hour seismic records. Figure 17 demonstrates the temporal variations of spectral amplitudes and frequencies of recorded one-hour waveforms generated by the cold front No 25 during 30 and 31 January.
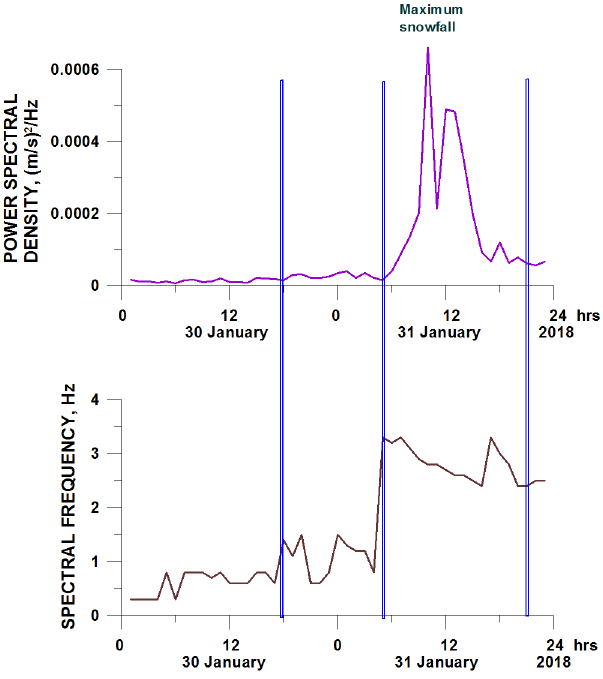
Figure 17 The development of the cold front No 25 during 30 and 31 January in variations of amplitudes of power spectral density (A) and corresponding frequencies (B) of one-hour seismic sequences. Vertical lines separate the stages of development.
The amplitude and frequency variations, shown in Figure 17, confirm a presence of two stages, pre-squall and squall, in development of the tracks of the cold front, indicated in Figure 13. The first stage, pre-squall, begins at 18 hrs on 30 January. The appearance of the cold front events was marked by an increase in the spectral frequency of the one-hour waveforms from 0.6-08 Hz to 1.0-1.5 Hz. The spectral amplitudes also increased but slightly. The stage II, squall, began on 5 hrs of 31 January with a significant change in both spectral content and spectral amplitudes. Seismic vibrations demonstrated a sharp increase in amplitudes, reaching their maximum between 10 and 13 hrs. The spectral frequencies became higher, reaching 2.4-3.3 Hz. With termination of the stage II at 21 hrs of 31 January, the one-hour spectral amplitudes of seismic vibrations became to be close to the background noise level. Totally, the pre-squall stage continued for 11 hrs and the squall stage, for 16 hrs.
5. The seismic signals recorded during the initial stages of the atmospheric disturbances
The arrivals of the tropical storm and the pre-squall stage of the cold front were marked with the seismic signals different from the following rainfall and snowfall vibrations (Figure 18). In the very beginning of the pattern of seismic signals of the tropical storm, on 25 June at 08:11, it is seen a waveform consisting of a sequence of three similar emergent, spindle-shaped seismic signals (Figure 18A, B) with frequencies of 1.3, 0.85, and 0.85 Hz, which differ in their durations (40, 90, and 50s) and spectral amplitudes (0.7x10⁻⁶, 5x10⁻⁶, and 1.4x10⁻⁶ m). Each of the waveforms begins with a low-amplitude signal which gradually increases in amplitude and then slowly decreases. These are similar to the seismic records of rockfalls generated during eruption at active volcanoes (Zobin, 2017) or small debris flows (Coviello et al., 2019) and may be identified as the seismic signals produced by the ground mass movement generated by a surge arriving with the tropical storm.
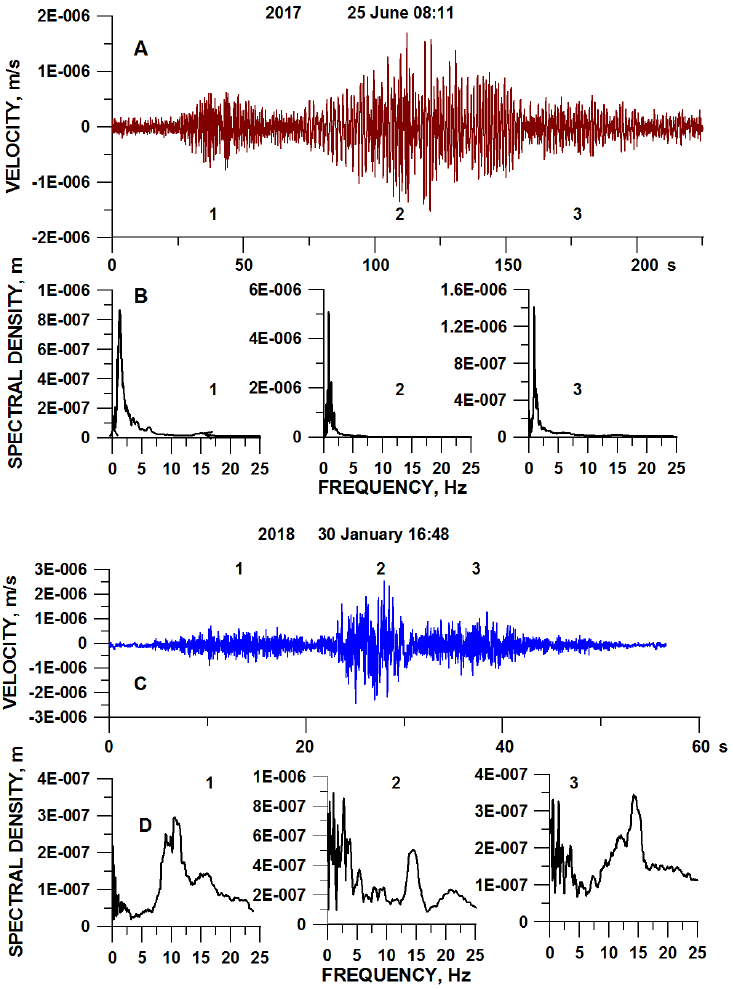
Figure 18 The short-period unfiltered seismic velocity waveforms, station EZV3 (A, C) and Fourier spectra of seismic signals (B, D) recorded during the initial entrance of the tropical storm on 25 June 2017 at 08:11 and of the cold front on 30 January 2018 at 16:48, respectively. 1, 2, and 3 indicate three seismic waveforms and their corresponding spectra.
The arriving of cold front also generated a special type of the seismic signals. At 16:48 hrs on 30 January, in the very beginning of the seismic sequence associated with the cold front, it was recorded a 1-min duration 3-pulses waveform. This record (Figure 18C) represented a high-amplitude impulsive signal situated between two similar low-amplitude emergent waveforms. The maximum spectral amplitudes of all three pulses were observed at high frequencies, between 10 and 15 Hz (Figure 18D).
These waveforms may represent the seismic reverberations created by the sound waves of thunders associated with lightning (Kappus and Vernon, 1991; Lin and Langston, 2009; Usoltseva, 2011). Kappus and Vernon (1991) studied the seismic signals of ground velocity recorded during 13 sequences of thunderstorms. The waveforms of thunder-induced ground velocity reverberations, presented in their article, are similar to those shown in Figure 18C. The spectra of these events were characterized by peaks at low frequency varying from 6 to 13 Hz.
5. Results and Discussion
The wind and products of snowfalls and rainfalls touching the ground generate the seismic signals. The study of seismic signatures of atmospheric processes recorded at a height of about 4 km above sea level at the summit of dormant volcano Nevado de Colima showed sensibility of the seismic sensor to the ground vibrations caused by the impact of these products of atmospheric disturbances. The following results may be formulated.
The seismic signals, generated by tropical storm and hurricane Dora, were characterized by different waveforms and spectral parameters. The maximum amplitudes of the power spectral densities of these signals corresponded to the lowest atmospheric pressure and highest wind speed.
The seismic signals, generated by two stages of the cold front No 25, were characterized by different waveforms and spectral parameters. While the spectral characteristics of pre-squall stage are generally similar to the same of the tropical storm and hurricane, during the stage of squall, the fundamental short-period frequencies appear.
Variations in the spectral peak frequencies and corresponding PSD amplitudes of the one-hour seismic signals gave a good description of development of atmospheric disturbances and allowed to estimate the lifetime of the air circulations for each stage of atmospheric disturbances: 20 hrs for tropical storm; 32 hrs for hurricane Dora; 11 hrs for pre-squall stage of the cold front and 16 hrs for the squall stage of the cold front.
Figure 19 summarizes the results demonstrating the mutual plot of spectral parameters of characteristic waveforms recorded during tropical storm, hurricane and two stages of the cold front activity. Here are presented nine measurements of the best readable waveforms for each type of atmospheric disturbances. It is seen that in the case of tracks of hurricane Dora, the stage of tropical storm was characterized by lower amplitudes of recorded seismic events comparative with the stage of hurricane. At the same time, the events recorded during the tropical storm and hurricane stages, were represented in the same range of spectral frequencies between 1.0 and 1.7 Hz.
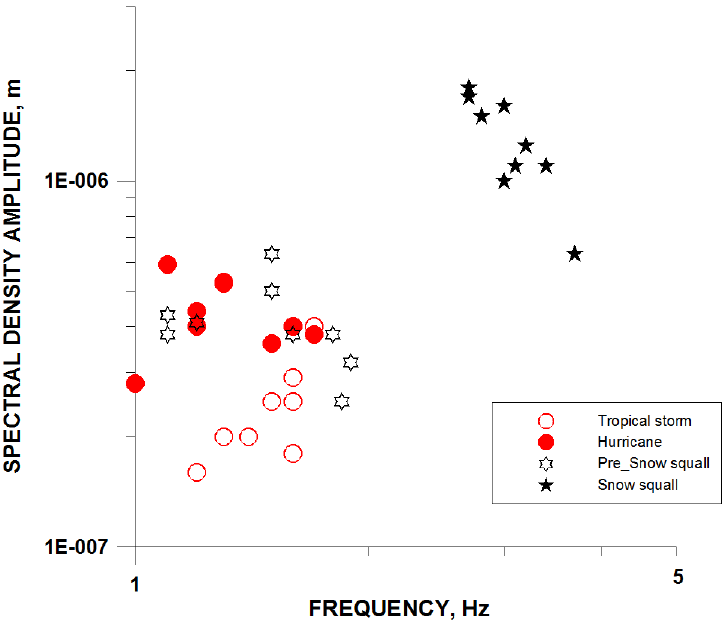
Figure 19 Plot of power spectral density vs frequency for characteristic waveforms recorded during tracks of the tropical storm and hurricane, and pre-squall and squall stages of the cold front.
In the case of tracks of the cold front No 25, the preliminary stage was characterized by lower amplitudes of recorded seismic events comparative with the stage of maximum activity. During the preliminary, pre-squall, stage, the events were characterized by the spectral frequencies between 1.2 and 1.9 Hz. The events of the stage of maximum, squall, activity generated the seismic signals of higher frequencies within a range from 2.6 to 3.7 Hz.
The comparison of spectral characteristics of the events of hurricane and cold front allows seeing a similarity in characteristics of the hurricane and preliminary stage of the cold front. They both may be considered as the heavy rainfalls. The significant difference in spectral characteristics of the events occurring during the stage of maximum activity of the cold front comparing with other events associated with rain falling allows to propose that in this case the seismic signals were produced by heavy snowfall, or snow squall. The appearance of fundamental frequencies in seismic spectra of the squall events demonstrates the difference in interactions of rain-ground and snow-ground. Falling snowflake serve as a single resonator while the falling rain drop serve as a multiple resonator.
6. Conclusions
The wind and products of snowfalls and rainfalls touching the ground generate seismic signals. The study of short-period seismic signatures of atmospheric disturbances during tracks of hurricane Dora and its preceding tropical storm (June 2017) and the cold front system number 25 (January 2018), which were recorded at a height of about 4 km above sea level at the summit of dormant volcano Nevado de Colima, allowed to develop a methodology of monitoring these atmospheric events. This study includes the indication of the seismic signatures of atmospheric disturbances on the daily helicorder displays of seismic signals with following analysis of waveforms, produced by the impact of rainfalls and snowfalls with the ground surface, and their Fourier spectral characteristics. Then, the reconstruction of the tracks of the atmospheric events, based on the power spectral densities of the one-hour seismic records, which is performed mutually with the satellite observations was performed. Application of this methodology allowed indicating the periods of actions of tropical storm, hurricane, and two stages of the cold front and estimating the characteristic waveforms for each period. Analysis of the spectral characteristics of these waveforms demonstrated that the rainfalls, occurring during the tropical storm, hurricane and the initial stage of the cold front tracks, generated the seismic signals within the frequency range between 1.0-1.8 Hz while the snowfall during the second stage of the cold front tracks generated the seismic signals within the frequency range between 2.6 and 3.7 Hz. This gives a possibility for monitoring the tracks of atmospheric disturbances in real time or reconstruction the dynamics of these events during past time.

