


 nueva página del texto (beta)
 Inglés (pdf)
 Artículo en XML
 Referencias del artículo
 Enviar artículo por email
 Citado por SciELO
  Similares en
SciELO
Similares en
SciELO 
 Permalink
1. Introduction
Some approaches to characterize siliciclastic reservoirs have limited carbonate applications (Gupta and Gairola, 2020) because carbonates are highly heterogeneous, chemically reactive, and have complex porosity structures (Akbar et al., 1995). Diagenetic processes such as cementation and dissolution control the carbonates' elastic behavior (Anselmetti and Eberli, 1993, Eberli et al., 2003, Brigaud et al., 2010, Fournier et al., 2014, Hairabian et al., 2014). For the static characterization of carbonate reservoirs, the elastic properties play a significant role because they are linked to the wavelength from different frequencies: seismic, sonic, and ultrasonic. A critical issue is the effects of the frequency dependence on the characterization models, which is very useful, in static and dynamic properties relationships, for more realistic wave propagation simulations in rocks (Panizza and Ravazzoli, 2019).
The relationships between P- and S- wave velocities and porosity are highly variable in carbonates and, therefore, each geological environment must be separately characterized (Miller, 1992). Porosity, pore type, fluid-filled pore, mineralogy, and density affect wave velocities (Anselmetti and Eberli, 2008). On the other hand, pore geometry is a crucial factor since it is responsible for the significant scattering in velocity values at a given porosity in carbonates (Eberli et al., 2003).
Several investigations have been carried out in carbonates to determine relationships between velocity, porosity, pore type (Anselmetti and Eberli, 1997, Eberli et al., 2003), and pore-structure (Assefa et al., 2003, Weger et al., 2009). For this reason, the thin sections are used to measure the pore aspect ratio; which in turns supports the investigations about the relationship between compressional (VP) and shear (VS) wave velocities of rocks with pore geometries. The thin sections are two-dimensional representations of the rock body in three dimensions (Assefa et al., 2003). Another method for velocity estimation from thin section images is based on numerical modeling using finite difference schemes for acoustic wave propagation; this involves neural networking to compute the pore aspect ratio (Wardaya et al., 2014). The Digital Image Analysis (DIA) technique has also been applied to quantify the pore geometry's effects on wave velocities (Weger et al., 2009). Both fracture porosity and aspect ratio influence P- wave and two polarized S- wave velocities. These were analyzed using a two-layer physical model with a vertical fracture system. The results indicated that the wave velocities usually increase when the fracture aspect ratio is also increased (Li et al., 2016).
Another research area to predict the relationship between the pore shapes and velocities is based on self-consistent methods, which are efficient tools for estimating effective elastic moduli of two-phase composites (matrix and inclusions). The pioneering works of Budiansky (1965) and Hill (1965) presented self-consistent solutions to estimate macroscopic elastic moduli considering polycrystals and a matrix. Their analysis was based on Eshelby's (1957) investigation for the self-consistent analysis of spherical inclusions embedded in a matrix. Later, O'Connell and Budiansky (1974) extended the self-consistent method for ellipsoidal cracks.
The prediction ofthe microporosity aspect ratio has been possible to compare the ultrasonic velocities, Digital Image Analysis (DIA) from thin sections, and velocities obtained by Differential Effective Method (DEM). The microporosity effective aspect ratio has been quantified with a minimum error method between the compressional wave velocity measurement and those velocities estimated by DEM. This method enables the pore-geometry characterization from elastic properties measured in carbonate grainstone samples (Lima et al., 2014).
Effective properties have been estimated for microporous cemented grainstone with porous micritic grains of spherical shapes embedding in a non-porous sparry calcite cement. The micritic grains consider spheroidal inclusions within a calcareous host. The grain property and the whole-rock property were modeled with DEM and Self-consistent approximation (SC), respectively. The Equivalent Pore Aspect Ratio (EPAR) was derived from fitting laboratory measurements of velocities with the previous models (Fournier et al., 2011). EPAR was presented as a tool for identifying the dominant pore from velocity and porosity measurements in limestone (Fournier et al., 2014). EPAR has also been modeled using DEM and Keys-Xu approximation. This parameter permits classifying three carbonate groups that reveal a petrophysical indicator representing the pore geometry and their relationship with elastic properties (De Assis et al., 2017, Fournier et al., 2018).
The frequency impact in the estimation of VP and VS wave velocities with the effective medium theories have been evaluated by adjusting estimated velocities with the measured velocities from physical models, which consider different crack density and ultrasonic frequencies (100, 250, and 500 kHz). The best matching was reached by the Hudson method at 500 kHz. The velocity measurements decrease while the frequency decreases as the crack density increases (Shuai et al., 2020).
The self-consistent methods usually predict effective elastic moduli of an isotropic medium, although carbonate rocks are anisotropic. Therefore, these models should include the influences of anisotropy, pore sizes, and frequency to gain more representativeness for carbonate reservoir characterization.
In this paper, a new application of the Effective Medium Method (EMM) which considers anisotropy, frequency, and other parameters, is used to model the compressional and shear wave velocities taking into account fluid-saturated carbonate samples to predict pore-structure. The parameters such as characteristic length, wave incidence angle, aspect ratio, mineralogy, and pore-filling fluid, play an important role in describing it. This research includes the validation of results based on experimental data of ultrasonic velocities in carbonate samples which are classified as intercrystalline, intergranular, moldic, and vuggy pores. The governing equations for the self-consistent scheme by Sabina et al. (1988, 1993, 2015) are described in Section 2. The Scanning Electron Microscope (SEM) and Photomicrograph images are used to study the pore's structures in carbonate rocks (Section 3). A case study shows the rock samples' location used to validate this research (Section 4). In Section 5, the results of velocity modeling (VP, VSV and VSH) and pore-structure prediction in carbonates are presented at different frequencies. The anisotropy analysis is also included where Young's modulus (E33) and the Poisson's ratio (v31), as well as Thomsen's parameters (ε, γ, and δ) are estimated. This work concludes with a discussion of parameters that chiefly affect the wave velocities' propagation in carbonate reservoirs (Section 6).
2. The Effective Medium Method (EMM) applied to anisotropy modeling
Different methods have been used to model heterogeneous medium considering inclusions embedded in a matrix; these inclusions can be solid- or fluid-filled pores. Various geometries of inclusions have been considered, and their effective properties have been estimated using a homogenization process. For example, O'Connell and Budiansky (1974) considered a homogenization method on a self-consistent approximation with a crack density parameter. The Kuster-Toksöz method (1974) neglects the interaction between inclusions. In spite of, the non-interaction assumption is not valid at a high concentration of inclusions or with porosities more significant than 20% (Berryman and Berge, 1996). The Differential Effective Medium (DEM) scheme (Cleary et al., 1980, McLaughlin, 1977, Norris, 1985, Zimmerman, 1991) considers an iterative homogenization process until the inclusions' concentration of the modeled composite is reached. Berryman's method is a variation of the Kuster and Toksöz method to minimize the multiple scattering effects on a simpler scheme (Berryman, 1980).
The self-consistent methods mentioned above have been used to obtain effective moduli from a two-phase medium's macroscopic properties. Sabina and Willis (1988) extended the static model of Budiansky (1965) and Hill (1965) to estimate dynamic properties; from these, they determined scattering and attenuation patterns of heterogeneous media with spherical inclusions, which lead to isotropic medium.
Hudson (1980, 1981) based on scattering theory, proposed a method to determine effective moduli for an anisotropic medium (transversely isotropic medium), assuming aligned inclusions which can be fluid-filled, dried, or filled with a weak material when a dilute distribution of cracks is considered. Sabina et al. (1993, 2015) presented a model to estimate effective dynamic properties for transverse isotropic composites. In these models, aligned spheroidal inclusions are considered. The self-consistent method assumes a single scattering problem whose solutions will depend on the inclusion shape, size, and quantity. In this way, effective moduli are determined from the frequency and mechanical properties of the matrix and constituents. From these effective moduli and the inclination angle of the inclusions, it is possible to estimate a compressional (VP) wave velocity, horizontally (VSH) and vertically (VSV) polarized shear wave velocities (Figure 1a).
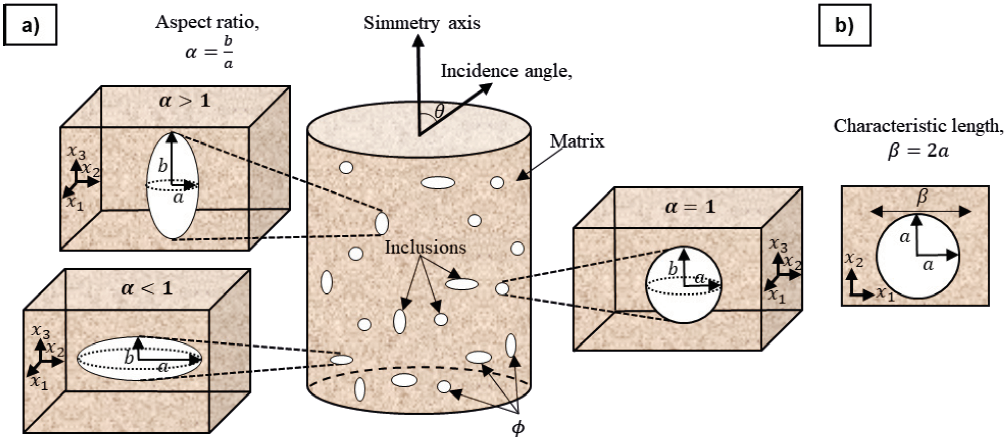
Figure 1 Schematic diagram showing the geometries and parameters used in the anisotropic model. a) Vertical and horizontal ellipsoidal and sphere inclusions considering volume fraction (ϕ), aspect ratio (α) that relates to radius (a) and semi-axis (b) embedded in the matrix. b) The inclusion in the plane (x1, x2) is a circle with a radius a and characteristic length (β).
This work presents the equations by Sabina et al. (1993, 2015) to predict anisotropic elastic moduli, Thomsen parameters, and pore-structure of carbonate rocks. The effective elastic moduli (c0) and the effective density (ρ0) for a transversely isotropic medium are:
where ϕr is the volume fraction of the inclusions (r), n is the number of inclusions embedded in the medium, k corresponds to the propagation's wavenumber in the heterogeneous medium, s is the unit vector, I is the identity matrix,
from the latter equation, Ω is:
where a is the inclusion radius of the x1, x2 plane and α is the aspect ratio which is defined as the quotient of the semi-axis in x3(b) and semi-axis in the x1, x2 plane, α=b/a=1 refers to a sphere; α>1 represents a prolate spheroid, and an oblate spheroid considers α<1 (Figure 1a).
The size of the inclusions depends on the volume fraction, their radius (a) and aspect ratio (α). The dimensions of the inclusions are given by a characteristic length β=2a which is related to the response of the elastic properties (Figure 1b), depending on the wavelength at different frequencies; ultrasonic, sonic, and seismic. The dimensionless frequency is calculated with matrix compressional wave velocity (Vm), frequency (f) and inclusions radius as:
Based on Kinra and Anand (1982), there is a parameter of the layer thickness connected with the long-wavelength resolution that relates radius a with the semi-axis b of an ellipsoidal inclusion embedding in a layer with a porosity (ϕ):
If b=a, then the shape of the inclusions is spherical. It means that there is a dependence between the radius of the inclusions and the frequency associated with different sizes of these employing a scaling factor throughout the frequency band (Valdiviezo-Mijangos and Nicolás-López, 2014, Valdiviezo-Mijangos et al. , 2020).
Figure 2 shows the flow chart for solving Eqs. 1 and 2. These equations are a system of nonlinear equations of the complex variable for each frequency. Note that when calculating some coefficients, the calculation of numerical integrals is necessary (Appendix A). The method of successive iterations is used to solve the system of equations since the unknowns (c0 and ρ0) are implicit. The following describes how the algorithm solution is implemented. First, the input parameters are defined as the density (ρ2), compressional wave (VP2) and shear wave (VS2) velocities of the matrix; density (ρ1 ), compressional wave (VP1 ) and shear wave (VS1) velocities, volume fraction (ϕ), radius (a), characteristic length (β) and aspect ratio (α) of inclusions; as well as dimensionless frequency
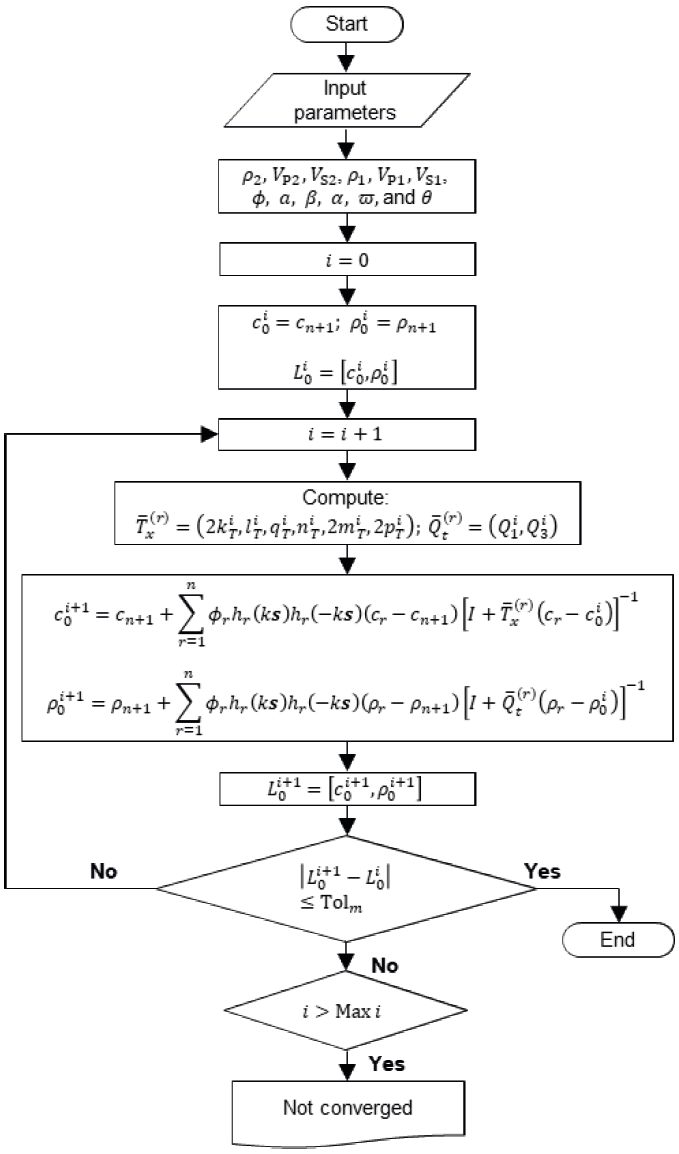
Figure 2 Flow chart of the self-consistent method solution to estimate effective dynamic properties.
The vector notation from applying Hill's notation is:
To determine
Applying the vectors
3. Identification of pore-structure in images
Several pore classifications have been developed by Archie, Choquette and Pray, and Lucia (Lucia, 1983, 1995). The Archie classification (1952) emphasizes pore-structure with petrophysical properties, considering matrix porosity and visible pores. This classification is difficult to apply in geological models because it is not defined from depositional or diagenetic terms (Moore, 2001). The Choquette and Pray classification (1970) was designed as a descriptive and genetic system, identifying 15 types of pores which are divided into the selective fabric and non-selective fabric. They are associated with the pore boundary configuration and the pore's position relative to the fabric. The most abundant porosities are interparticle, intraparticle, intercrystalline, moldic, fenestral, fracture, and vuggy. This classification includes genetic modifiers, time of porosity formation, pore shapes (regular and irregular), and sizes. This classification has a wide diversity of pore network structures for each pore type that cannot be distinguished in the velocity-porosity relationship; for this is necessary to consider grain and pore shape, grain contact, cement occurrence, and particle packing (Fournier et al., 2018). The Lucia classification integrates the rock fabric with the petrophysical properties since pore distribution controls permeability and saturation. Two classes of porosities are defined: interparticle, which indicates the pore space between grains or crystals (intergranular and intercrystalline); and vuggy porosity, that is subdivided according to how the vugs are interconnected; it can be separate vugs (moldic, intragranular, intraparticle, shelter) and touching vugs (fractures, cavernous, breccia, and fenestral) (Lucia, 1983, 1995).
Scanning Electron Microscope (SEM) and Photomicrographs images permit identifying a type of characteristic shape associated with different porosities. Three types of porosity are illustrated, where intercrystalline pore shapes are elongated, they become rounded and with a smaller size (Figure 3a). The moldic pores' shape will depend on the constituents that formed it, such as shells, grains, salts, or plant roots (Wang, 1997). In particular, the partially cemented moldic pores are rounded but of a smaller size than moldic pores (Figure 3b and c). The vug pores are sub-rounded to rounded and show elongated ellipsoidal shapes (Figure 3d and e).
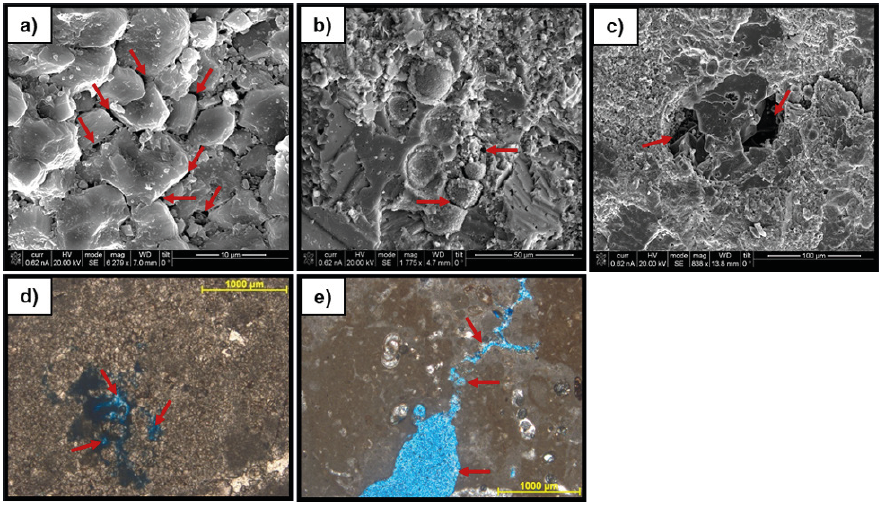
Figure 3 Carbonate rocks pores' shape analysis from SEM images with different porosities, a) intercrystalline, b) partially cemented moldic, c) moldic, and from Photomicrograph images with d) a connected vug and e) a vug with intense dissolution (arrows indicate pore shapes).
In summary, it is essential to identify the pore shape of carbonates to analyze the velocity-porosity relationship since it is related to the aspect ratio (α) for characterizing the pore-structure from ultrasonic velocity data.
4. Case study: Application in carbonate samples
The published database of117 limestone samples was taken from Fournier et al. (2014); P-wave and S-wave ultrasonic velocity values are measured at 1 MHz, and porosity data (0-15%) and dominant pore type were considered. The porosity is classified as intercrystalline, intergranular macropores, moldic macropores (open and cemented), and open vugs. Ultrasonic velocities at 40 MPa were chosen to conserve the elastic properties. The samples correspond to the Lower Cretaceous platform located in three zones, Rustrel, Nesque, and Fontaine-De-Vaucluse in Provence, southeastern France (Figure 4).

During the Lower Cretaceous, the lithology type in Provence corresponds to limestone, also known as Urgonian. It is a carbonate platform system isolated from terrigenous sediments of Valanginian to the Lower Aptian age. A carbonate belt was developed around the Vocontian basin in the western Alpine basin during this age (Masse, 1993). The Urgonian platform was marked by drowning events that interrupted three growth and progradation stages (Masse, 1993, Masse and Fenerci-Masse, 2011).
This case study has been used for the EMM modeling of velocities. A calcite matrix and air inclusion were chosen to simulate experimental data's real conditions, samples of dry carbonates. The input parameters (Figure 2) of the matrix are density, ρ2=2710 kg/m3, compressional wave velocity, VP2=6400 m/s and shear wave velocity, VS2=3250 m/s and for the inclusion are ρ1=1204.1kg/m3, VP1=343.2 m/s associated with sound propagation and VS1=0 m/s (at 20 °C). The selected parameters are within the variation of values for calcite, i.e., P-wave velocity ranges between 6260 and 6640 m/s and S-wave velocity ranges approximately between 3240 and 3440 m/s (Mavko et al. , 2009).
5. Results and discussion
The results from estimating effective dynamic properties based on the Effective Medium Method (EMM) for the transversely isotropic medium are analyzed and discussed in four sections. First, characteristic length (β) is determined to identify pore sizes (Section 5.1). Section 5.2 presents the impact of the wave incidence angle (θ) on the velocities. The pore-structure prediction from the velocity-porosity relationship is analyzed in Section 5.3. Finally, a section of anisotropy includes Young's modulus (E33) and Poisson's ratio (v31), as well as Thomsen's parameters (ε, γ and δ) for different aspect ratios (Section 5.4).
5.1 Determination of characteristic pore length
The effects of characteristic length (β) on estimated velocities at ultrasonic (1 MHz), sonic (10 kHz), and seismic (85 Hz) frequencies (f) are shown in Figure 5. This Figure shows smaller pore sizes affect velocities more than larger pores with increasing porosity at the frequencies analyzed.
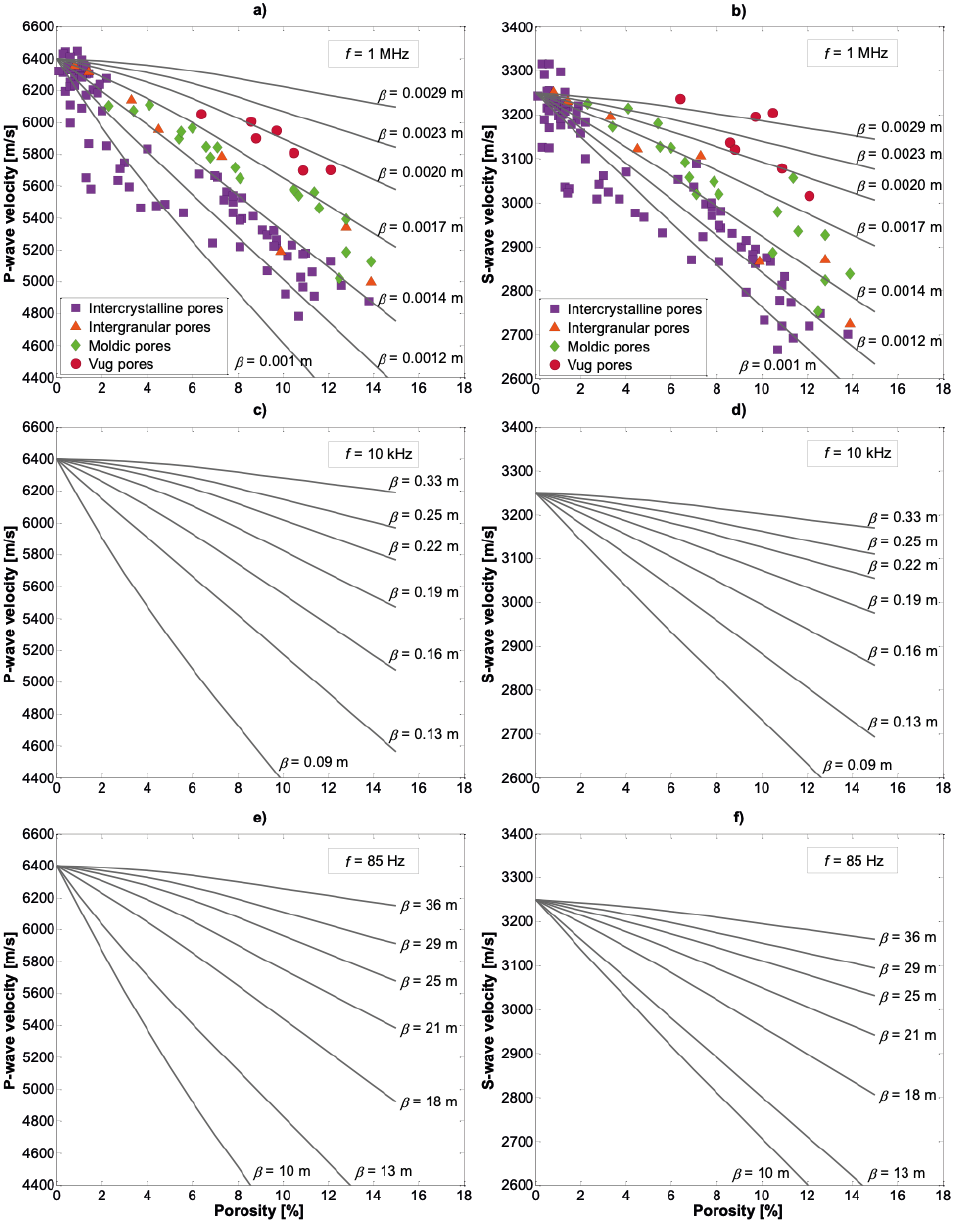
Figure 5 Effect of characteristic length (β) on modeled velocities taking into account θ=0° and α=0.15 plotted against porosity at different frequencies. a) P-wave and b) S-wave modeled velocities with different β on experimental data of P-wave and S- wave velocities, porosity, and pore type reported by Fournier et al. (2014) at ultrasonic frequency; c) compressional wave and d) shear wave velocities estimated with β values ranging from 0.09 to 0.33 m at sonic frequency; e) compressional waves and f) shear waves velocities estimated using effective dynamic properties with different values of // at seismic frequency.
The best characteristic length describing the pore size in the experimental data is β = 0.001 m (Figure 5a and b) which will be used to predict pore-structure in Section 5.3. This parameter was determined from the minimum curve that encompasses the maximum amount of velocity measurements. The velocities change with frequency because of wavelength changes as well as pore sizes. It means that at a sonic frequency, the size of pores or inclusions (β) ranging from 0.09 to 0.33 m (Figure 5c and d) and from 10 to 36 m at the seismic frequency in P- wave and S-wave velocities (Figure 5e and f). The parameters of β=0.09 m and β=10 m were chosen to predict the pore-structure at these frequencies. It is important to note that there is not velocity data from the same area of study using sonic and seismic frequencies.
These results display that f is a parameter related to the prediction of pore size (Figure 5). Indeed, the characteristic length is defined for identifying the pore sizes, which depend on the investigation scales (ultrasonic, sonic, and seismic) to predict the pore geometry since pore sizes influence the velocities.
5.2 Influence of wave incidence angle on anisotropic velocities
One of the fundamental parameters for predicting the pore-structure, considering anisotropy in carbonate rocks, is the wave incidence angle (θ); this represents the angle at which an electrical pulse is induced on the laboratory samples to measure ultrasonic velocities. Generally, these measurements are taken at 0° of incidence angle. Despite the difficulty represented by ultrasonic velocity measurements taken at a different angle, in this paper θ is included as an input parameter on the micromechanical model (Figure 2) to estimate compressional wave velocity (VP), horizontally (VSH) and vertically (VSV) polarized shear wave velocities at different angles. The propagation direction of VP (0°) is on the axis x3 , and the polarization direction for VSH (0°) is on the axis x2 and VSV (0°) on the axis x1.
The impact of varying θ between 0° to 90° on P-wave and S-wave velocities are shown in Figure 6a and b, respectively. The velocity variations from one angle (0°) to another (90°) are smaller at lower porosities (<4%); for example, when porosity is ϕ=4%, the compressional velocities are VP (0°)=6057 m/s and VP (90°)=6207 m/s; and shear wave velocities are VSH(0°)=3178 m/s and VSH (90°)=3231 m/s. But, if the porosity increases, the velocity variation become significantly higher than at low porosities, since VP (0°)=5196 m/s and VP (90°)=5785 m/s; VSV (0°)=VSH(0°)=2986 m/s and VSH (90°)=3185 m/s at ϕ=14%. This analysis also displays that the angle impacts more VP than VS at the ultrasonic frequency. Vertical and horizontal shear wave velocities are the same at θ=0° in transversely isotropic medium (Mavko et al., 2009).
The effect of θ in velocities at seismic frequency is higher than in sonic and ultrasonic frequencies as porosity increases (Figure 6), i.e., at 85 Hz, VP varies 912 m/s and VSH varies 273 m/s while at 10 kHz, VP varies 732 m/s and VSH varies 235 m/s between 0° and 90° at θ =14%. It was identified that θ influences the velocities when the porosity increases, and the effect is more significant as the frequency decreases. The incidence angle aims to upgrade the rock samples' anisotropic analysis because the micromechanical model can estimate anisotropic elastic moduli. It could also identify the preferential pore direction in rocks depending on the different pore shapes, but this needs to be validated.
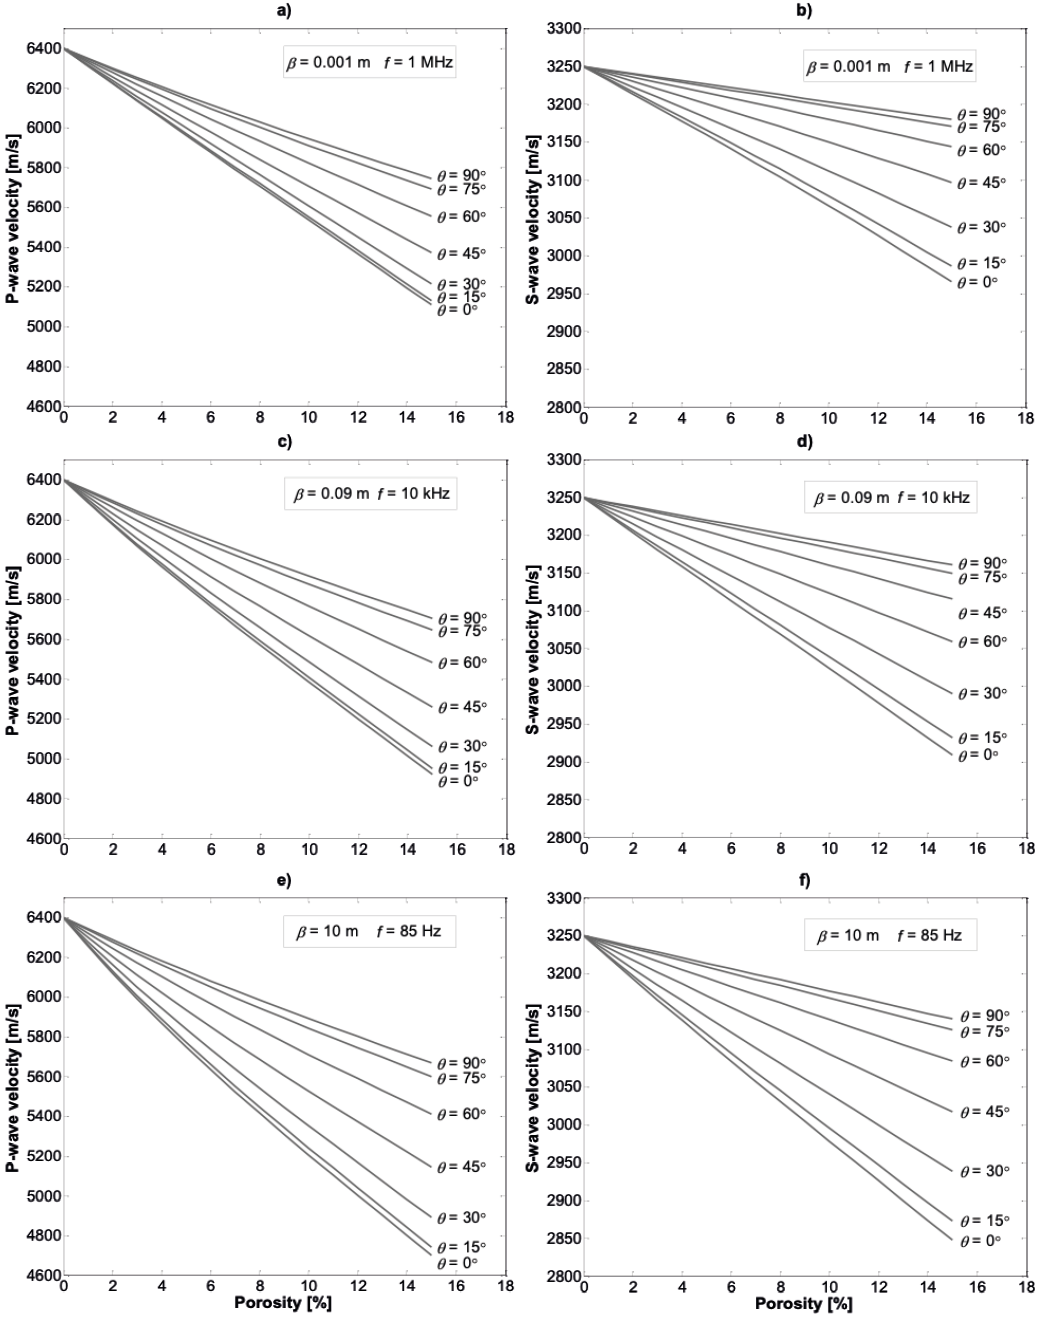
Figure 6 Anisotropy of P-wave and S-wave velocities estimated considering the wave incidence angle ranges from 0° to 90° with α=0.4 as a function of porosity; a) compressional wave and b) shear wave velocities at the ultrasonic frequency with a pore size of β=0.001 m; c) P-wave and d) S-wave velocities estimated at the sonic frequency with a pore size of β=0.09 m; e) P-wave and f) S-wave velocities at the seismic frequency with β=10 m.
5.3 Characterization and prediction of pore-structure
The Micromechanical model was applied to estimate effective dynamic properties considering the characteristic length (β), frequency (f), wave incidence angle (θ), aspect ratio (α), mineralogy, porosity (ϕ) and type of fluid to predict pore-structure in carbonates (Figure 7). The present work considers a long-wavelength (static) analysis according to Kinra and Anand (1982), which means that the wavelength is greater than the radius of the inclusion.
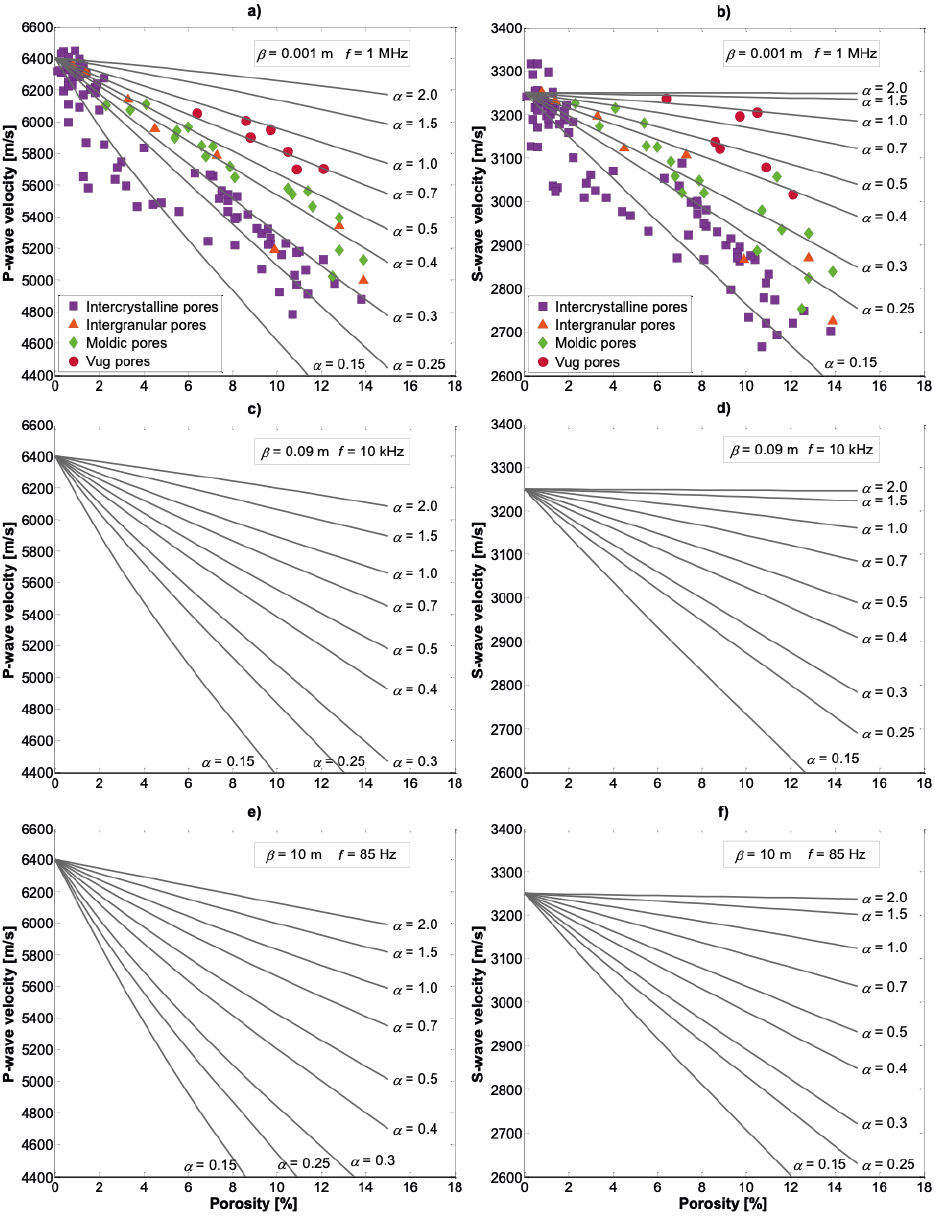
Figure 7 Characterization of the pore-structure considering different aspect ratios and θ=0° with the micromechanical model. a) Compressional wave and b) shear wave modeled as a function of porosity validated with experimental data of P-wave and S- wave velocities, porosity, and pore type taken from Fournier et al. (2014) at the ultrasonic frequency. c) P- wave and d) S- wave velocities plotted against porosity at the sonic frequency and e) P- wave and f) S- wave velocities versus porosity with a pore size of 10 m at seismic frequency. The velocity modeling predictions represent a velocity recognition pattern of dry samples at sonic and seismic frequencies.
The estimations of VP and VS consider parameters such as f=1 MHz and θ=0° to have the same conditions in which ultrasonic velocities were measured in the laboratory. Figure 7a shows that the pore-structure was identified from velocity modeling with different aspect ratio on experimental data of VP, where intercrystalline pores are elastically similar to flat ellipsoidal shape characterized by low α values (<0.35), while intergranular pores show aspect ratios ranging from 0.25 to 0.5. The intergranular and intercrystalline pores also reach a values up to 1 and 2 at low porosities (<2%), respectively. The pore geometries associated with moldic pores (0.3 < α < 0.5) are very similar to intergranular pores with an ellipsoidal shape. Finally, vug pores show a variation of 0.6 < α < 1 that geologically represents pores with a geometrical tendency to be under-rounded and spherical.
In contrast to VP, the prediction of pore-structure with VS is slightly different due to the deformation experienced by pores' motion when the elastic waves propagate through the rock. The results of pore-structure characterization from modeled shear wave indicates that intercrystalline pores have aspect ratio values similar to the predictions obtained with VP; intergranular pores show a values between 0.2 and 2. Moldic and vug pores exhibit α values ranging from 0.2 to 0.7 and 0.4 to 1.5, respectively (Figure 7b).
The velocity modeling results with characteristic length β =0.001 m at ultrasonic frequency show that higher porosities present greater error in estimating velocities if pore-structure is not considered (Figure 7a and b). According to aspect ratio values between 0.15 and 2, the variations of compressional velocities are 759 m/s, 1640 m/s, and more than 2000 m/s to 4%, 10%, and 15% porosities, respectively. For the shear wave velocities, the velocity discrepancies at the same porosities are 198 m/s, 485 m/s, and 720 m/s. The relative error of velocities at the porosities above mentioned are approximately 10%, 25%, and 35% in VP and 5%, 15%, and 20% in VS. In general, the relative error increases slightly as the frequency decreases (Figure 7).
According to Wang (1997), flat pores are easier to deform when waves propagate, in contrast to rounded pores, which are difficult to deform. It is important to point out that there are pore shapes that are more susceptible to a quick decline of velocity curves with porosity changes, i.e., pores with α > 0.7 do not show a pronounced decrease in the velocity-porosity relationship, pores with α =1 are considered isotropic and pores with low aspect ratios (0.15 < α < 0.5) whose velocity curves begin to decline at low porosities. The pore-structure at different pore sizes impacts velocity modeling almost the same way for the three ranges of frequency (Figure 7).
The results of pore-structure prediction in carbonate samples at ultrasonic frequency are different from those obtained by Fournier et al. (2014) and Fournier et al. (2018) that considers a pore type classification which can belong to reference, stiff and soft pores (Xu and Payne, 2008) with DEM. This method assumes an isotropic, linear, and elastic media with random inclusions inside a host, and the effective properties describe an isotropic medium. Only P- and S- wave velocities are predicted to high frequency with DEM (Appendix C). However, this method does not indicate a specific frequency, which is necessary to produce the ultrasonic pulse to obtain velocity measurements in the laboratory. In this research, the transversely isotropic media is considered, which means anisotropic media where the randomly aligned inclusions are embedded in the matrix (Figure 1a). Either vertical or horizontal, P- and S- wave velocities are computed with EMM at different angles and frequencies.
5.4 Prediction of anisotropy in carbonate rocks
The static moduli are obtained by measuring rock deformation in response to pressure applied; in contrast, dynamic moduli are calculated from acoustic velocities (Wang et al., 2016) through deformation of the rock experienced as the waves travel through a medium. The response of an isotropic medium is independent of the orientation of stress, the main axes of stress and strain coincide (Fjaer et al., 2008), but in an anisotropic medium, these vary axially and transversally.
In this section, Young's modulus (E33) and Poisson's ratio (v31) were calculated for a transversely isotropic medium from elastic constants of stiffness matrix (Appendix B). These are a function of VP (0°), VP (45°), VP (90°), VSH (0°) and VSH (90°) which were estimated considering three parameters: the frequency (f), characteristic length (β) and aspect ratio (α).
The predictions of E33 were compared with dynamic Young's moduli from ultrasonic velocity data (Figure 8a). There are two main classes of intercrystalline pores: the first type has variation in dynamic Young's moduli of 70 to 78 GPa with aspect ratio values ranging from 0.15 to 2 at low porosities(<2%); the second class presents a more significant dynamic Young's moduli variation of around 49 to 70 GPa with α values from 0.15 to 0.7, which indicates that the pores of rock samples are more deformable than the first class. Intergranular and moldic pores shown high variation in dynamic Young's moduli between 52 and 76 GPa, with 0.35 < α < 2. Finally, the vug pores present a pore-structure of 1 to greater than 2 of the aspect ratio. This analysis of E33 versus porosity helps to understand the elastic behavior of pores.
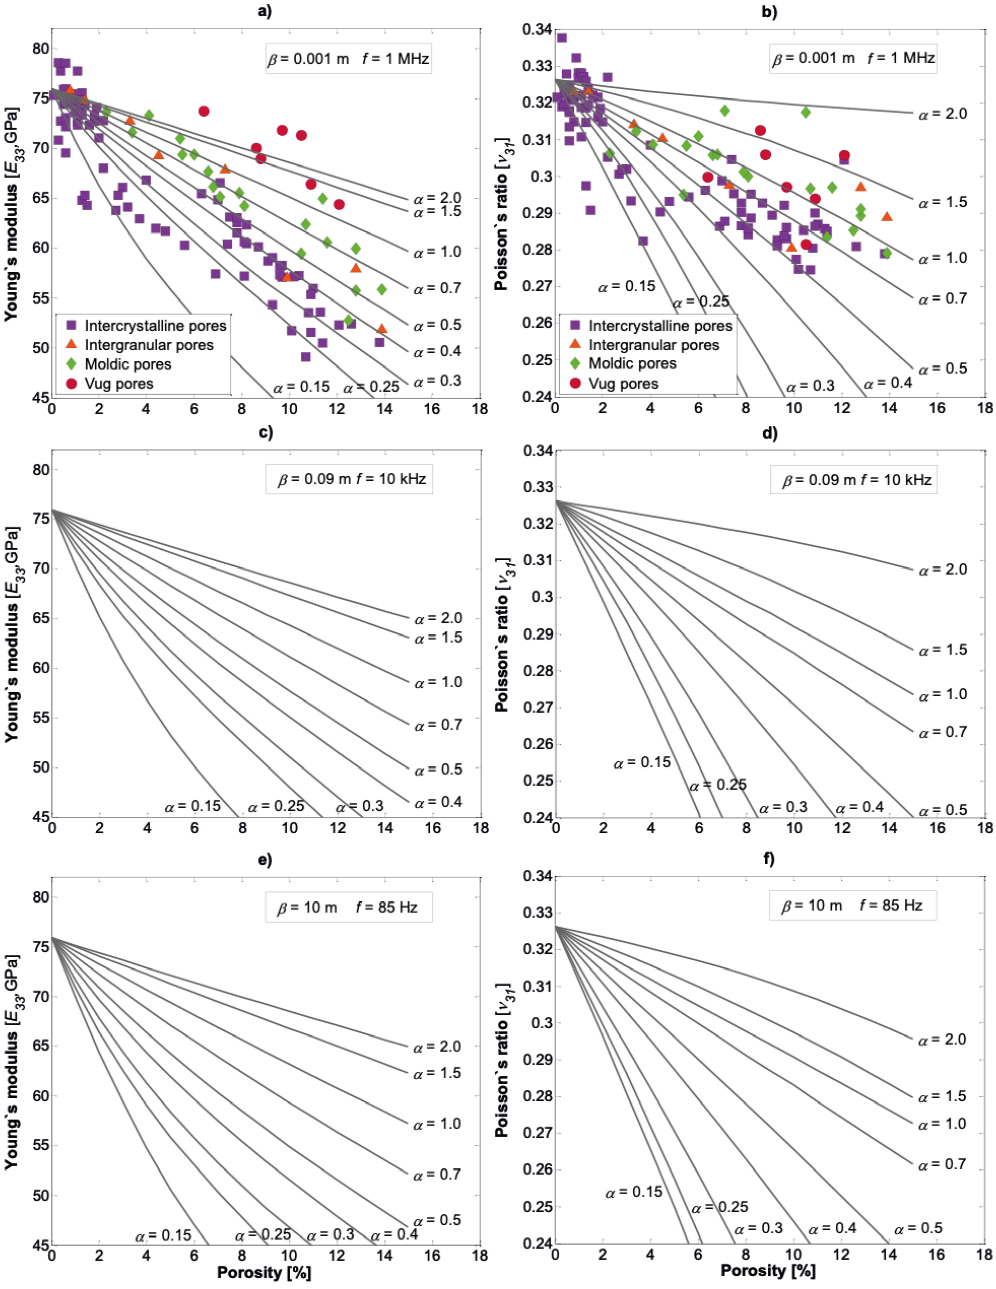
Figure 8 Anisotropic elastic moduli calculated to carbonates samples plotted against porosity considering different aspect ratios and frequencies. a) Young's modulus E33 and b) Poisson's ratio v31 compared with dynamic moduli of carbonate samples calculated from VP and VS taken from Fournier et al. (2014). c) Young's modulus E33 and d) Poisson's ratio v31 predicted at sonic frequency. e) Displaying E33 of 45-75 GPa considering aspect ratio variation and f) v31 decreases with increasing porosity at seismic frequency.
In Figure 8b, the pore-structure predictions with v31 were compared with dynamic Poisson's ratio. There are also two types of pores with dynamic Poisson's ratio values ranging approximately between 0.27 to 0.31 and 0.31 to 0.34. However, there was no trend of pore geometry for the different porosity types, probably due to the lateral strain induced in the x1 plane by uniaxial stress in the x3 plane. Another factor could be that the values of dynamic Poisson's ratio are not anisotropic, for this is necessary to measure the ultrasonic velocities as VP(45°), VP(90°) and VSH (90°) in the laboratory.
The E33 and v31 curves calculated at sonic frequency are shown in Figure 8c and d, respectively. The variation of E33 in the range of pore shapes (0.15 < α < 2) do not vary much (57-73 GPa) at 4% porosity, but for a high porosity (8%), E33 tends to vary in a more considerable proportion (45-70 GPa). The behavior of E33 is similar to dynamic Poisson's ratio because these curves (0.27< v31 <0.322) are not affected at 4% porosity, but when porosity increases (>8%), the discrepancy from the v31 curves for the same aspect ratio range is greater than 0.08.
The pore-structure that most affect Young's modulus and Poisson's ratio are those which have aspect ratios (α) ranging from 0.15 to 0.5, showing an abrupt decline of the elastic moduli curves with increasing porosity, while pores with α > 0.7 are less anisotropic at the frequencies analyzed. Indeed, the impact of pore shapes is critical in anisotropic elastic moduli. If pore-structure is considered, the anisotropic Young's modulus and Poisson's ratio will reduce the relative error in the interpretation of about 35% and 25%, respectively, at different frequencies for ϕ =15% (Figure 8).
Thomsen parameters ε, γ, and δ (Appendix B) were calculated to quantify anisotropy caused by the pore-structure at the ultrasonic frequency. The parameter ε refers to P-wave anisotropy, γ measures S-wave anisotropy, and δ is related to anellipticity of P-wave Meléndez-Martínez and Schmitt, (2013). The results show that the degree of P-anisotropy is greater (0.3 < ε) for pore shapes with 0.15 < α < 0.25 in porosity ranges between 9% and 15% than in pores with aspect ratios ranging from 0.3 < α < 0.7, whose e curves are defined by values of 0 < ε < 0.22. As mentioned before, pore types with α=1 lead an isotropic medium; for this reason, the calculated ε curve stays on the zero-line in the porosities analyzed here. When α >1, the range of anisotropy is from -0.04 < ε < 0. The curves with negative ε values indicate that the pore shapes change, i.e., horizontal ellipsoidal pore shape changes to vertical ellipsoidal shape (Figure 9a).
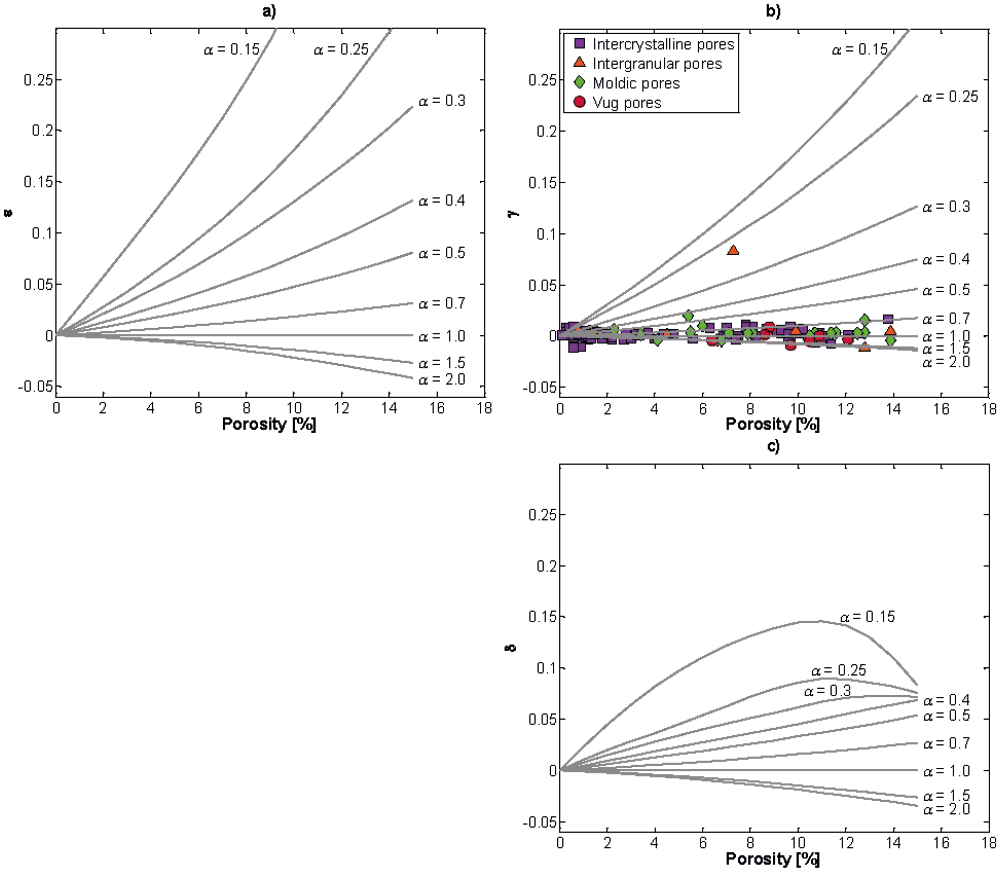
Figure 9 Thomsen parameter calculated as a function of porosity and aspect ratio at the ultrasonic frequency (1 MHz). a) Epsilon, b) γ curves are compared with an apparent y estimated from two polarized shear wave velocities with an angle of incidence at 0° reported by Fournier et al. (2014) and c) Delta.
The parameter γ was compared with an apparent y estimated with two polarized shear wave velocities orthogonal along the core axis. This data was taken from Fournier et al. (2014) of the same study area. Based on this analysis, it is observed that the pore-structure predictions in the estimations of VS (Figure 7b) do not coincide with the anisotropic parameter γ for different pore shapes (Figure 9b). γ remains constant for aspect ratio values between 0.7 and 2 in the pore types, except in moldic and intergranular pores whose a values also vary from 0.4 to 0.5 and 0.25, respectively. The S-wave anisotropy show values from -0.012 < γ < 0.083, which are within the γ values in carbonates samples by (Meléndez-Martínez and Schmitt, 2013). To obtain a more appropriate γ it would be necessary to measure VSH (90°) in the laboratory.
The analysis of δ parameter with 0.15 < α < 0.25 shows a convex tendency at high porosity values (>6%) (Figure 9c). The interval of aspect ratio ranging from 0.3 < α < 0.7 is similar to e results but with a lower degree of anisotropy, 0 < δ < 0.07 in the porosity range from 0 to 15%.
To summarize, the degree of anisotropy also depends on porosity and pore-structure. ε and δ are not as significant at porosities between 0 and 2% and the same for y from 0 to 4%. When the porosity increases, the pores with α values between 0.15 to 0.5 show greater anisotropy (Figure 9).
6. Conclusions
A micromechanical model based on the Effective Medium Method (EMM), which considers anisotropy, is used to improve the pore-structure characterization of carbonate rocks. This model predicts innovative effective dynamic properties for a transversely isotropic medium based on the rock microstructure. From these properties, velocities (VP ,VSH and VSH) are estimated considering the mineralogy, porosity, type of fluid filling the pore space, aspect ratio, characteristic length, wave incidence angle, and frequency.
The application of the EMM in carbonates describes a new element for a better understanding of how parameters such as characteristic length, aspect ratio, and frequency can modify the values of VP and VS for more than 35% and 20%, respectively. These percentages are according to the VP and VS measurements of carbonate samples. Another improvement of this work is the analysis of wave incidence angle on elastic responses, since measuring velocities at different frequencies from different directions, 0° to 90°, is currently a research challenge.
The pore-structure results with DEM are different from those obtained with EMM since this model considers an anisotropic medium together with the parameters mentioned above, enhancing the predictions of P- and S- wave velocities considering more realistic properties of the rocks.
Pore-structure in carbonate samples is characterized by aspect ratio (α). The analysis of VP modeling with velocity and porosity measurements, and pore type identifies that a values between 0.15 to 0.35 discriminate the intercrystalline pores, while intergranular pores are characterized by α from 0.25 to 0.5. Moldic pores present pore shapes similar to intergranular pores (0.3 < α < 0.5) except at low porosities, and, finally, the vug pores are larger than the previous ones with α range between 0.6 and 1. There is significant variability of velocity-porosity relationship with different α, and it is more relevant for pore shape with α < 0.5 than pore shape with α >0.7. It is related to velocity delay from 4% of porosity.
The shape of the pores also affects the estimation of dynamic anisotropic Young's modulus (E33) and Poisson's ratio (v31). An increase in porosity causes an abrupt decrease in elastic moduli of rocks with aspect ratio values between 0.15 and 0.5. Based on the dynamic elastic moduli obtained from the model, the Thomsen parameters (ε, γ, and δ) were computed to quantify anisotropy. It was found that for pore shapes ranging from 0.15 to 0.5, there is the most considerable variation of anisotropy.
The characteristic length is associated with pore sizes. The wavelength is different at ultrasonic, sonic, and seismic frequencies. Therefore, geoscientists can establish a recognition pattern for velocities related to pore-structure or geologic structures, depending on the analysis level.
The results provide additional elements based on micromechanical models to improve characterization and better understand carbonate reservoirs to identify major oil interest zones. The pore-structure prediction could be analyzed in saturated samples with water or oil and include more inclusions as mineralogical composition.

