


 nueva página del texto (beta)
 Inglés (pdf)
 Artículo en XML
 Referencias del artículo
 Enviar artículo por email
 Citado por SciELO
  Similares en
SciELO
Similares en
SciELO 
 Permalink
Introduction
Corrosion is the chemical process of the environment through which metals try to return to their original or mineral state (Roberge, 2018). In the case of buried pipelines, metals are exposed to corrosive processes that may eventually cause ruptures with the consequent environmental and economic damages (Beavers and Thompson, 1997). The pipe coating forms the main barrier against external corrosion by providing excellent protection; however, over time the coating deteriorates due to water absorption, tension and aggression caused by the soil and bacterial action, among others. Once the coating is damaged, the metal surface is exposed to the electrolyte medium (soil and/or water), the metal loses mass and, if this condition persists for some time, corrosion process and hydrocarbon leakage occur.
Oil spills have numerous effects on the environment and the economy, damaging waterways, animal life and plants. The main sources of hydrocarbon contamination are pipelines (Delgado et al., 2006), from small and permanent leakages up to a full collapse of the pipe. Therefore, external and internal inspections of pipelines are required to assess their integrity, as well as to determine the technical characteristics and their variations during the exploitation process.
The quality of the insulator coating determines the optimal strategy of the pipeline maintenance and the appropriated performance of the cathodic protection (CP) system (Morgan, 1993). The coating acts as an electrical insulator preventing electrical contact between the soil and the pipe (corrosion processes) and CP leakage current. Generally, in order to estimate the coating quality, electrical and electromagnetic (EM) non-destructive methods are applied on the surface. To detect coating damage, Direct Current of Voltage Gradient (DCVG) (Leeds and Grapiglia, 1995; Nicholson, 2007; DCVG, 2008) and Pipeline Current Mapper (PCM) (Radiodetection, 2009) methods are widely applied. These methods are based on measuring the electric potential and electrical currents along a pipe and the leakage current from a pipe to earth through the defects or damage in the coating. The main difference between these methods consists of the type of measurements: electric (DCVG measuring electrical potential with the aid of electrodes in contact with the soil (Masilela and Pereira, 1998)) or magnetic (PCM measuring magnetic field using one or more contactless sensors (Furquim, 2005; Radiodetection, 2009)). In case of DCVG, relations between voltage drops and direct observations made on pipe coating through excavations have been used to predict coating defect area (Anes‐Arteche et al., 2017). However, DCVG and PCM provide only qualitative information about the location of the leakage current and their results can be strongly affected by changes in soil resistivity (Mckinney, 2006), as well as by neighboring pipelines when the distance between pipes is comparable with (or less than) their depth. The main drawbacks in pipeline systems in Mexico are: corrosive soil characterized by a high clay content and low resistivity, pipeline interconnections including pipes that are out of service and the short distance between parallel pipelines compared to their depths, which reduces the possibilities for effective electrical or EM inspection based on surface measurements. Due to this, it is necessary to have inspection techniques that can determine the coating electrical resistance as a quantitative parameter of the coating quality. The Mexican Petroleum Institute has developed Surface Electromagnetic Pipeline Inspection (SEMPI) technology for quantitative assessment of the coating quality from parameters such as leakage current, leakage resistance and coating resistance. The application of SEMPI does not require the interruption of the pipeline operation and CP system.
In this paper, we present the SEMPI technology as a set of electric and EM methods that provide solutions to the aforementioned limitations. SEMPI technology is applied in two stages: regional (medium resolution) and local (high resolution). The adequate combination of both stages provides SEMPI with high efficiency and resolution.
During the regional stage, magnetic field measurements are performed in order to calculate the leakage current (Mousatov et al., 2012). For the quantitative assessing of the coating quality, the leakage and coating resistances along the pipeline are determined using additional voltage and soil resistivity (ρs) measurements. The main calculated parameters in the regional stages are: electrical coating resistance as the pipe coating quality indicator and ρs as a measurement of the soil corrosivity rate.
To localize coating holidays and evaluate their exposed areas, which are often a small part of the total pipeline surface, SEMPI technology should include a high-resolution measurement stage. The local (high resolution) stage includes detailed Alternating Current Voltage Gradient (ACVG) measurements generated by leakage currents on the anomalous pipe sections identified in the regional stage, allowing the precise location of damage in the coating and the calculation of equivalent unlined (holiday) areas.
We present practical results obtained in Mexico that demonstrate their effective implementation in the aforementioned situations. Specifically, we show two successfully achieved results: (1) the inspection of a 4 in outside diameter (OD) buried gas pipeline where the application of local and regional stages allowed the location and quantification of severe coating damages in sections of the pipes and, (2) the inspection of a 4 in OD buried gas pipeline with coating affected by contact with another pipe.
Description of Sempi Technology
Field methodology of SEMPI technology
SEMPI theory was developed in the Mexican Petroleum Institute by applying the principle of transmission lines (TL) as an approach to metal pipes (Chipman, 1968; Kaufman, 1989; Mousatov and Nakamura, 2001). The theory of TL has been used in the application of EM methods in studies such as to determine the formation resistivity in cased wells (Kaufman, 1989), the estimation of CP current (Morgan, 1993), and the detection of damaged coating (Mousatov et al., 2012).
Based on the equivalent parameters of the TL, voltage and current distributions along the pipe can be obtained. Voltage and current decrease along the pipeline as the distance increases from the generator connection point because the pipe has the finite resistance and part of current leaks through the pipe insulation. Taking into account the high conductivity of a metal pipe and the presence of a resistive insulating coating, we approximated the pipeline by TL using the distributed parameters (Mousatov and Nakamura, 2001). The pipeline with insulation damage (varied leakage resistance) can be analyzed as a non-uniform transmission line that consists of piecewise homogeneous segments where leakage resistance does not change over distance.
SEMPI includes two steps: regional measurements (medium-resolution) and detailed measurements (high-resolution).
1. Regional Stage of SEMPI
The implementation of the SEMPI regional or medium-resolution stage includes the following types of measurements: pipeline current (from the magnetic field) and voltages, and ρs.
During the regional stage, magnetic field measurements can be performed depending on the pipe route complexity, in two ways: along the pipeline and on profiles perpendicular to the pipes (Mousatov et al., 2012). To carry out current and voltage measurements, EM signal (98 Hz - 625 Hz) generators and meters are used. Current measurements are performed along the pipeline at intervals of 10 m or on profiles perpendicular to pipes at intervals of 10 - 25 m between profiles (Mousatov et al., 2012). Voltage measurements are made only in the control posts of CP system. Soil resistivity measurements are obtained along the profile parallel and separately ~ 7 - 8 m to the pipeline route using EM induction equipment EM31-MK2 (Geonics Limited, 2010) in horizontal polarization, i.e, for the case of both transmitter and receiver dipoles are horizontal coplanar, ensuring a maximum study depth of 3 m (McNeill, 1980). A Trimble GeoExplorer Geo XT 6000 Series (Trimble Navigation Limited, 2014) is used to obtain the UTM coordinates for sub-meter accurate.
For quantitative assessing of the coating quality, the leakage and coating resistances along pipeline are determined using additional voltage and ρs measurements. The main calculated parameters in the regional stages are: electrical resistance of the coating as a measure of coating quality and ρs as a measure of soil corrosivity.
1.1 Leakage current, leakage resistance and coating resistance
The leakage current (Il) is determined as the derivative or variation of I for a section of the pipeline.
Voltages values induced by the generator are measured at the control posts of the CP system. Taking into account the measured values, the function of voltage for the studied pipeline is determined using exponential functions. We have the voltage V(x) and Il(x) for each measurements point (x) of the pipeline, then, using Ohm´s law, leakage resistance Tl(x) is calculated using the following expression:
Tl not only depends on the coating quality, but also on Ts (soil resistance), which is a function of ρs. By knowing Tl and Ts , it is possible to calculate Tc as a quantitative parameter of the pipeline coating integrity by:
Where: Ts= K . ρs
K = geometrical constant that depends on the inner and outer radii of the soil hollow body around the pipe, considered in the calculation of Ts.
Equation (2) shows that Tc is the result of subtracting Ts from Tl , thereby removing the effect caused by variations in the soil resistivity on the leakage current magnitude. The magnitude of Ts around the pipeline proportionally influences the magnitude of Il (and therefore, the magnitude of Tl). Now, we have a value of Tc that is not affected by variations in the ρs, which only depends on the coating integrity.
The calculated values of Tc are plotted on scale type traffic lights in order to define a priority level to repair the damages detected in the coating. The color scale of the Tc graph is based on the theoretical modeling of pipelines with different magnitudes and types of damaged coating, as well as on experience in the application of SEMPI technology in different geological and hydrogeological environments. Tc > 250 Ohm.m (green) indicates that although there may be some damage to the coating, this does not expose the pipe to corrosion processes (good quality coating). Values in the range 50 Ohm.m ≤ T c ≤ 250 Ohm.m (yellow) indicate the existence of moderate damage to the coating (regular quality coating). The evolution of theses damages needs to be monitored in order to schedule future maintenance. Finally, Tc< 50 Ohm.m (red) indicates the existence of major damage to the coating, exposing the pipeline to corrosion processes (poor quality coating). Therefore, urgent repairs are required.
2. Local stage of SEMPI
Theoretical basis
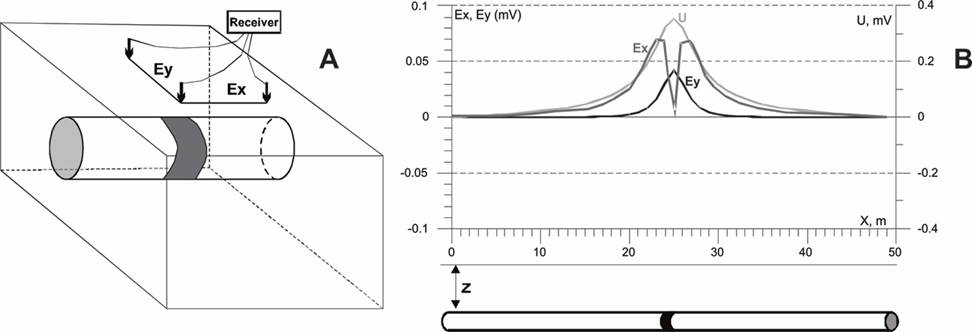
The local or high-resolution stage includes detailed measurements of the electric field. In a homogeneous semi space, the potential U of a punctual source is:
Where U is the electrical potential, Z is the source depth, X is the distance on the X axis between the source and the measurement point, Il is the leakage current from the source and ρs is the soil resistivity.
The horizontal components of the electric field (Ex, Ey) are determined using the following equations:
Now, if we consider a type "L” electrode array with a separation between electrodes of 1 m, is placed on pipeline to obtain the electric measurements (Figure 1A) and the step between measurement points along the pipe axis is 1 m, the anomaly magnitudes Ex and Ey depend on the leakage current (Il), pipe depth (Z), and ρs values (see equations (4) and (5). The measurements obtained are plotted in Figure 1B. The Ey anomaly is as simple as the U anomaly, while the Ex anomaly has two peaks separated by a minimum indicating the location of the source (Figure 1B). Due to this, in order to obtain the electric measurements in the local stage, only E y will be measured using an electric dipole oriented perpendicular to the pipe (Ey), placing one electrode above the pipeline.
3. Field methodology of the local stage and quantitative interpretation of the Ey anomalies
The interpretation of the Ey anomaly is required to determine the leakage current (Il) from the sources (coating damages). The process considers the cases of discrete and continuous sources. Discrete sources are considered when anomalies are isolated or separated (distance between anomalies is greater than their widths). Continuous sources are considered when anomalies are distributed over a pipeline axis that is continuously causing interference between them, and it is not possible to locate each source separately. Both cases were verified by data interpretation from pipeline models with discrete and continuous sources, showing that the total current leakage determined for discrete and continuous sources is equal and that both models are equivalent.
The interpretation process has a standard structure, complying with the following stages: initial model creation, calculation of fitting error between measured and calculated electric fields for the initial model, and finally, the fitting error minimization procedure. The Ey anomaly is used as an initial model, assuming that the leakage current value is equal to the electric field. Based on this model the algorithm converges faster.
The detailed measurements of electric field Ey on anomalous pipeline sections identified in the regional stage, in intervals of 1 m, allow the precise location of damages in the coating and its quantitative evaluation by the calculation of an unlined (holiday) equivalent area.
The intensity of the electric field in the soil surrounding the pipeline induced by leakage current (Il) is measured using an electric dipole perpendicularly oriented to the pipeline, placing one electrode above the pipe’s axis. Knowing the measured voltage difference (∆Uy) between the M and N electrodes, ρs, pipe depth (Z) and electric dipole length, it is possible to estimate the magnitude Il, using equation (5).
For each anomalous pipeline section, V values can be determined from the voltage distribution obtained during the application of the regional stage. By equations (1) and (2), Tl and Tc values, in intervals of 1 m on anomalous pipeline, are calculated, allowing the precise location of damage to the coating. If we consider Ti as the perfect or ideal condition of pipe coating, it is possible to determine the percentage of equivalent holiday area (EHA) for each meter of pipeline inspected by the electric field according to the expression:
The estimation of EHA provides a high-resolution quantitative assessment of the coating quality. Values of EHA> 5% indicate significant damages to the coating.
The local stage offers high-resolution results, but electric field measurements are slower than magnetic field measurements (regional stage). The implementation of the regional stage allows an overall assessment of the condition of the pipeline coating by defining the sections that require a detailed inspection in the local stage. The joint application of magnetic and electrical methods allows us to optimize the coating inspection works.
In conclusion, the application of both stages of SEMPI can solve the following problems: (1) location of the pipelines on the surface and at depth, (2) quantitative estimation of the coating quality, (3) detailed location of damages in the coating, (4) estimation of EHA (%) for each linear meter (5) and soil corrosivity assessment based on ρs values.
SEMPI Instrumentation and software
We have developed electromagnetic instruments to properly evaluate the insulation coating. The SEMPI instrumentation includes: a high power generator, a unified receiver for measurements of the magnetic-field, electric-field and voltage, induction antennas as magnetic field sensors and the SITIEMS software for processing and interpreting experimental data (Figure 2).
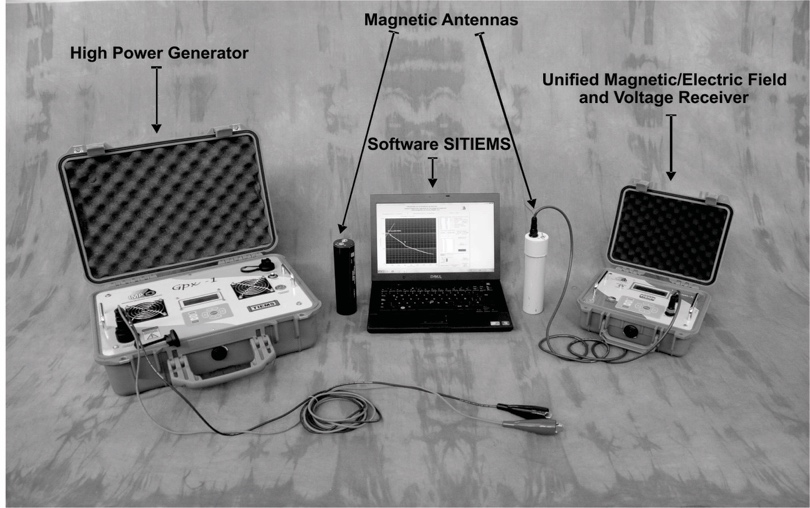
Figure 2 High power generator, unified magnetic-field, electric-field and potentials receiver, magnetic antennas and SITIEMS software.
The equipment developed is robust and able to work in different geographical and weather conditions. The high-power generator, high-resolution receiver and high-sensitivity antennas (Figure 2, Table 1), allow for the recording of reliable field data in pipeline routes under complex conditions (nearby pipelines and resistive subsoil).
Table 1 Technical Specifications of the SEMPI Instrumentation
| High Power Generator | Unified Receiver | Antennas |
|---|---|---|
| Input Power: 117 VAC; 5 A; 60 Hz | Maximum Input Voltage: 1.8 V | High Sensibility: 20 mV/ (mA/m) |
| Output Power: 400 VA | Resolution: 20 nV | Input Signal Sinusoidal |
| Maximum Output Voltage: 100 VAC | Input Frequency: 1, 2, 4, 8, 98, 512 and 625 Hz | Input Frequency: 98, 512 and 625 Hz |
| Output Current: 0.1, 0.25, 0.5, 1, 1,5, 2, 2.5, 3, 3.5, and 4 A | Digitally Programmable Gains: 1, 2, 5,10, 20, 50 y 100 | High Permeability Ferrite |
| LCD Display | LCD Display | Operating Temperature: -20°C to +95°C |
| Output Current Precision: ±0.002 A. | Signal Strength Indicator | Maximum Operating Humidity:70 % |
| KeyPad: 9 Functions Keys | KeyPad: 9 Functions Keys | Whether Resistance Case |
| Output Frequency: 1, 2, 4, 8, 98, 512 and 625 Hz | 50 Hz and 60 Hz Power Line Rejection | Dimensions: Cylinder, Ø=5 cm, h=19.5 cm |
| Frequency Precision: ±0.1% Hz | Operating Temperature: -20°C to +55°C | Weight 1.5 Kg |
| Operating Temperature: -20°C to +55°C | Two Internal Rechargeable Batteries | |
| Maximum Operating Humidity: 70 % | Maximum Operating Humidity:70 % | |
| Whether Resistance Case | Whether Resistance Case | |
| Dimensions: 47 x 35.7 x 17.6 cm | Dimensions: 27 x 24.6 x 12.4 cm | |
| Weight: 10 Kg | Weight: 3.5 Kg |
Resolution of SEMPI
Case 1: Coating damages as holiday or disbondment
The holiday or disbondment area is often a small part of the pipeline surface through a significant magnitude of current leaks to the soil. High resolution is required to find these small damages. To study the resolution in determining coating damage, we analyzed the distributions of the magnetic field along the pipe as a function of the distance between the measurement points. Figure 3A shows a pipe with severe damage in the coating in the interval 249 m to 251 m (Tc2= 100 Ohm.m). In the intervals 0 ≤ x < 249 m and 251 < x ≤ 500 m, the coating quality is perfect (Tc1= Tc3= 10,000 Ohm.m). The model includes the following metal pipe parameters: conductivity σ = 107 Ohm/m, OD = 0.2 m, wall thickness Δr = 0.01 m. The AC generator (625 Hz) is connected to the starting point of the pipeline (x = 0 m). The proposed distances between measurement points along the pipeline were: 10, 20, 40 and 50 m.
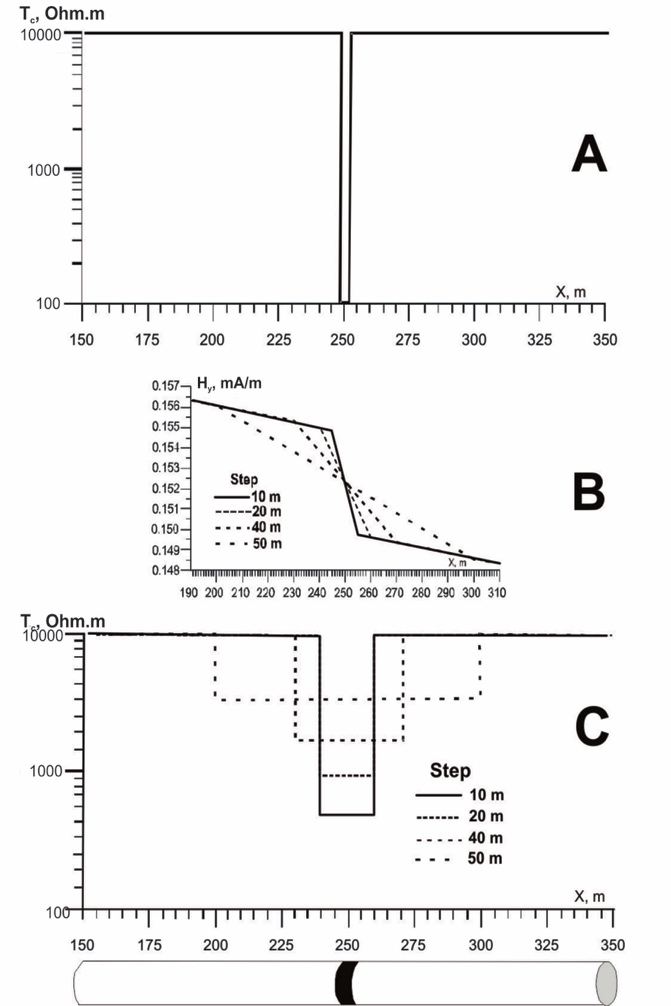
Figure 3 A) Model of pipe with damaged coating at interval 249 to 251 m, with coating resistance (Tc) values of damaged coating = 100 Ohm.m and coating in good condition, Tc= 10,000 Ohm.m. B) Magnetic field measured for different measurement intervals.
Figure 3B shows the behavior of the magnetic field (Hy) obtained for different lengths of the measuring step. The resolution of the technique depends on the measurement interval of the magnetic field. When the measuring step increases the resolution in the localization (Figure 3B) and quantification (Figure 3C) of the damaged coating decreases. For example, for the 10 m and 20 m steps, the leakage current anomaly shows damaged coating in a pipeline section length 20 m (medium resolution), with Tc= 650 Ohm.m, considerably less than 10,000 Ohm.m; the 50 m step locates a longer pipeline section (low resolution) with a Tc value (5,000 Ohm.m), which is less anomalous than those determined for shorter measurement steps. However, even for large measurement steps (e.g. 50 m), the leakage current through the damaged coating is expressed by a fall in the magnitude of Hy. This feature provides the implementation of magnetic field measurements that are more productive and efficient than electrical measurements (DCVG or ACVG methods), which require measurements at short steps (e.g. 1 m) to detect the current leakage caused by the damaged coating.
Case 2: Deteriorating and weakening of coating
The deterioration or weakening of the coating may include the presence of small fractures, pores, or the thinning of coating, in small or large areas of the coating surface. The magnitude of leakage current per lineal meter is less than the leakage current from a holiday area.
Figure 4 shows a section of pipeline with coating damaged by pores and fractures distributed in the interval 175 m to 310 m, reaching the minimal values of Tc= 650 Ohm.m in the interval 240 m < x ≤ 250 m. In the intervals 150 ≤ x < 175 m, and 310 < x ≤ 350 m the coating quality is perfect (Tc= 10,000 Ohm.m). The pipe model (Figure 4A) includes the same pipeline parameters as those used in the model for Figure 1, as well as the measurement steps (Figures 4B and 4C). Following the example of Figure 4, we have falls in the Hy field in all measuring steps, whereas each Tc graph (Figure 4B) shows different resolution levels according to the measuring step. The Tc graph for the 10 m step (Figure 4B) is similar to the pipe model (Figure 4A).
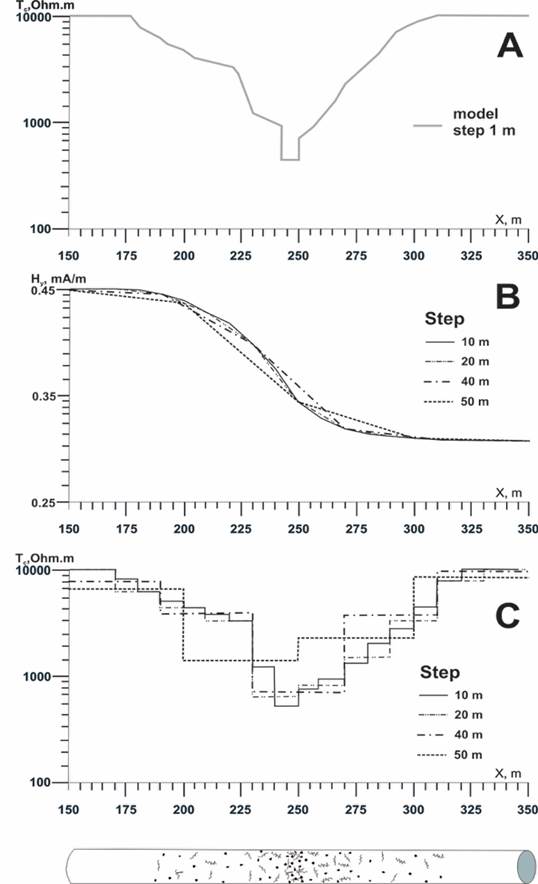
Figure 4 A) Model of pipe with irregular deteriorating (pores and fractures) of coating in the 175 m - 310 m pipe section, and coating in good condition (Tc= 10,000 Ohm.m) in the 150 m - 175 m and 310 m - 350 m sections. B) Magnetic field measured for different measurement intervals. C) Coating resistance recalculated from different measurement steps.
SEMPI is designed to perform magnetic field measurements in intervals of 10-50 m to identify damaged sections of pipeline. Therefore, SEMPI technology is effective both for localization and quantification of pipe sections with holiday-disbondment (punctual) type coating damage, as well as coating damage formed by a set of pores and fractures distributed along pipeline. Subsequently, local measurements will be applied in these detected sections in order to accurately locate the damage to the coating, these being the EM technique; thereby optimizing time and cost for their application in extensive pipeline routes.
Practical examples of application of sempi technology
SEMPI has been applied in experimental studies of pipeline technical conditions in several places in Mexico. We present two practical cases of application of this technology for inspection of buried pipelines in Southeast Mexico.
A soil resistivity profile parallel (and separately ~ 7 m) to the pipeline route was obtained using EM induction equipment EM31-MK2 (Geonics Limited, 2010) for a maximum study depth of 3 m.
Case 1: Localization and quantification of holiday in buried gas pipeline
SEMPI was applied for the inspection of a 4 in OD gas pipeline located in the state of Tabasco, Mexico. The inspected pipe length was 11.2 km and it passes through dry silt-loam soil.
The generator, at a frequency of 512 Hz, was connected to the pipeline at the control point of the cathodic protection system. Perpendicular profiles to pipe axis were taken with step measurements of 0.5 m. The spacing between profiles was 25 m.
The leakage current is determined as the derivative or variation of the current along the pipeline. By equation (1) Tl values are calculated. The EM profiling method was applied in order to obtain the ρs values along pipeline route and, then, Ts values are calculated (equation (2)). In wetlands, water salinity values were determined at measurement points near to the pipeline. From equation (2) the Tc values were determined.
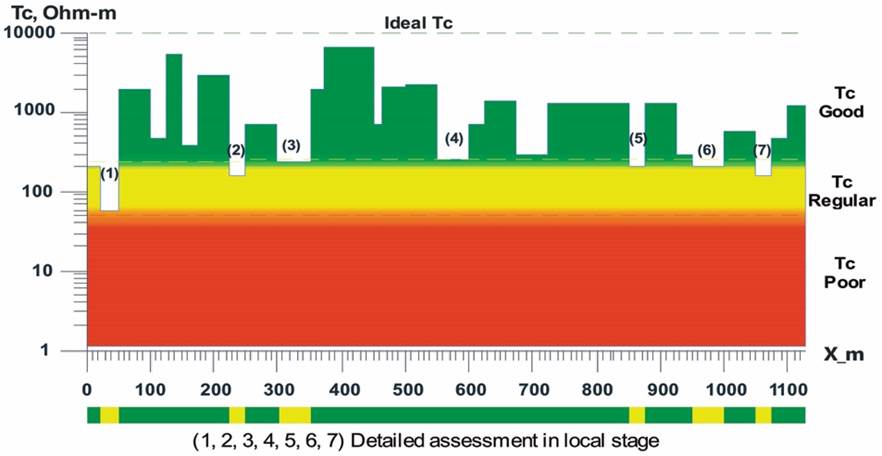
Figure 5 shows the Tc graph for the inspected pipeline, confirming that SEMPI is able to not only to locate, but also adequately quantify coating damages. Based on the results shown in Figure 5, some representative points of the condition of pipeline coating (green, yellow and red zones) were selected to carry out detailed electric measurements for precise localization and quantification of the damages in the coating.
Evaluation of soil corrosivity
Some soil parameters are taken into account to assess their corrosiveness, mainly electrical resistivity and pH (Schwerdtfeger, 1965). Electrical resistivity depends closely on soil moisture and the salinity of pore-water, therefore it is an effective indicator of soil corrosion level. Low soil resistivity values are related with high corrosivity and the opposite is also true, being commonly used to assess corrosion potential in underground pipelines (Putra et al., 1977). The classification of soil corrosivity based on resistivity values is shown in Table 2.
Table 2 Soil corrosivity rating based on resistivity values (Roberge, 2012).
| Soil resistivity (Ohm.m) | Corrosivity Rating |
|---|---|
| >200 | Essentially non-corrosive |
| 100 to 200 | Mildly corrosive |
| 50 to 10,000 | Moderately corrosive |
| 30 to 50 | Corrosive |
| 10 to 30 | Highly corrosive |
| <10 | Extremely corrosive |
The ground resistivity around the pipe was estimated every 25 m using EM induction equipment EM31-MK2 (Geonics Limited, 2010) in a horizontal polarization, ensuring a maximum study depth of 3 m. Soil resistivity measurements are needed for the calculation of T s . These measurements can also be used to estimate the aggressiveness degree or corrosivity rating of soils based on electrical resistivity values (Roberge, 2018). The majority of soil along the pipeline route is moderately to mildly corrosive, exceeding 100 Ohm.m (resistive soil) in some parts of the pipeline route values; only in anomalous zones (1) and (4) (Figure 5) is the soil is classified as corrosive (ρs < 50 Ohm.m).
Figure 6 shows the results achieved from the application of the local stage in the anomalous area (4) (pipe interval 540 m - 605 m, see Figure 5), where electric field measurements were performed at interval of 1 m (Figure 6A). The experimental data of the electric field are used in an inversion process by taking into account voltage, soil resistivity and pipe depth values, resulting in the fitting of the theoretical and experimental curves and the determination of the Tc and EHA (%) values for each lineal meter of the pipeline (Figure 6B). Two minimum values of Tc are determined at points 554 m and 586 m, reaching EHA values of 35% and 29%, respectively.
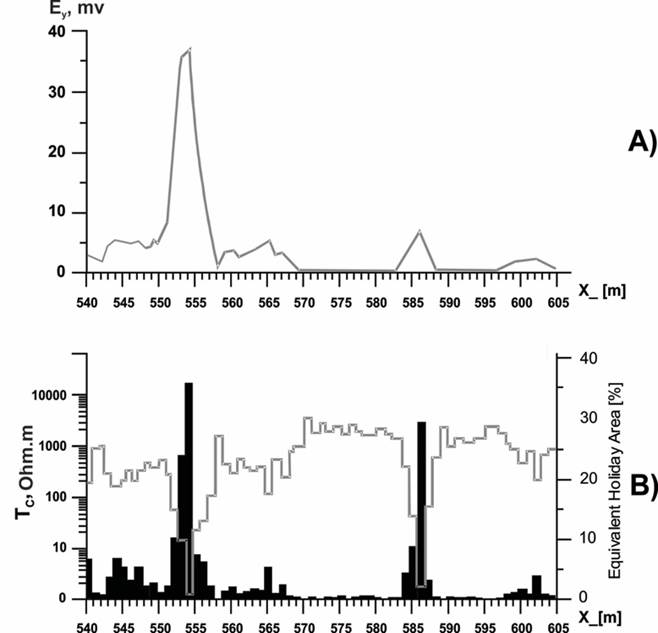
Figure 6 Results obtained from local stage of SEMPI applied in the anomalous pipeline interval 540 m - 605 m determined in the regional stage (see Figure 4). A) Electric field measurements. B) Detailed Tc values and EHA percentage.
Subsequent excavations were carried out at every (1 to 7) anomalous interval determined in the regional stage of SEMPI. Figure 7A shows the 1.5 m x 2.5 m excavation carried out at the pipe anomalous interval 4 (see Figure 5), which confirms the existence of severe damage (holiday) to the insulation coating at point 554 m (Figure 7B) causing a major leakage current from the cathodic protection (CP) system and, consequently, corrosion processes. This result confirms that SEMPI is able, not only to locate, but also to adequately quantify coating damage.

Case 2: Damages in the coating caused by contact between pipes
In order to evaluate the coating quality of a 4 in OD gas pipeline of 2.4 km length, the local and regional stages of the SEMPI were performed. Through the application of the regional stage the Tc values obtained (Figure 8) show an overall good condition of the coating with a mean value of Tc= 2,438 Ohm.m (Figure 8), reaching in some pipe intervals the ideal value of 10,000 Ohm.m. In some small intervals there are low Tc anomalies. Most Tc anomalies indicate moderate damage to the coating (yellow zone, Figure 8). However, the pipeline interval 670 m - 700 m presents severe damage in the coating (red zone, Tc= 30 Ohm.m, Figure 8). This critical pipeline interval must be inspected at high resolution through the application of the local stage of the SEMPI.
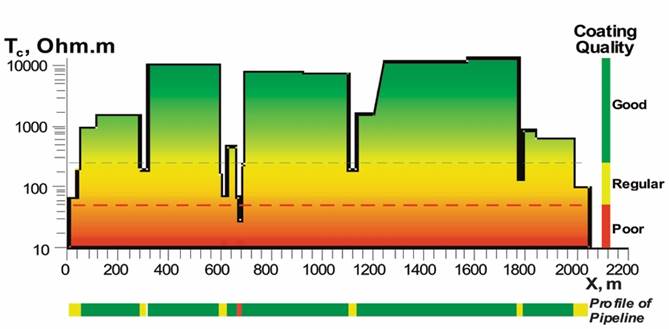
Figure 8 Coating resistance (Tc) for the 4 in OD gas pipeline. Tc graph indicate a zone with poor quality coating at interval 670 m - 700 m. Plan view of the pipeline with the Tc color scale is presented below the Tc graph.
The electrical resistivity of soil surrounding the pipeline has a mean value of 35 Ohm.m, being classified as corrosive. Three water samples collected along the pipeline route show low salinity (0.35 g/l); however, the high clay content of soil (low resistivity of soil) could facilitate corrosion processes. At the pipeline anomalous interval 674 m - 692 m, detailed electric field measurements were performed. Tc and the equivalent unlined area, with a 1 m step, were determined.
Figure 9 shows the detailed behavior of Tc , observing a minimum of 10 Ohm.m in the interval X = 681-682 m. The EHA reaches a maximum of 13% at X = 682 m, as a point where pipeline has critical damage to the coating. At the point X = 682 m an excavation (Figure 10A) was conducted which confirms the existence of physical contact between the 4 in OD gas pipeline and the 10 in OD oil pipeline (Figure 10B). This physical-electrical contact between pipes produces a major leakage current from the CP system and, consequently, corrosion processes.
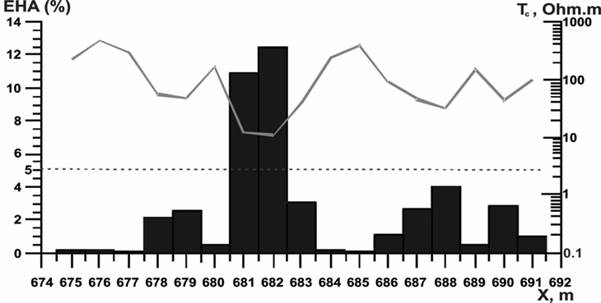
Figure 9 EHA and Tc values, for the anomalous 4 in OD gas pipeline interval 674 m - 692 m, determined in the local stage.
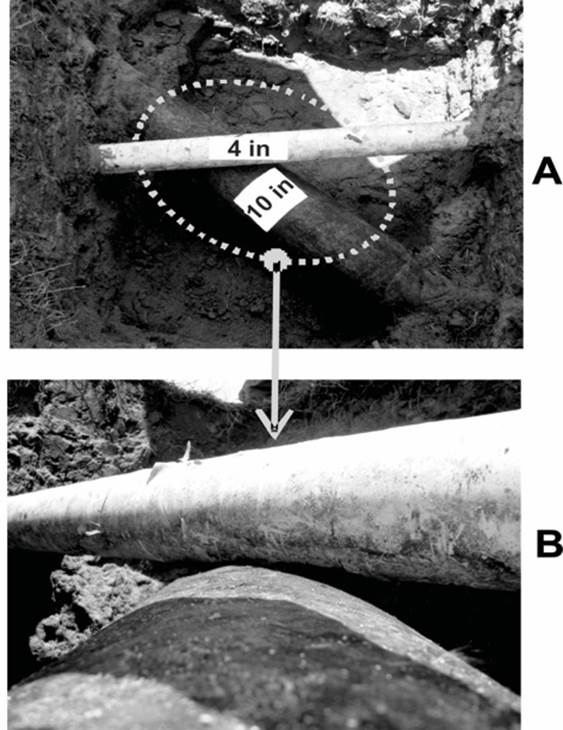
Figure 10 Excavation at X = 682 m of 4 in OD gas pipeline. A) Plan view of the excavation with pipelines crossing. B) Zoomed view of the contact between pipes that causes damage in the coating.
We recommended repairing the pipeline coating at the point X = 682 m and the installation of devices to electrically isolate both pipes, thus optimizing the CP system of the 4 in OD gas pipeline.
These results demonstrate the optimal application of a regional magnetic field measurements stage, then detailed measurements of the electric field on regional anomalies zones, obtaining accurate results without affecting the efficiency of SEMPI technology.
Conclusions
SEMPI technology was developed on the basis of LT theory, which allows the modeling of different types of pipe coating damages (holiday, disbondment, pores, fractures), as well as different types of soil surrounding the pipeline. The main result of SEMPI is the determination of the coating resistance (Tc ) values along the pipeline, which indicate the quality of the pipe coating.
SEMPI technology consists of two stages: a regional or medium resolution consisting of fast magnetic field (pipe current and voltage) and soil (and water salinity) resistivity measurements, and local stage or high resolution based on the electric field measurement.
The efficiency and high resolution of SEMPI lies in the implementation of the regional stage that defines the pipeline intervals with a similar coating quality, then a local stage in order to locate and quantify the coating damages detected in the regional stage. The application of both stages gives SEMPI technology a high efficiency and resolution.
Finally, in this work successful results from the application of SEMPI technology in pipelines located in the southeast region of Mexico were presented, showing the effectiveness of SEMPI technology in determining the coating integrity of pipelines buried both in corrosive (conductive) soil, in soil with a low corrosivity rating, as well as physical-electrical contact with another pipeline.

