


 nueva página del texto (beta)
 Inglés (pdf)
 Artículo en XML
 Referencias del artículo
 Enviar artículo por email
 Citado por SciELO
  Similares en
SciELO
Similares en
SciELO 
 Permalink
INTRODUCTION
Mexico is located in the so-called Pacific Fire Belt, so the main source of seismic hazard is associated with the interslab earthquakes located in the subduction zone formed by Cocos and North-American plates. Mexico City is more than 300 km away from the subduction zone. Despite this, historically, the damage caused by interslab earthquakes is considerable, mainly because the local soil effects yield significant amplification in a large part of the city. These local effects are because a large area of Mexico City is located over the ancient Texcoco, Xochimilco and Tlahuac lakes. The September 19, 1985 earthquake (Mw8.1), whose epicenter was 315km away, is the leading example of this type of subduction earthquakes.
Normal fault earthquakes, with depths between 40 to 80km, are also crucial for the seismicity in Mexico City, especially for lakebed zones with dominant soil periods between 1.0 and 1.8s (S. K. Singh et al. 2018). The September 19, 2017, intraslab earthquake (Mw7.1), whose epicenter was located near the limits between the states of Puebla and Morelos at approximately 120km from Mexico City, caused severe damage in Mexico City, Morelos, Puebla and the State of Mexico. In Mexico City, more than 40 collapsed buildings were reported, and hundreds had moderate and severe damage. The intensities reordered in some areas of the city, especially in zones with periods between 0.5s and 1.8s, were relatively high, even surpassing values of 1.0g, and the vertical component, due to the proximity of the earthquake, was unusually high for Mexico City.
The main seismic problem of Mexico City is the large amplification that occurs due to the clay deposits of the ancient Texcoco Lake. Singh et al., 1988 and Reinoso, 1991 reported spectral amplifications close to 500 times to what typical strong ground motion equations predict at similar epicentral distances. The site effects of the lakebed zone of the city strongly modify the seismic responses of the soil, which may vary considerably within a few hundred meters.
There are several proposals to estimate the site effects of the Valley of Mexico. Some authors such as Pérez-Rocha et al. 1991, Reinoso et al. 1997, Baena-Rivera et al. 2017 and Cruz-Atienza et al. 2016 used numerical implementations to analyze the wave propagation within basins.. Other works are based on the use of data from weak motion to study the vibrating soil period (Ordaz et al. 1988, Lermo and Chavez-Garcia 1994), combined methodologies through Bayesian models (Perez-Rocha 1998) or using Fourier spectral ratios to compute the lakebed amplifications with respect to the hill zone (Reinoso and Ordaz 1999).
Mexico City is one of the largest and most populated cities in the world, which house approximately 20 million people. One of the main problems to deal with is the water supply, around 60m3/s a day, of which more than 60% (≈40m3/s) is extracted from underground aquifers located below the city (Arroyo et al. 2013). There is a recharge problem because, annually, only 75% of these aquifers are replenished naturally. This intensive water pumping has contributed to the consolidation of the soft soils of the Valley of Mexico, causing exceptional levels of subsidence of the soil and changing the characteristics of the soil and its response to earthquakes.
This article analyzes the spectral ratios of accelerometric stations in the lakebed of Mexico City, with respect to the average Fourier spectrum at firm soil sites, so that changes in the behavior of local effects and their relationship with the damage presented during the earthquake of September 19, 2017, is discussed. Also, pseudoacceleration maps and the hysteretic energy demands that could be associated with the reported damages are presented and analyzed.
Accelerometric stations and earthquakes
Figure 1 shows the 77 accelerometric stations of Mexico City analyzed in this study. A large portion of the Valley of Mexico is located over the ancient Texcoco Lake. The lakebed has a dominant soil period larger than 0.5s and even reaching periods over 5.0s near the international airport zone (stations 02 and 31).
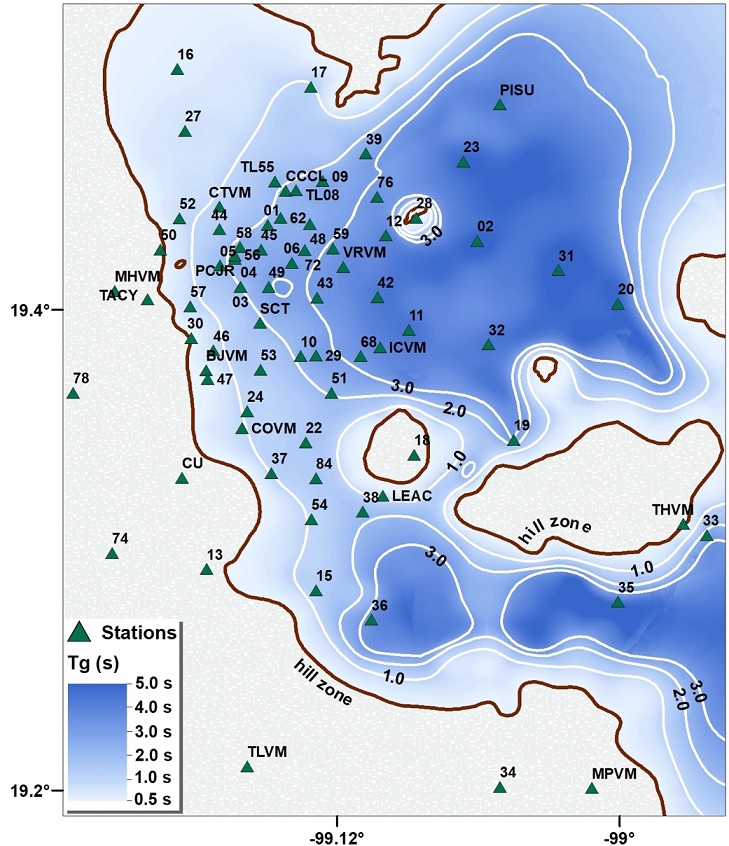
The information and data of the accelerometric stations was obtained from the “Centro de Investigación y Registro Sísmico (CIRES)” and the Institute of Geophysics of the UNAM. The CIRES accelerometric network began in 1987, and has 80 devices, 66 accelerometers at surface registration stations, 6 accelerometers installed in two structures and 8 underground registration sensors. In this article, only records at surface stations were considered. These accelerometers record the information on a PCMCIA card with the capacity to store 34 minutes of data. They have adjustable pre-event memory to record up to 56 seconds before the earthquake and post-event up to 64 seconds after the moment when the earthquake acceleration is less than the selected trigger level (CIRES, n.d.).
Due to the wide range of soil periods, the lakebed zone can be characterized by the dominant period of the site, which can be seen in Figure 1. The zone with the period limit in 0.5s is called the Hill zone. Likewise, in the lakebed zone, the subsoil can reach periods ranging from 0.5s to even more than 5.0s in zones with very deep clay soil-layers.
For this study, the seismic events reported in were used. These events correspond to the most representative earthquakes that occurred in Mexico since the Michoacán earthquake of 1985. The seismic network of the Valley of Mexico, before the September 19, 1985 earthquake, was very small, so the records used for this particular earthquake correspond only to stations CU01, TACY, and SCT.
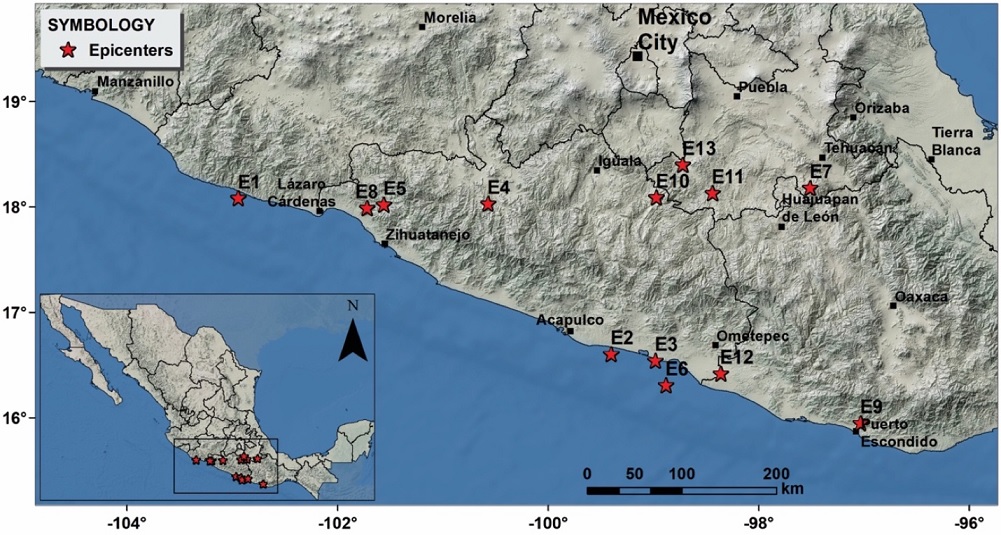
The epicenters of the events mentioned in are shown in Figure 2.
Site amplifications using fourier spectral ratios
There are several ways of obtaining the site amplification (Field, et al.; Sakaff, 1991, Reinoso and Ordaz 1999), some of which use inversion techniques (E. H. Field and Jacob 1995) although this type of techniques is does not work for the Mexico City valley (Gutiérrez and Singh 1992). Due to the almost linear behavior of the lakebed sites in Mexico City, the technique used in this article is the Fourier spectral ratios, which has been used in soft soils such as those in Mexico City with favorable results (Shri Krishna Singh et al. 1988) (Reinoso and Ordaz 1999). The Fourier spectral rates presented in this section help us to understand the dominant period and amplification of the soil, as well as their variation over time
1 Hill zone amplitude Fourier spectra
Site response using spectral ratios for only one hill zone site should be avoided (E. Field, et al., 1992) because minor differences among hill zone sites could yield significant lakebed amplifications challenging to explain in terms of physical reasons. As Reinoso and Ordaz (1999) suggested, an average Fourier spectrum for hill-zone stations must be used. Likewise, in the same article there is a discussion of the smoothing of the Fourier spectra and recommendations for their use for spectral quotient purposes. Figure 3 shows, with grey lines, the smoothed amplitude Fourier spectra of hill zone accelerometric stations for different earthquakes and, with a dark line, the mean spectra of the EW component. As shown in Figure 3, amplitude differences are relatively small, but there are peak values, due to very local site conditions, that can affect the spectral ratios, so using the average spectra softens the hill zone response and, therefore, the spectral ratio. The stations chosen to compute the hill zone mean spectra (Reinoso and Ordaz 1999) are those which are located in the South-West zone of Mexico City: 78, 74, 50, 34, 07, 13, TACY and CU (Figure 1)
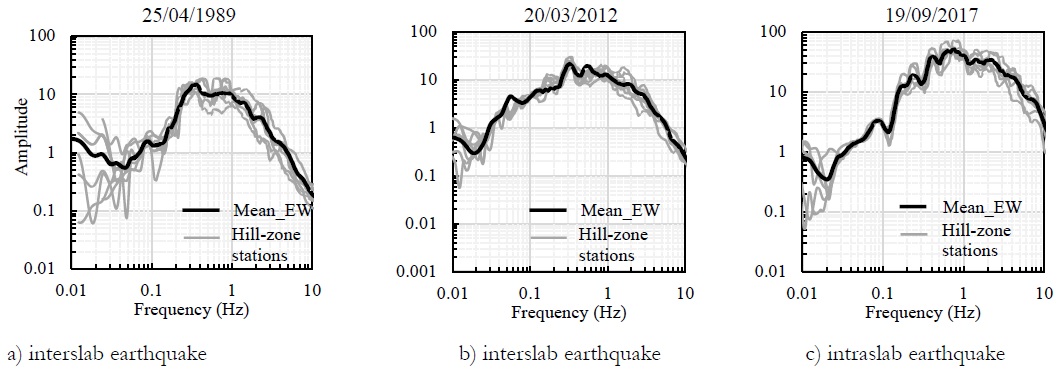
Figure 3 Smoothed amplitude Fourier spectra of hill zone accelerometric stations for different earthquakes and mean Fourier amplitude spectra at hill zone
Figure 4 shows the average Fourier spectra for hill zone stations and all thirteen earthquakes presented in Table 1. Two groups of seismic events that follow similar behavior are noticed: interslab and intraslab earthquakes, shown in Figure 4a and Figure 4b, respectively. Figure 4c shows a comparison of the two most important and intense earthquakes of each kind; both occurred in September 19, the inslab one in 1985, and the intraslab one in 2017. Both earthquakes show different amplitudes, the 19/09/2017 earthquake presents peak values for frequencies larger than 1.0 Hz, while the 09/19/1985 one shows larger amplitudes for frequencies smaller than 1.0 Hz.
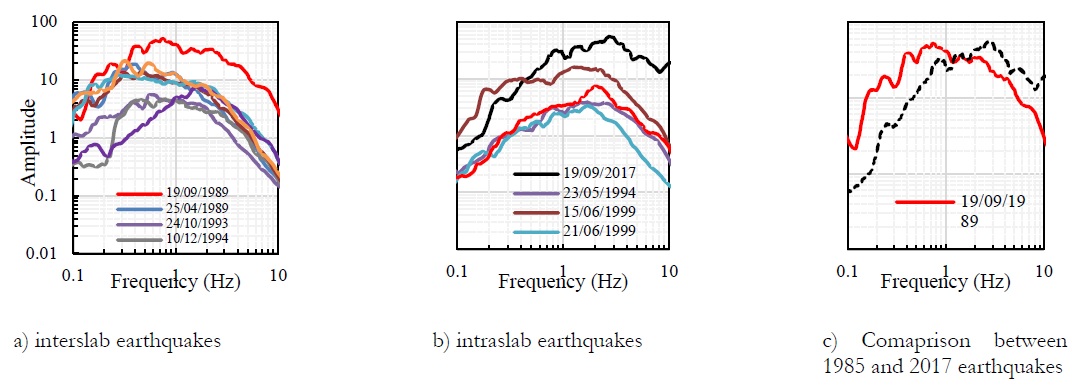
Figure 4 Average Fourier spectra for hill zone accelerometric stations and for the thirteen events reported in Table 1 (EW direction): a) Interslab earthquakes, b) intraslab earthquakes and c) comparison between average Fourier spectra of both events occurred in September 19 (1985, inslab, and 2017, intraslab).
Table 1 Earthquakes used in the study
| ID | Event | Magnitude (Mw) | Fault type | Epicental distance (km) |
| E1 | 19/09/1985 | 8.0 | Subduction | 394 |
| E2 | 25/04/1989 | 6.9 | Subduction | 303 |
| E3 | 24/10/1993 | 6.6 | Subduction | 299 |
| E4 | 10/12/1994 | 6.4 | Subduction | 288 |
| E5 | 23/05/1994 | 6.2 | Normal | 206 |
| E6 | 14/09/1995 | 7.3 | Subduction | 320 |
| E7 | 15/06/1999 | 6.9 | Normal | 218 |
| E8 | 21/06/1999 | 6.3 | Normal | 295 |
| E9 | 30/09/1999 | 7.4 | Subduction | 420 |
| E10 | 21/07/2000 | 5.8 | Normal | 136 |
| E11 | 22/05/2009 | 5.6 | Subduction | 157 |
| E12 | 20/03/2012 | 7.4 | Subduction | 335 |
| E13 | 19/09/2017 | 7.1 | Normal | 130 |
2 Lakebed zone spectral ratios
Mexico City has some of the most pronounced site effects known. For some frequencies, the amplification can be up 500 times to epicentral sites, and up to 100 times the observed at hill zone. As stated by Ordaz et al. 1988, Singh et al. 1988 and Reinoso and Ordaz 1999, the lakebed zone soil responds approximately as the one-dimensional theory predicts, however, there are some sites where evidence of 2D or 3D behavior, or at least a non 1D one has been captured by spectral ratios (Reinoso and Ordaz 1999). Spectral ratios have been computed since the 1985 earthquake and have shown to be relatively constant for different sources, epicentral distances, and magnitudes. The spectral ratios theoretically remove most of the effects from the source and path, and only leaves the site effect. However, there is evidence that in recent years, the soft-soil response in some regions of the lakebed zone has changed, mostly due to anthropogenic conditions, in particular, ground subsidence produced by groundwater withdrawal (Avilés and Pérez-Rocha 2010, Arroyo et al. 2013).
In order to present the main changes and observations, we have selected five accelerometric stations that are considered as representative of the site amplification: SCT, 37, 12, 20, and 84. The Fourier spectral ratios were computed for each one of these stations, considering the mean spectrum for the hill zone, as explained above.
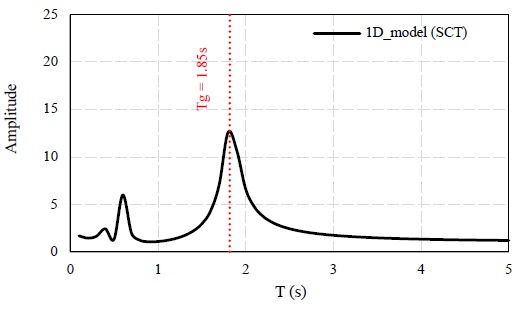
Station SCT
This site is located where severe damage was observed during both September 19 earthquakes. Accelerometric data obtained in station SCT is extremely valuable to study site effects due to clay deposits shows the 1D model for station SCT and the spectral ratios computed for this site, for ten events, and both orthogonal directions. As shown in this figure, the amplification pattern between both orthogonal components is similar (with the exception of 25/04/1989 earthquake) with a peak amplitude between 10 and 15 times. The peak amplitude almost matches the predicted by the 1D theory; however, there are differences in amplitudes among periods longer and shorter than the dominant soil period. Its behavior remains similar to that reported by Reinoso and Ordaz 1999.
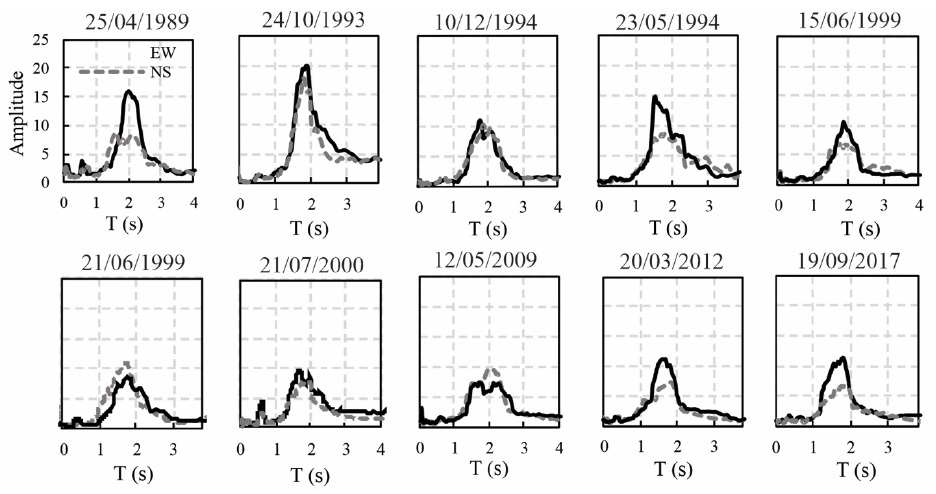
Station 37
This site is over the less thick soil deposits, also known as transition zone, with peak amplification between 5 and 10 for a site period of 1s. This station represents all stations located in similar lakebed zone sites where amplification has been very similar for all earthquakes, and no significant variation of spectral ratios (amplification and dominant period) has been observed due to epicentral distance, magnitude or fault type. This station is located in a highly-populated area where damage was severe during the September 19, 2017 earthquake. Figure 7 shows the spectral ratios computed for this site, for nine events and both orthogonal components of motion.
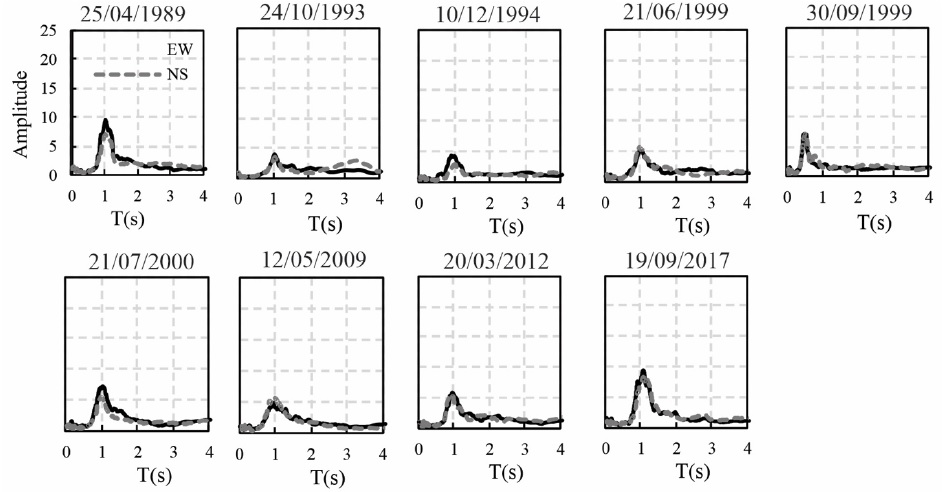
Station 12
This site is located in a zone with clay deposits 40-50m deep, next to a hill zone near the Mexico City airport. Very little damage was reported there during both September 19 earthquakes.
Figure 8 shows the spectral ratios computed for this site, for ten events, and both horizontal components. The amplitude of the NS direction shows more considerable amplification for the 15/06/1999, 10/12/1994, and 21/06/1999 earthquakes, reaching amplitudes differences up to 80%.
These differences may be caused by basin-edge effects due to its proximity to a hill zone. On the other hand, apart from differences in amplitude, a decrease in the dominant soil period close to 25% can be observed, with values from 4.10s measured during the 1989 event, to 3.15s, during the 2017, one. This variation will be discussed later in this work.
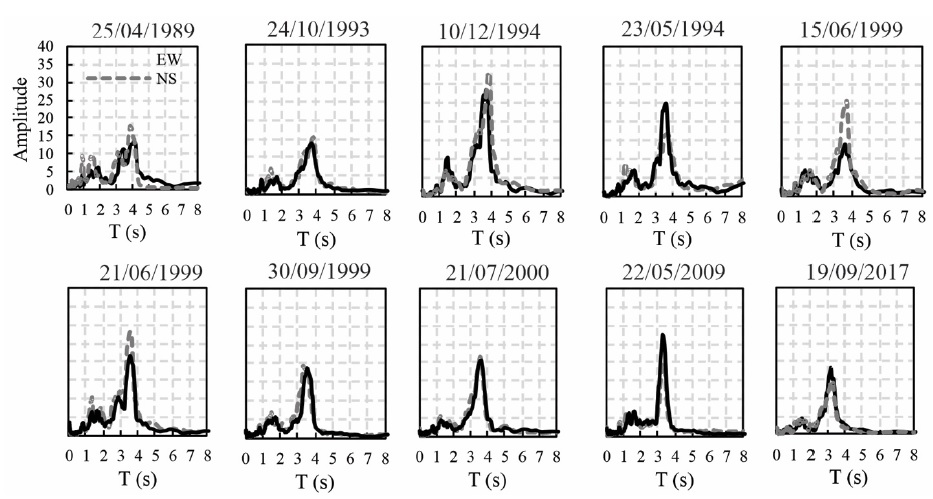
Station 20
This site is over the deepest soil deposits of the ancient Texcoco Lake. No damage has been reported around this station after any earthquake since few structures could vibrate with the very large dominant periods of this site; however, second to third vibration modes of the site, with periods around 1s, may present amplifications up to 10 times, similar to those observed at other lakebed zone sites where damage and even collapses were reported. Figure 9 shows the spectral ratios computed for this site, for nine events, and for both orthogonal directions. We observe that amplifications are up to 40 times the hill-zone response and that there is a complex amplification pattern. Similar to station 12, the decrease in the dominant soil period for this station along 28 years is about 12%, with values ranging from 4.8s during the 1989 event, to 4.25s, for 2017 one.
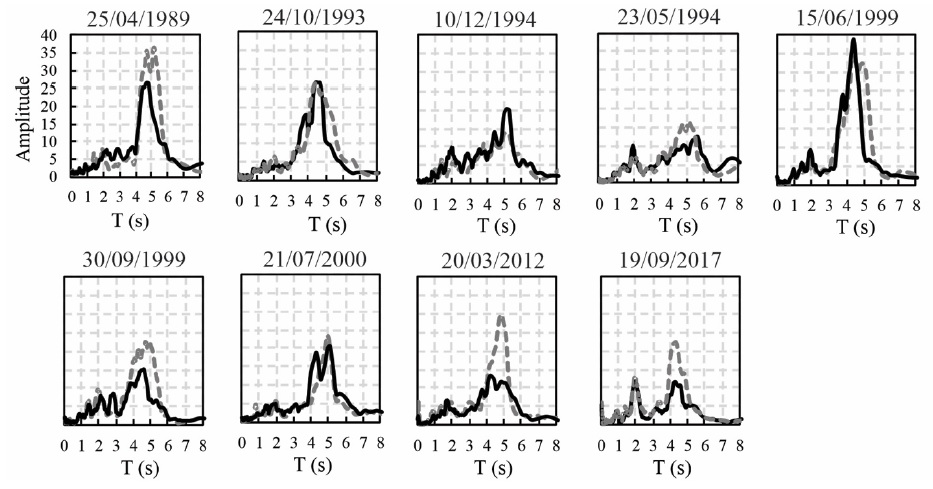
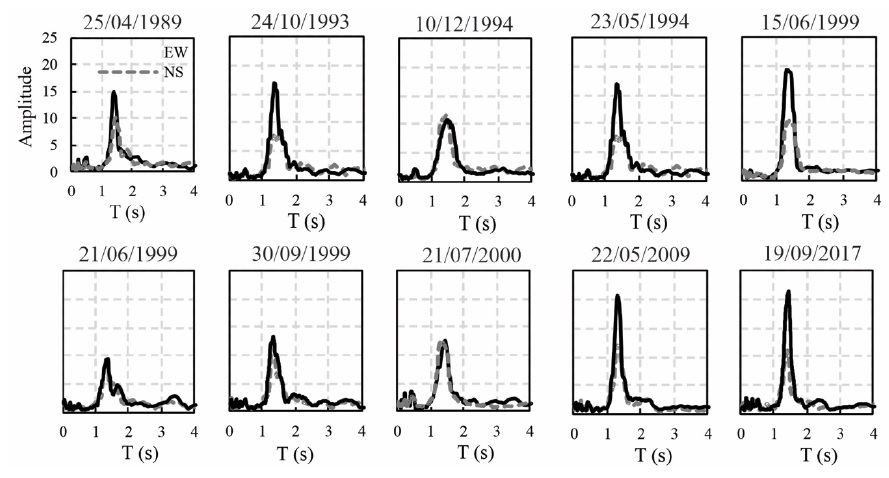
Station 84
This site is also located in a dense residential area, between two relatively close (5-6 km) hill zones (see Figure 1): the “Cerro de la Estrella” and the western hill zone. During the September 19, 2017 earthquake, this station recorded the highest intensity in the history of the Mexico City accelerometric network. Table 2 shows the accelerometric stations that have recorded the largest PGA in Mexico City during the last 40 years and the ten most intense computed peak spectral acceleration for some of the earthquakes of Table 1 (and Figure 2) and other historical ones.
Table 2 Largest intensities recorded in the Mexico City accelerometric network; station 84 shows the maximum values during the September 19, 2017 earthquake
| Event | Station | Tg | PGA (cm/s2) |
Peak spectral acceleration (cm/s2) |
| 19/09/2017 | 84 | 1.4 | 227.9 | 1531.2 |
| 19/09/1985 | SCT | 1.9 | 121.4 | 912.5 |
| 14/09/1995 | 35 | 5 | 66.68 | 314.5 |
| 20/03/2012 | 35 | 5 | 62.61 | 404.4 |
| 25/04/1989 | 35 | 5 | 62.54 | 316.7 |
| 14/03/1979 | TXSO | 0.6 | 53.37 | 289.5 |
| 24/10/1980 | SXVI | 0.5 | 46.6 | 120.6 |
| 30/09/1999 | 35 | 5 | 43.18 | 184.2 |
| 15/06/1999 | 36 | 3.6 | 40.92 | 180.3 |
| 22/05/2009 | 54 | 1.1 | 33 | 82.9 |
The proximity of station 84 to the hill “Cerro de la Estrella” and western lakebed borders suggests an amplification pattern that cannot be explained by the 1D theory. Reinoso and Ordaz 1999 have reported observations of 3D amplification patterns for other sites in the lakebed zone. Figure 10 shows the 1D model for station 84 and Figure 11 the spectral ratios computed for this site, for ten events and for both orthogonal components, where it can be seen that the amplitudes for the NS direction remain relatively constant regardless of the earthquake. However, the NS direction shows an amplification pattern that is very different from those predicted by the one-dimensional model. Higher amplifications were computed for intraslab events 23/05/1994, 15/06/1999, 22/05/2009, and 19/09/2017. The amplification change, only observed in the EW direction, could be due to basin-edge effects (Reinoso and Ordaz 1999).
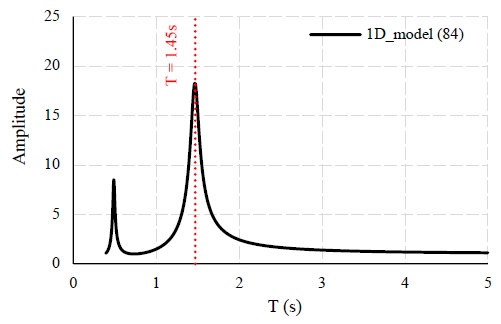
To analyze this behavior, an attempt has been made to correlate parameters, such as azimuth, magnitude and fault mechanism. However, the strongest correlation that was found is the following. Figure 12 shows the peak amplitude at the dominant period of site 84 (T=1.4 s) and the hypocentral distance of the earthquake, together with the expected amplification value given by a 1D model considering rough information of the site (dashed line). Figure 12 shows the variation of the amplitude to the hypocentral distance of different interslab and intraslab earthquakes. Figure 12a shows that the computed amplitude for the NS direction is very similar and around the prediction by the 1D theory. Moreover, Figure 12b shows, for the EW direction, a trend that can be correlated with the hypocentral distance showing twice the amplification for shorter distances. Whatever the type of site effect, it is something that it is present only with close events and has only been observed for this station.
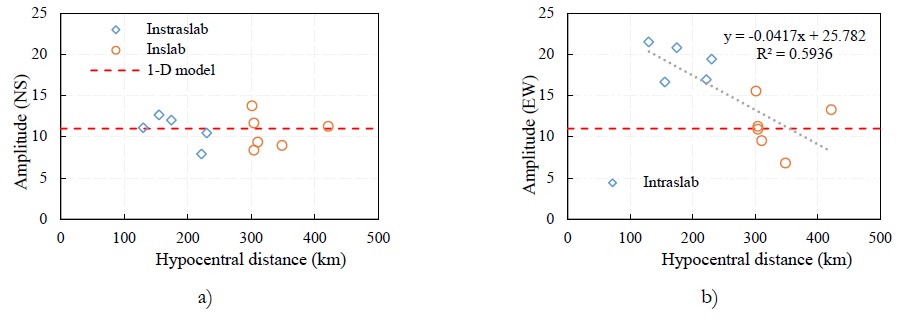
Figure 12 Correlation between peak amplitude with hypocentral distance: a) NS direction and b) EW direction. Dashed line represents the one-dimensional amplitude.
3 Soil dominant vibration period behavior
Estimating the soil vibration period (Tg) with the smallest uncertainty is important since it is directly correlated to the seismic response of structures. The Mexico City Building Code takes this into account as the design spectra are based on Tg. The code contains a very detailed map of Tg, built a few years ago with information from spectral ratios, geotechnical studies, and weak motions. However, some evidence proves that this Tg has changed over time (Avilés and Pérez-Rocha 2010, Arroyo et al. 2013). The variation of Tg was examined for all earthquakes of Table 1 and Figure 2, and all accelerometric stations of the lake-bed zone (Figure 1). Figure 13 shows for the most representative twenty-five accelerometric stations the variation of the dominant soil period as a function of time, with an open circle, and the corresponding trend with dotted-line. It can be seen that there are sites with a clear trend of shortening the soil period over time. The rates of period-change vary from site to site being almost null for some stations, to up to 20% for others.
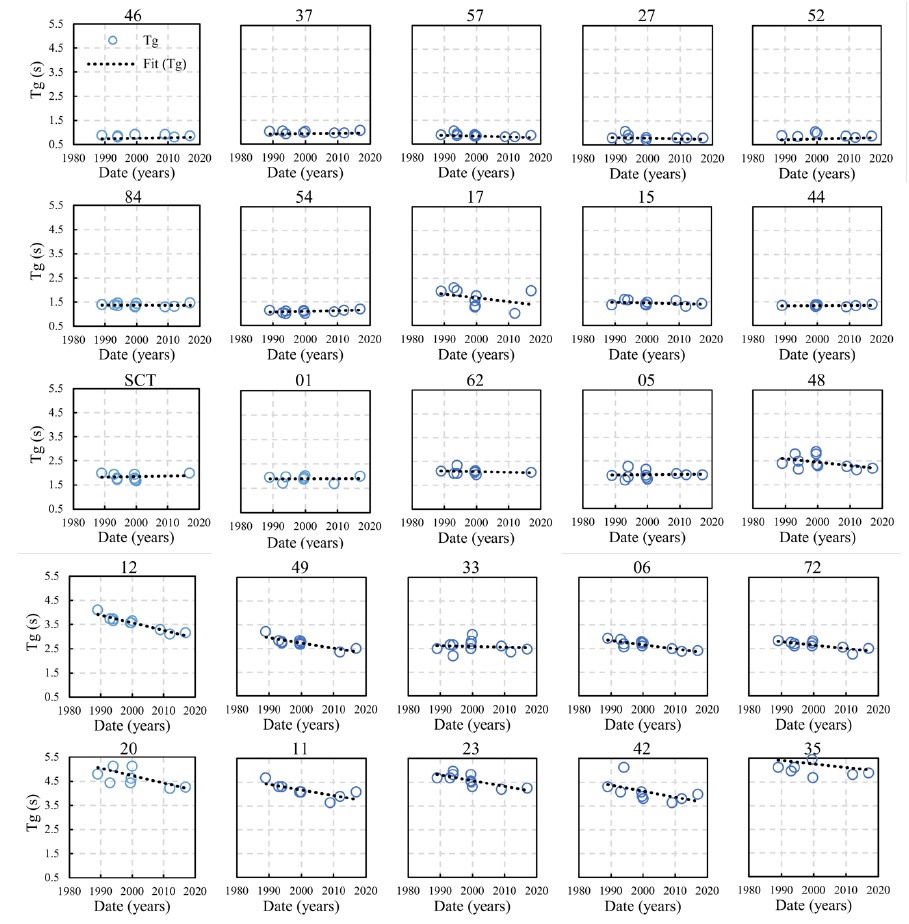
Figure 13 Variation of the soil dominant period over time for 25 selected accelerometric stations in Mexico City
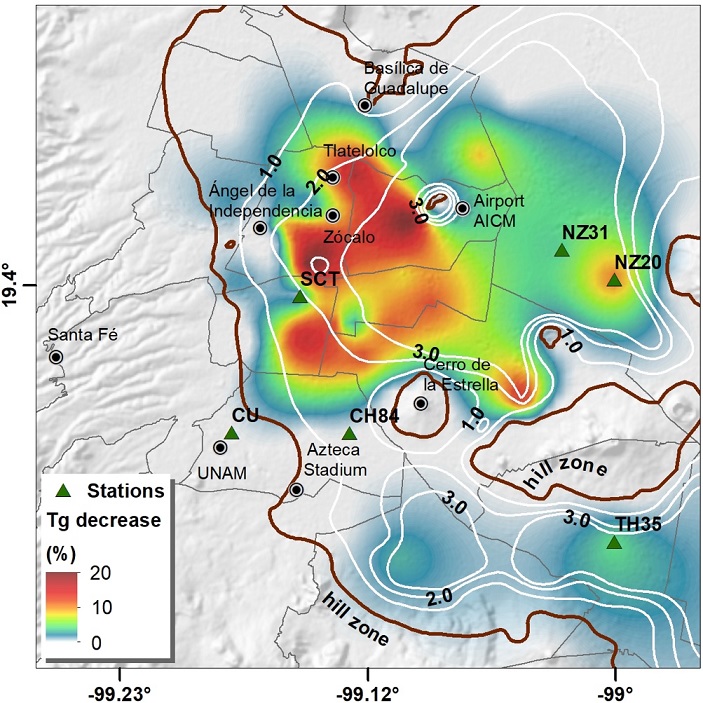
A map with the dominant soil period decreases is shown in Figure 14. This figure shows the decrease (in percentage) of the dominant soil periods between those computed during the April 25, 1989, and September 19, 2017 earthquakes, using the spectral ratios shown in this article. The results shown in Figure 14 do not correspond to any approximate model and are based on real data and earthquakes recorded by the accelerometric network of Mexico City. However, it should be considered that results could have minor changes if a special interpolation were used, similar to those proposed by Perez-Rocha (1998) and Worden et al. (2018).
4 Fourier spectral amplifications
A similar analysis was performed for the maximum spectral amplification of each station at the lakebed zone. That is, if, according to the previous section, the dominant period at a given station changed, maximum amplification is the observed for this changed period. Figure 15 shows the time-variations maximum spectral amplitude for 25 accelerometric stations. This amplification is the maximum computed in the spectral ratio, no matter at which period, for each station and earthquake, and both orthogonal components (EW amplification, open circles, NS component, filled triangles); trends are plotted with dotted lines. The observed variations as a function of time are different for both orthogonal components, and no overall trend is observed.
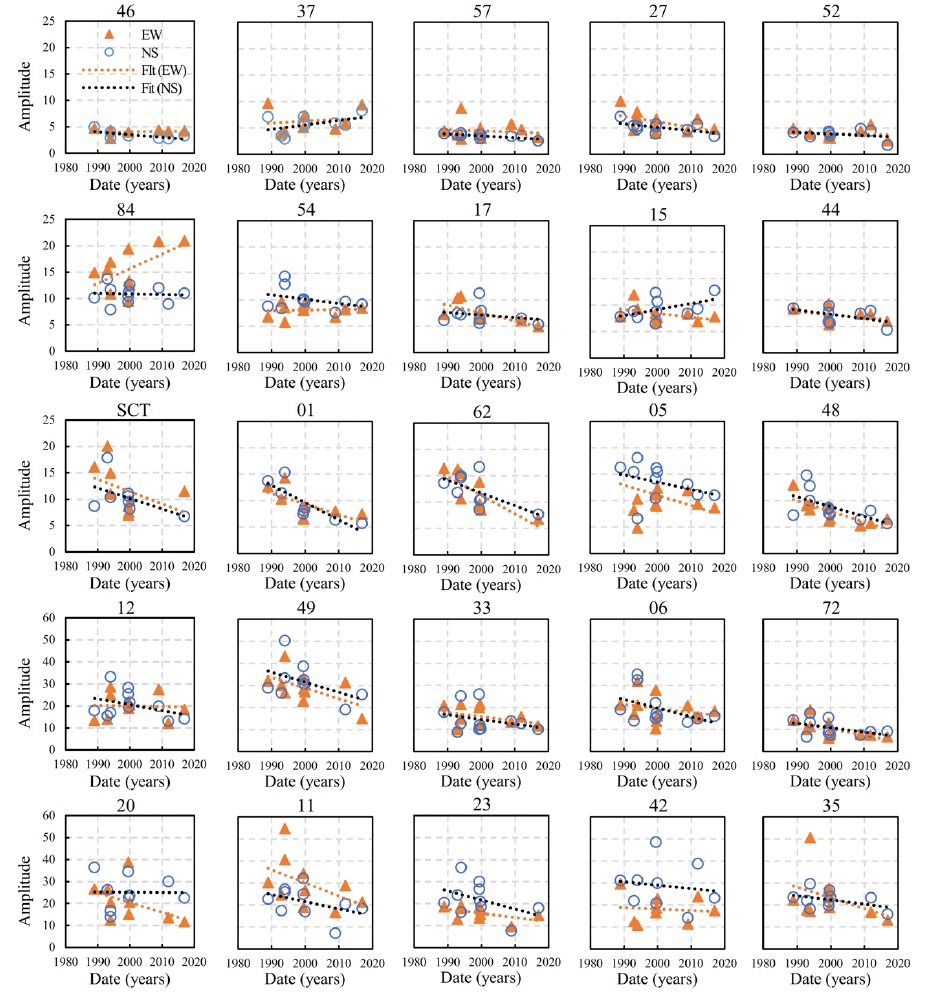
Figure 15 Fourier spectral maximum amplitude for several accelerometric stations and for both orthogonal directions
In most cases, the amplitude has decreased over time, however stations 37 (NS), 84 (EW), 15 (EW) and 12 (NS) show an increase in their amplitude. Similar to what was observed above about station 84, stations 37 and 15 are located very close to it (Figure 1), so similar conclusions of 3D effects could explain this amplification. However, station 54, also within the area, does not exhibit any amplification over time. Station 12 has been one of the most affected by the settlement of the city, and it is also located very close to a hill zone so that similar 3D effects could be present there.
Figure 16 shows the maximum amplification maps for the EW component of April 25, 1989 (top row), and the September 19, 2017 (bottom row) earthquakes. The amplification shown is for vibration periods of 1.5, 2.0, and 4.0s. Figures 16a and 16b show the peak amplifications maps for a period of 1.5s. When comparing these figures, similar amplifications (less than 10) are observed for the zone with soil periods between 0.5 and 1.8s, except for station 84 that shows the largest amplification for both earthquakes, with values up to 20 times for the 2017 earthquake. On the other hand, a decrease is observed close to "Basilica de Guadalupe" (north of the city), as well as in the deepest clay deposits (stations 20, 31, and 35). The amplification for periods of 2.0s (Figure 16c and Figure 16d) are larger for the 1989 earthquake, especially in sites located close to the Condesa and Roma colonies, where severe damage was observed during both September 19 earthquakes. Finally, for sites in zones with the deepest soil deposits of lakebed with periods around 4.0s (Figure 16e and Figure 16f), there is a decrease in the amplification, as can be seen in the "Xochimilco" area and around the Mexico City airport (31 and 35 stations). For other periods not shown in Figure 16, the trend indicates that there is a decrease in the peak amplification, except for station 84 for the EW component, where there is an increase close to 50% for the 2017 earthquake. As mentioned previously, this station has a particular behavior due to possible basin-edge effects that increase its response in only one direction.
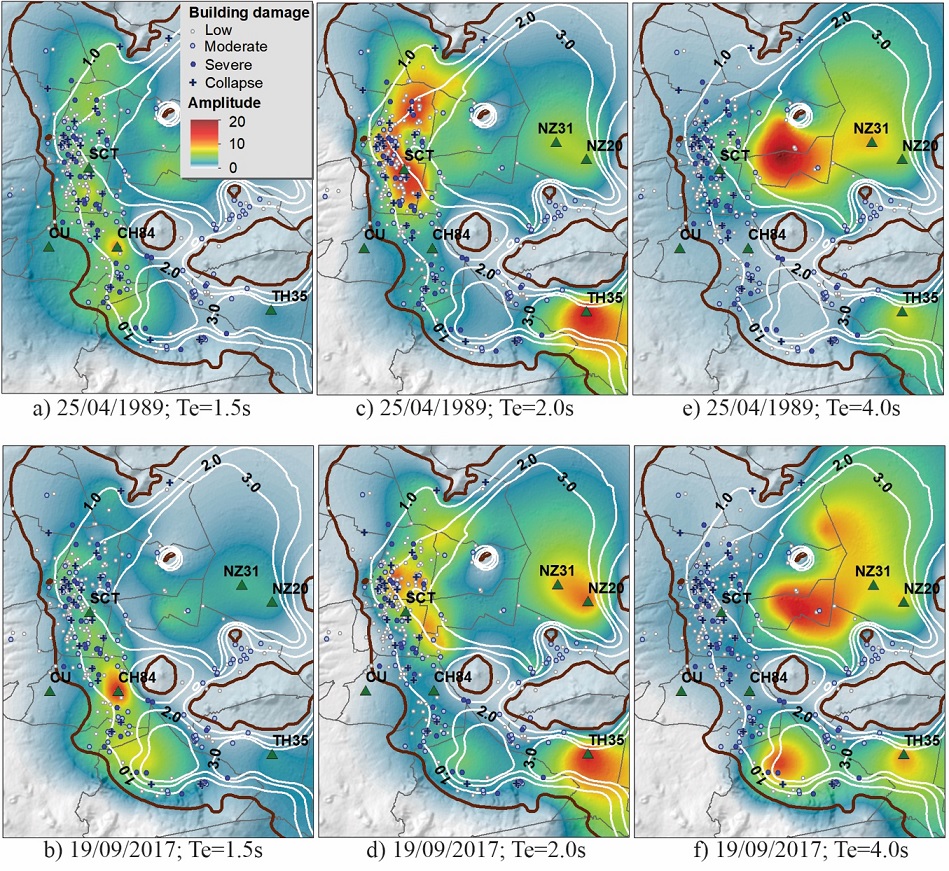
Figure 16 Maximum spectral amplification maps for the EW direction. a) 25/04/1989 and Te=1.5s, b) 19/09/2017 and Te=1.5s, c) 25/04/1989 and Te=2.0s, d) 19/09/2017 and Te=2.0s, e) 25/04/1989 and Te=4.0s, f) 19/09/2017 and Te=4.0s.
Figure 17 shows the amplification decrease, in percentage, between the 1989 and 2017 earthquakes for both orthogonal components and the amplitude corresponding to the dominant soil period of each accelerometric station. As can be seen in Figure 17, there is a considerable decrease in amplification in many stations, especially in the area with soil periods between 1 and 3s, coinciding, for most sites, with the soil dominant period changes shown in Figure 14.
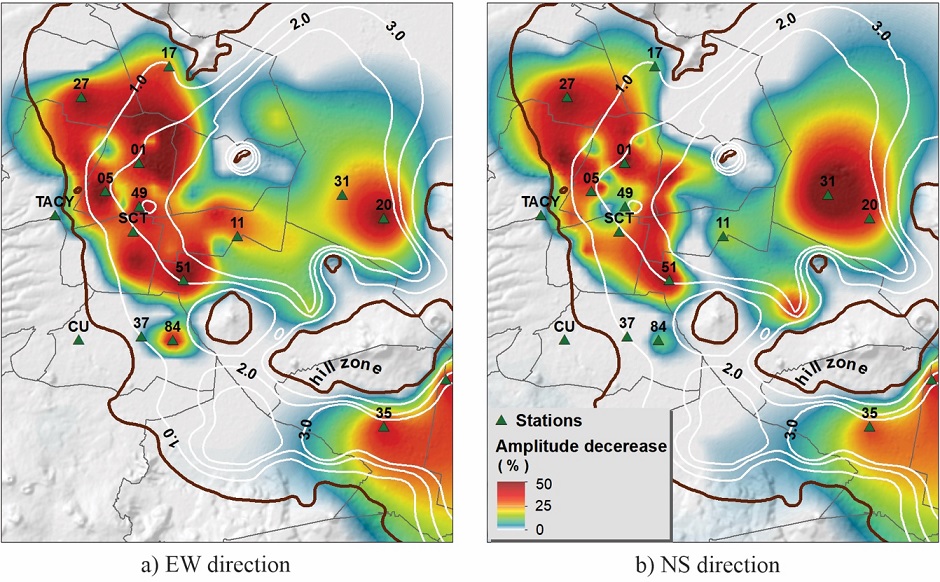
From the analyses presented above, it can be noticed, since 1989, a change in the behavior of the local soil effects in large part of the lakebed of Mexico City. As other authors have shown (Arroyo et al. 2013, Avilés and Pérez-Rocha 2010), this is associated with the groundwater pumping that has contributed to the consolidation of the aquitards underlying the Valley of Mexico causing exceptional ground subsidence levels.
Seismic demands of Mexico City structures due to September 19, 2017 earthquake
The seismic demands analyzed in this study (pseudoacceleration, hysteretic energy, and normalized hysteretic energy) were computed using the 77 accelerometric stations presented in Figure 1.
1 Pseudoacceleration demands
Figure 18 shows the pseudoacceleration demands in terms of response spectra (Sa) for selected accelerometric stations, each one plotted with the official design spectra of the Mexico City code (NTCD-2004). The design spectra are different for most stations since these spectra are computed from the dominant period at each site. Also shown are the buildings that collapsed during the earthquake (Figure 18, red dots). As can be seen in the spectra, the highest demands were computed where the dominant soil period is between 1.0s and 1.8s, coinciding roughly with the severely damaged area. Note that station 84 exhibits very large Sa demand, exceeding for one horizontal component the design spectrum by approximately 30%, while the SCT spectra remain below 50% of its corresponding design spectrum. Likewise, the spectra in other sites of the hill zone (30, 47, 74) also exceeded the design values. Station 35 is over the deepest soil deposits of lakebed zone, and the demands for the second and third vibration modes are large, reaching intensities that exceeded the design spectrum in periods lower than 1.0s. As has been stated, some of the spectra exceeded the design one but only by one horizontal component of motion. If the average horizontal spectra are computed, the resulting spectra never exceeded, in any station, the design one.
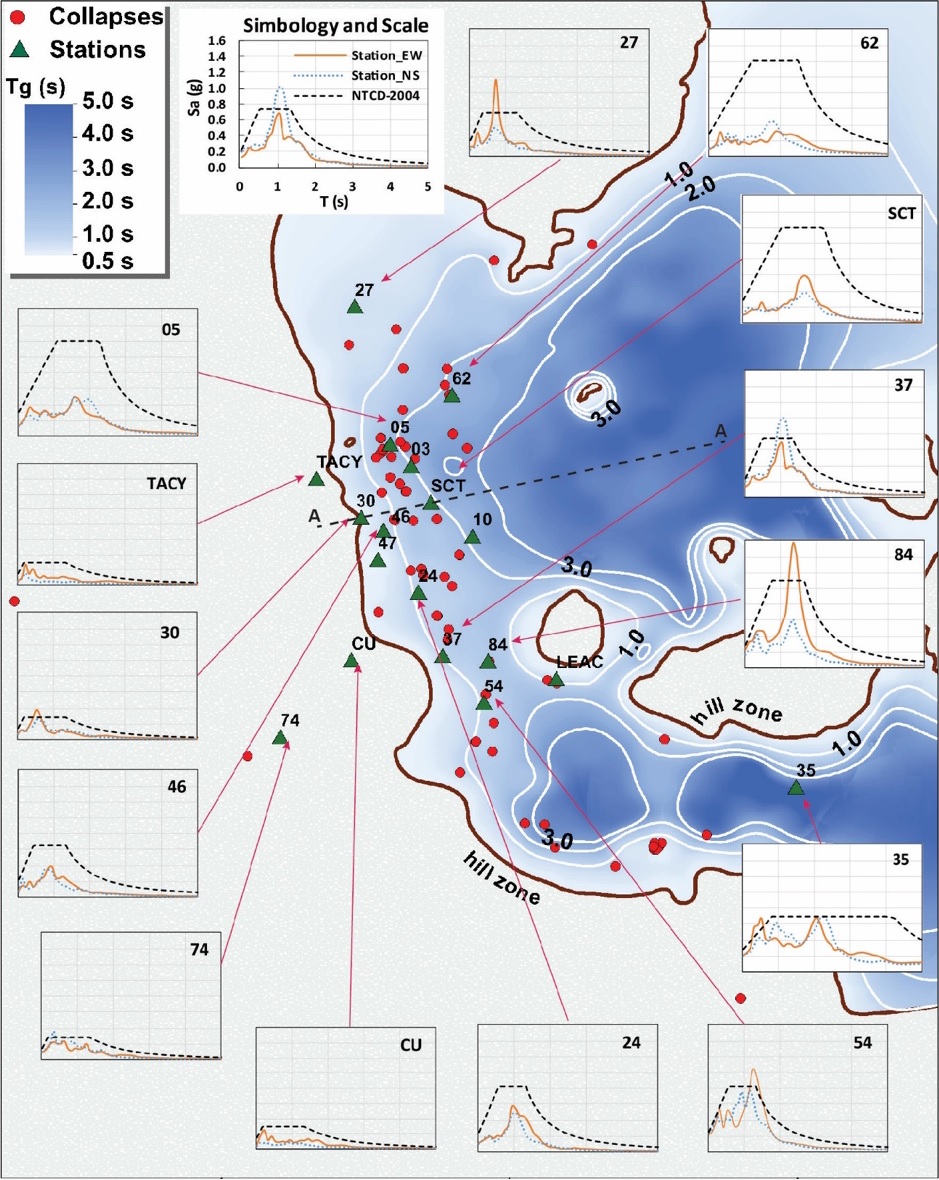
Figure 18 Pseudoacceleration spectra for the September 19, 2017 earthquake for both orthogonal directions and compared with the design spectra included in the seismic regulations in 2017 (NTCD-2004).
The maximum computed demands and reported damage during the September 19, 2017 earthquake, occurred in areas considerably different from those traditionally observed with inslab earthquakes, such as that of September 19, 1985. This because the intraslab earthquakes at R<250 km from Mexico City have shown to have more energy for shorter frequencies than those of the inslab events. In particular, the 1985 earthquake had peaks around 2s while de 2017 ones had them in 1-1.5s.
Figure 19 shows Sa maps for the September 19, 2017 earthquake for SDOF systems with periods of 1.0, 1.5, 2.0, and 3.0s, and for the geometric mean spectra of both orthogonal components, together with the accelerometric stations, damage buildings and some reference sites. There are intensity differences in areas with largest demands as well as in the spatial distribution of the damage. All the maps where computed using a bilinear interpolation without considering additional soil characteristics to interpolate the intensities.
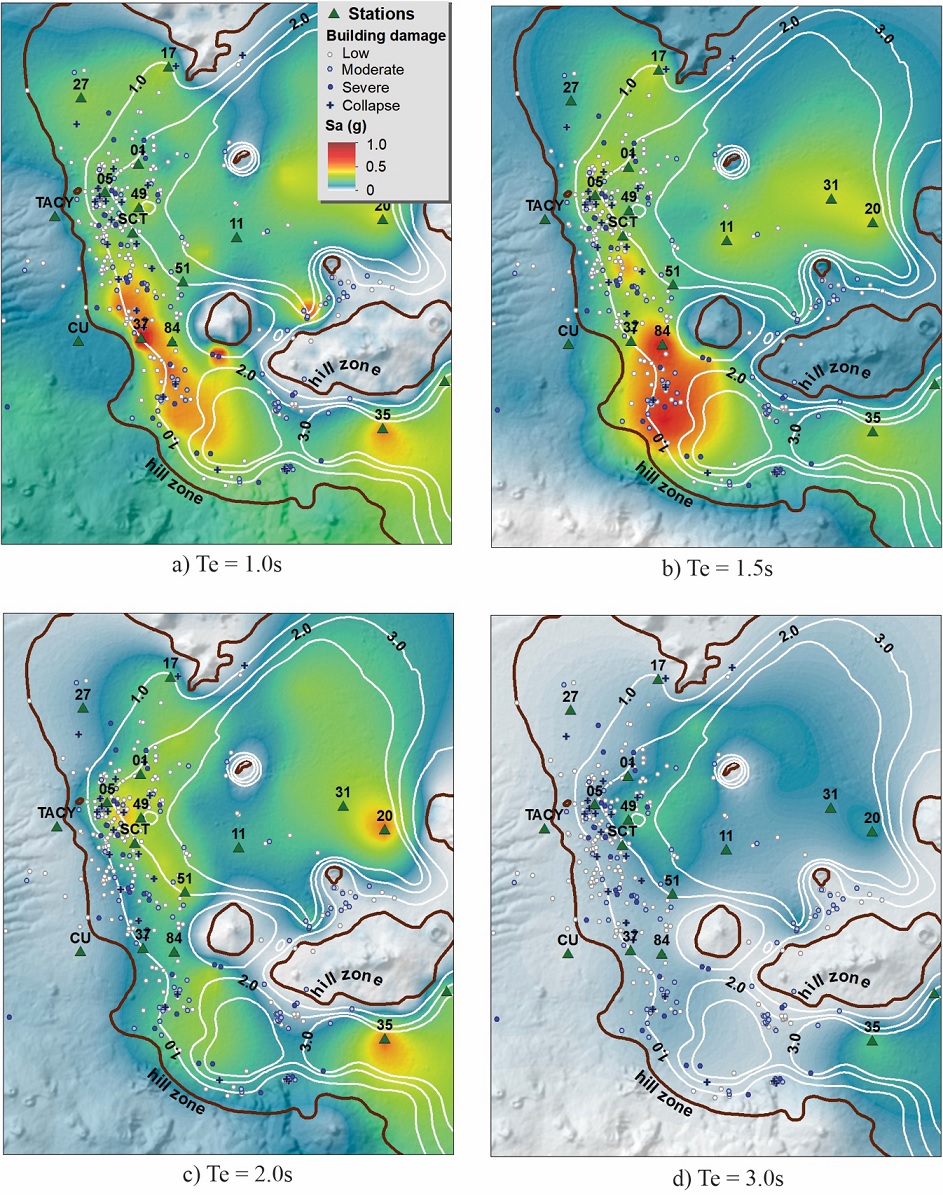
Figure 19 Pseudoacceleration maps for the September 19, 2017 earthquake for different periods. a) 1.0s, b) 1.5s, c) 2.0s, and d) 3.0s
From Figure 19, it can be observed that the lakebed zones with periods between 1 and 1.5 had the most significant intensities, coinciding roughly with the zones where damage to buildings was present (Figure 19a and Figure 19b). The map shown in Figure 19c, which corresponds to the maximum intensity for 2s, shows a better correlation to damage in the downtown area. Figure 19d exhibit that, despite large soil dominant periods in Mexico City, the intensity for periods larger than 2.5 s is not large, and slight damage is expected in those areas; however, second and third vibration modes, with periods around 1s, may present relatively high intensities. What these maps show is that there is a strong correlation between the dominant period, soil amplification and damage, but is not strong enough to explain all damage patterns and, also, no damage patterns. This apparent complexity arises from many aspects such as 1) most of the damaged structures were built before 1985. Therefore, the seismic regulations at that time did not represent the real seismic hazard of the area, 2) although there is a considerable density of accelerometric stations in that area, the soft-soil behavior in Mexico City varies significantly within dozens of meters due to the clay depth, so important intensity information was simply not captured by the array. A special interpolation scheme (Perez-Rocha 1998, Worden et al. 2018) should be used to obtain a reliable and definite intensity map.
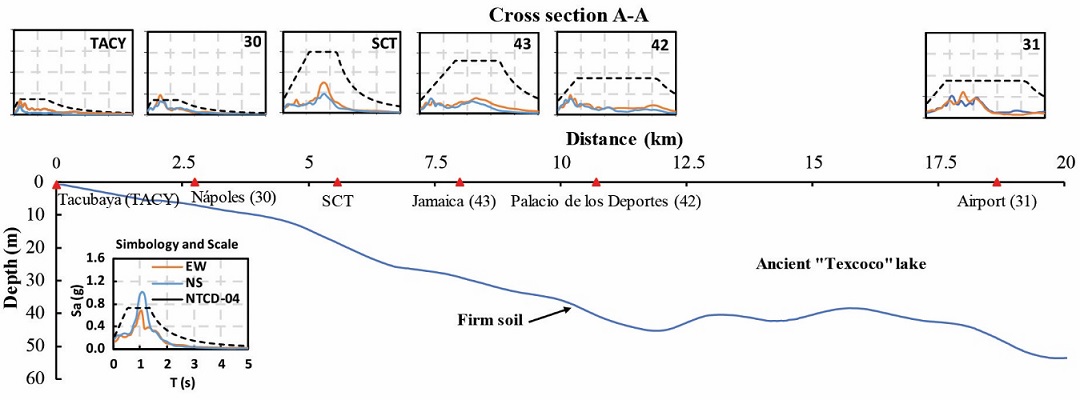
Figure 20 illustrates the variation of the pseudoacceleration spectra for this earthquake and the design spectra for the lakebed clay depth of the ancient "Texcoco" lake for the cross-section A-A shown in Figure 18. For most sites in the valley, the soil vibration period is directly correlated to the depth of the clay strata shown in Figure 20 and, consequently, to the intensities recorded at ground level.
2 Hysteretic energy demands
The damage suffered by the structures over the soft-soil in Mexico City depends not only on the acceleration demands and the frequency content but also on the very long duration of the strong ground motion. In the case of lakebed zone of Mexico City, where the structures are subjected to long-duration earthquakes, the disadvantage of using spectral acceleration as structural design parameter is that the potential damage due to cumulative damage effects is not considered (Fajfar, 1992; (Kunnath and Chai, 2004) Quinde et al. 2019). The explicit consideration of cumulative damage (low-cycle fatigue) during seismic design is usually based on energy concepts (Housner, 1956; Kuwamura and Akiyama, 1994).
Structural damage is associated with the plastic behavior of the system, which could be studied from the hysteretic energy dissipated by a structure during an earthquake (E Hμ ). This energy corresponds to the total area of hysteretic cycles that a structure develops during an intense earthquake, and for its calculation, the entire duration of the seismic record is considered. Figure 21 shows the hysteretic energy (E Hμ ) demands from the September 19, 2017 earthquake, for SDOF systems with elasto-perfectly-plastic behavior. The maps represent the E Hμ for periods of 1.5s as well as those associated with the peak energy of each site no matter at which period (maximum envelope demands).
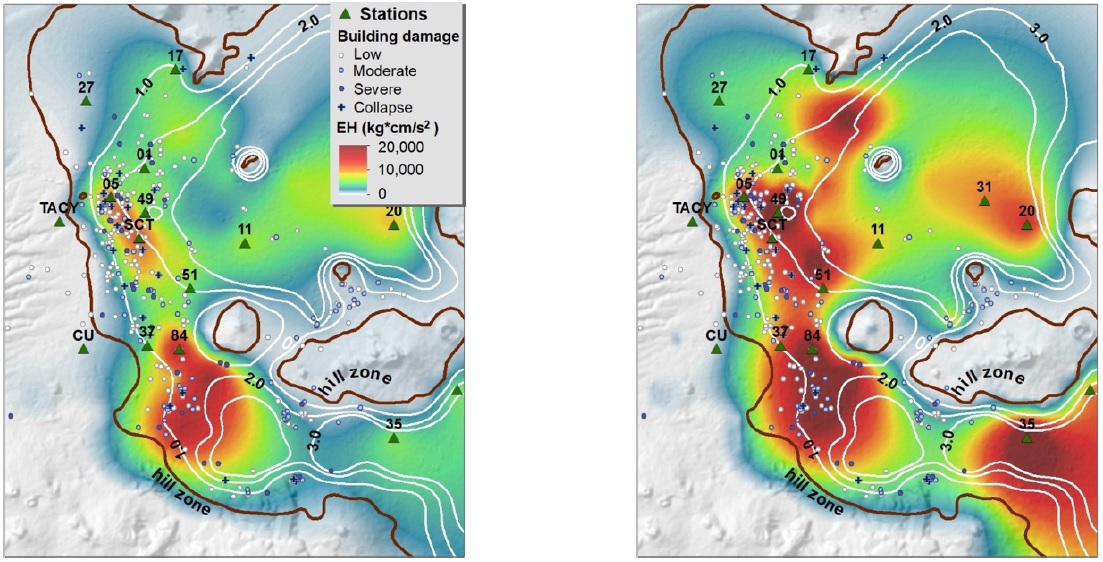
Figure 21 Hysteretic energy maps for the September 19, 2017 earthquake: E Hμ for a SDOF of 1.50s, left, and E Hμ for the maximum demands envelope, right.
As shown in Figure 21, the E Hμ demands are large for site with soil period close to 1.5s, with station 84 (Tg = 1.4s) being the one with the largest demands. In the map of the envelope of maximum demands, it is shown that the E Hμ is reasonably associated with damage area.
From the hysteretic energy, the accumulated plastic demands could be known. However, this energy does not contain enough information to associate it with structural damage, since the total dissipated energy could be similar for two different structural responses. Due to this, it is convenient to use the normalize hysteretic energy (Darwin and Nmai 1986); (Krawinkler, H. and Nassar 1992):
where F y and x y are the yielding strength and displacement, respectively.
This normalized hysteretic energy, NE Hμ is related to the number of times the accumulated elastic energy must be dissipated and, therefore, can be associated with structural damage. As shown in Figure 22, the largest NE Hμ (maximum) match with part of the area with reported damage. These NE Hμ demands were computed for an elasto-perfectly-plastic model using Mexican regulations to calculate the single-degree-of-freedom (SDOF) lateral strength. The maps correspond to a value of relatively large ductility of the structure (Q = 3.0 from the NTCD-2004). The damage reported in areas near downtown is associated with the structural performance of the buildings rather than the intensity of the seismic demands.
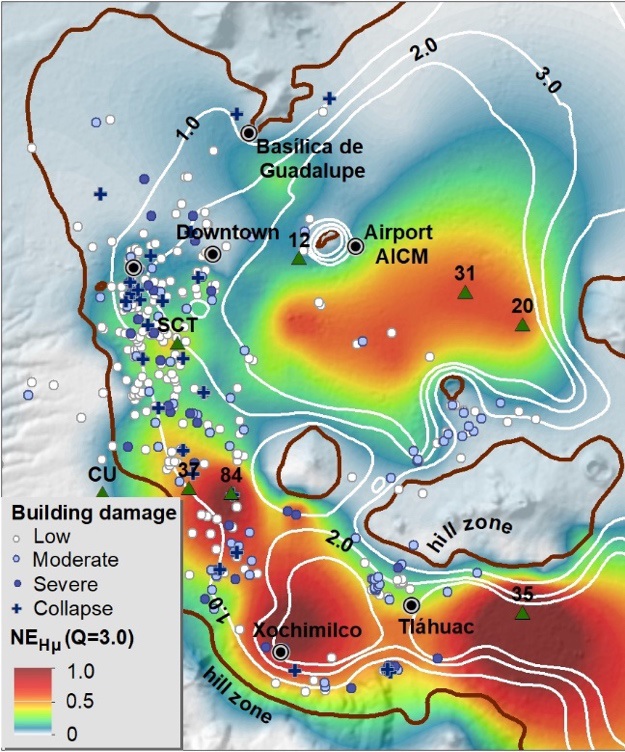
Figure 22 Normalized hysteretic energy maps for the September 19, 2017 earthquake, for the maximum demands envelope
The largest NE Hμ intensities are concentrated to the south of the lakebed area (Xochimilco, Tlahuac) and near the international airport. However, the downtown area, where severe damage was observed, shows relatively low demands (less than 10). This is because the maps have been computed with data from stations, but the interpolation did not accounted for soil characteristics at sites without recorded data, where larger amplifications (not recorded) could have been present.
Changes in the dominant soil period may have implications for the structural performance of buildings since the initial design conditions would be different by changing the soil-foundation behavior. This change of period has been considered in the update of the construction standards of Mexico City, with predictive models (Arroyo et al. 2013). However, continuous monitoring of this period change should be taken, since it is no related to a natural phenomenon.
On the other hand, in soft soil sites similar to those in Mexico City, where every 10 to 20 years are subjected to intense long-duration and narrow-banded earthquakes, it is not enough to analyze the intensities associated with peak values, such as pseudoacceleration and spectral displacement. In such sites, it is necessary to analyze the seismic demands that consider the accumulated damage and dissipated energy. As can be seen in Figures 21 and 22, damage to sites with soil periods similar to Tg=1.5s may be explained from the high plastic demands, although in areas near downtown and Roma-Condesa neighborhoods, the damage is related to structural characteristics, such as the year of construction, structural pathologies or even accumulated damage over time.
Conclusions
In this article, a study of the soil behavior of the lakebed of Mexico City was presented, based on the analysis of the Fourier amplification ratios computed from acceleration records of thirteen strong earthquakes that occurred in Mexico from 1985 to 2017. There is evidence of the change over time in Tg and peak amplification at several sites. These changes over time are mostly due to anthropogenic conditions, in particular, ground subsidence produced by groundwater pumping.
With the soil periods computed from the Fourier spectral ratios for the September 19, 2017 earthquake, the demands of pseudoacceleration and hysteretic seismic energy were obtained for the two orthogonal components and the 77 stations shown in Figure 1. The spectral accelerations (Sa) reached very high values, especially for station 84, with a maximum Sa close to 1.6g, the largest ever recorded in the city. This station also showed evidence of local wave effects that increased its response in only one direction. The Sa maps show a good correlation with the damage reported during the 2017 earthquake, especially in the zone with Tg<1.8s, wherein certain sites the demands exceeded the design spectra of the Mexico City regulations.
The hysteretic energy and the normalized hysteretic energy showed a relationship with the damage reported for sites with Tg<1.5s. However, in the downtown area, where severe damage was concentrated, no correlation between intensities and damage was observed. As mentioned in this study, this is because the maps have been computed with data from stations, but no accelerometric stations are located in the western part of the city over soils with Tg=1.5s, so no large intensities were recorded but undoubtedly present. On the other hand, for sites over deeper clay deposits, high hysteretic energy demands were observed. However, no damage has occurred, mainly because in this area, there are no structures that can vibrate with periods similar to those of the soil (Tg> 3.5s). For sites of the deepest lakebed zone, it was observed that the second and third modes of soil vibration were excited considerably, reaching demands like those reported for sites with Tg<1.5s.

