


 nueva página del texto (beta)
 Inglés (pdf)
 Artículo en XML
 Referencias del artículo
 Enviar artículo por email
 Citado por SciELO
  Similares en
SciELO
Similares en
SciELO 
 Permalink
Introduction
The first precise gravity measurements in Mexico were carried out in the early 1970s (Bureau Gravimétrique International, BGI). Then, the g-values were derived from relative gravity surveys with ties to absolute determined points promoted by the Inter-American Geodetic Survey (IAGS). The accuracy of most of the 260 reference gravity stations (see Figure 1) is in the order of 0.1 mGal, however, the precise location of the measured gravity stations is not well known. In 1996 a first order absolute gravimetric survey in western Mexico was carried out aimed at geodynamic investigations, leaded by the American National Oceanic and Atmospheric Administration (NOAA) with participation of the Instituto de Geofísica-UNAM. Their field campaign totaled the setting of 9 stations established by Daniel Winester of NOAA, using the NSF-funded absolute gravimeter FG5-111, and owned by the University of Colorado at Boulder (Roger Bilham, pers. com.). Their measurement included four stations located within the Jalisco Block, namely Chamela (CHA), Guadalajara (UGG), Manzanillo (MAN) and Puerto Vallarta (UGP) stations, other station at the basement of the Instituto de Geofísica-UNAM in Mexico City (IGU), and 4 more stations in the cities of Acapulco, Chilpancingo, Pinotepa and Taxco. However, the later four were not visited because the reference marks were destroyed.
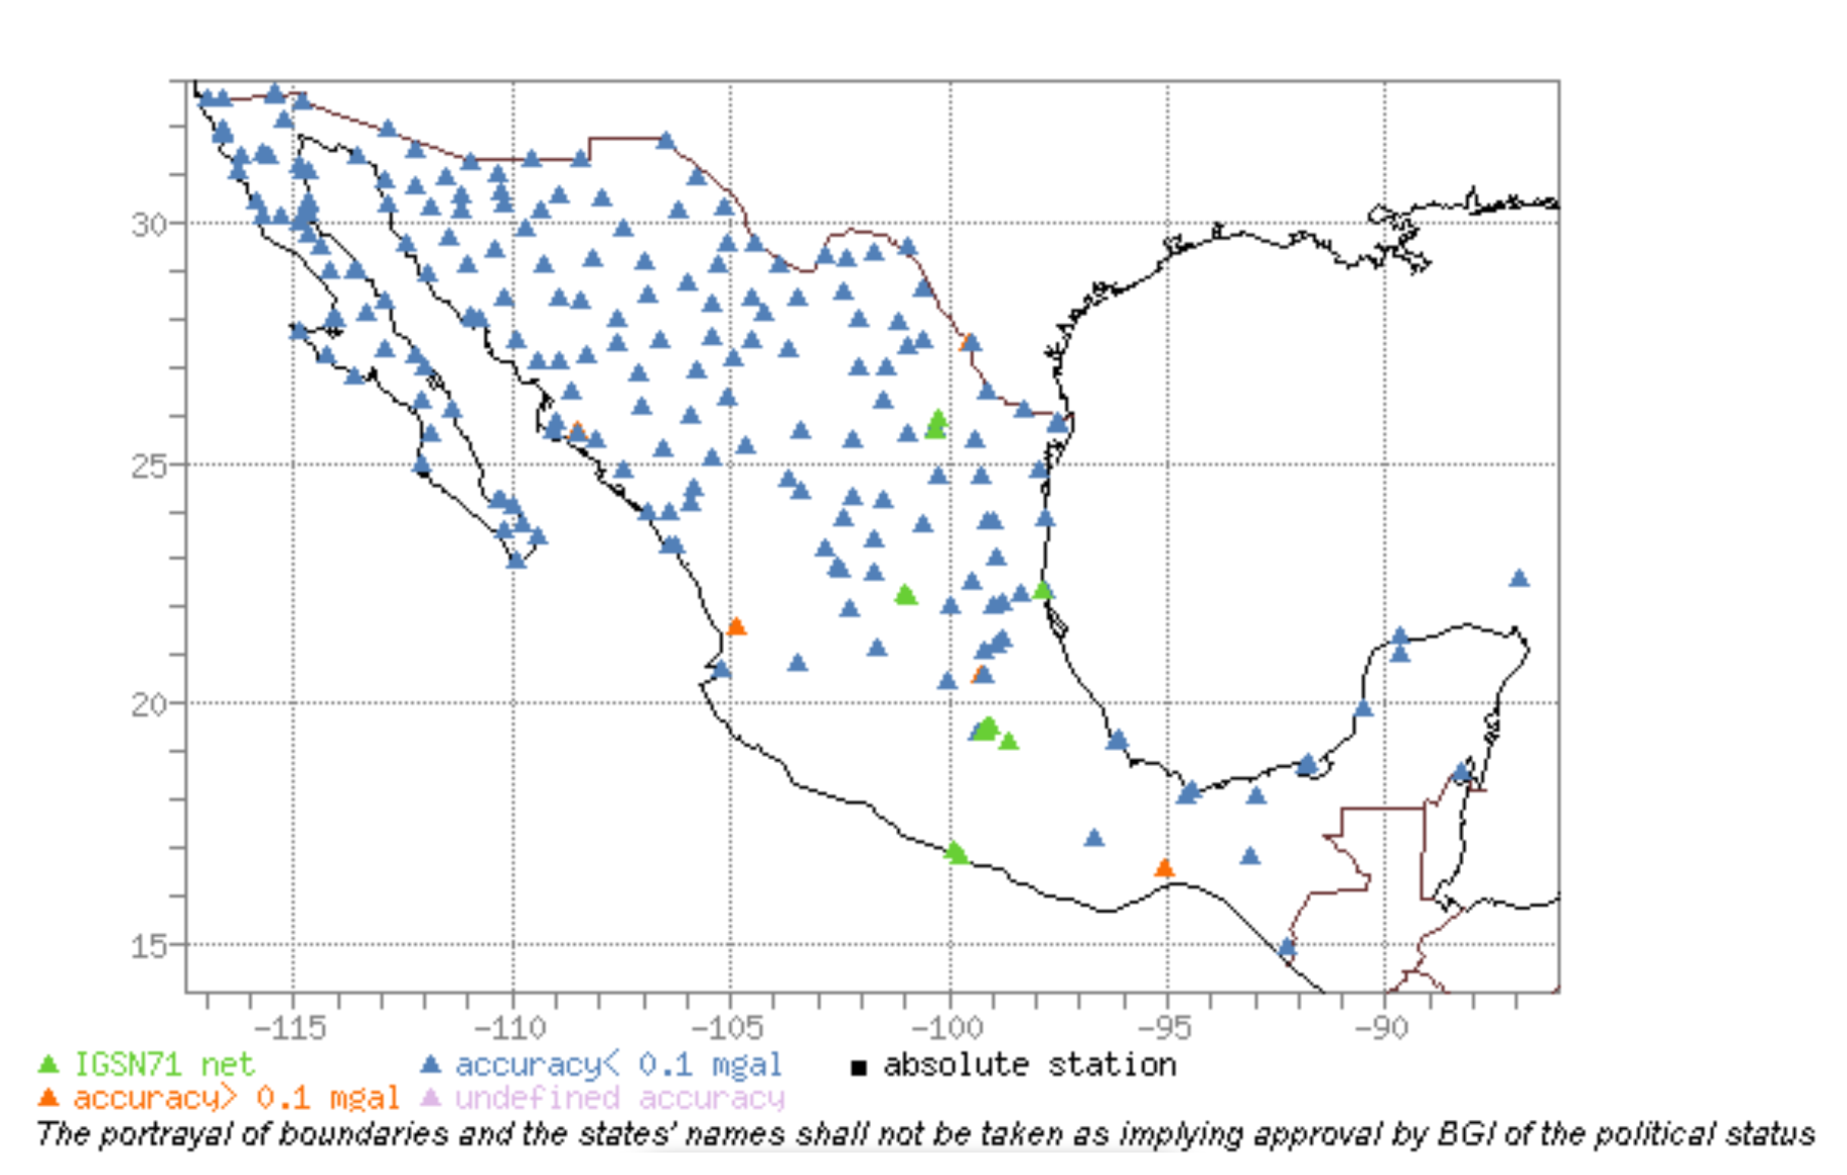
Figure 1 Relative gravity stations measured in the 60’s and early 70´s in Mexico as archived by the Bureau Gravimetrique Internationale or BGI (http://bgi.omp.obs-mip.fr/data-products/Gravity-Databases/Reference-Gravity-Stations.
As part of this work, the Jalisco Block stations (UGP, CHA, MAN, UGG, shown in Figure 2) and the reference UNAM-CU station (IGU), were measured at the same benchmark points established during the NOAA´s winter field campaign of 1996 in Mexico. Our measurements were also done during the winter of 2016 and repeated two years later in 2018 during the same time of the year (Feb-Mar). This was intentionally planned to prevent unwanted variations of g due to water table rise. In addition, we measured a new station in Tepic (TEP), north of the JB, and updated the INEGI main reference site (AGS) in Aguascalientes city. The remaining two stations (CGE and CNM) where established in August 2015 with the FG5X-220 absolute gravity meter and were measured again in February 2016 with the FG5X-220 and in March 2018 with the FG5X-252. The CGE station is located at Centro de Geociencias (CGEO-UNAM), and station CNM at the Gravity Laboratory of Centro Nacional de Metrología (CENAM), both in Querétaro. The 2016 AG campaign was conducted by a combined team from the University of Leibniz, Hannover (LUH), CENAM, and UNAM, and the 2018 measuring campaign by a combined team of CENAM, UNAM and NRC of Canada.

Figure 2 Absolute gravity (AG) stations measured during the first (2016) and second (2018) campaigns (red and yellow circles). Four of the five stations in the Jalisco Block (red circles) were established in 1996 (NOAA) and were used as reference for comparison. UNAM first order gravity station in Mexico City was also established in 1996. We setup the control Tepic (TEP) station, north of the JB, and updated the INEGI main reference site (AGS) in Aguascalientes city. The remaining two stations (CGE and CNM) where established in August 2015 and were measured again in February 2016 and in March 2018. The CGE station is located at Centro de Geociencias (CGEO-UNAM), and station CNM at the Gravity Laboratory of Centro Nacional de Metrología (CENAM), both in Querétaro. Green arrows indicate convergence direction of RP, and shaded grey zones represent the extension of the trans Mexican volcanic belt (TMVB). Lighter grey area delineates younger vulcanism. The Middle America Trench (MAT) is shown with brown line. The Rivera and Tamayo transform fault zones (RFZ and TFZ respectively) are highlighted with a NW-SE.
Comparisons and certification of the FG5X-252
To start using a new absolute gravimeter with certainty is always necessary to know about the stability and repeatability of the g measurements that yields. The international comparison of CENAM´s FG5X-252 absolute gravity meter acquired in December 2015, was done in two steps. First, in February 2016, a comparison with the LUH´s international reference FG5X-220 gravity meter (Jiang et al., 2012; Francis et al., 2015; Timmen et al., 2015; Schilling and Timmen, 2016), which produced a difference of 7.98 ± 2.5 µGal after corrections (Figure 3a). The FG5X-220 is a well-defined instrument that has participated in multiple international comparisons, including the last CCM.G.K2 key comparison (Francis et al., 2015) at the Underground Laboratory for Geodynamics in Walferdange, Luxembourg (2013). During the latest Regional key comparison of Absolute Gravimeters, EURAMET.M.G-K2 and Pilot Study at the University of Luxembourg in Belval in November 2015, an expanded uncertainty of 5 µGal was derived for the Hannover FG5X-220 instrument, and its long term stability and repeatability is below 2 µGal (Schilling and Timmen, 2016). A second comparison of the absolute gravity meter was done in October of 2017 at the international comparison in Table Mountain in Boulder, CO (https://www.bipm.org/utils/common/pdf/final_reports/M/G-K1/SIM.M.G -K1.pdf), where a group of 13 instruments from 10 different countries participated. Figure 3b show the results of that comparison, where it is observed that the FG5X-252 was among the more stable. The first instrumental comparison was done before the 2016 field campaign, while the international certification at Table Mountain was made before the 2018 field campaign.

Figure 3 a) Comparison between FG5X-220 and FG5X-252 at the micro-Gravimetry Laboratory of CENAM in February 2016; b) results of the international comparison of 12 absolute gravity (AG) meters at Table Rock (NOAA, Boulder, CO) in Oct., 2017; c) aspects of FG5X-252 AG meter comparison at CENAM (left) and at Table Rock laboratory (right). The transportation of an AG gravimeter type FG5X (Micro-g®) involves the packing and the carrying of eight boxes worth ~250 kg (center).
Applied corrections
To deduce the g-value from the 3,000 time/distance raw data pairs (http://www.microglacoste.com/), the applied equation of motion is given by:
where x0, v0 and g0 stand for the initial position, the initial velocity and the gravity value at t=0 respectively. Here γ is the vertical gravity gradient (δg/δh) at the measuring site, (ti, xi) are the i-th time and interference derived position of the free-fall test body during a drop, and τi is the corrected time for the finite speed of light, given by (Nagorny, et. al 2010, Rothleitner, et. al 2014)
The individual g-values are corrected for three global geophysical effects: the gravitational Earth tides, the varying gravity attraction and loading effect due to mass redistributions in the atmosphere during measurements, and the change in the centrifugal acceleration due to polar motion. Here, the tidal variations have been predicted using Timmen and Wenzel (1995) algorithm, which computes the gravity tide parameters from gravity tide amplitudes of the Tamura´s (1987) tidal potential. The obtained parameters include the corrections due to the solid Earth tides and the loading and attraction effect from the ocean tides. To carry out the reductions due to atmospheric variations we used the equation (IAG, 1983).
that expresses the barometric pressure Cp (in µGal) in terms of the observed atmospheric pressure P0 (in hPa), and the nominal pressure Pn at the site. In this equation A is the barometric admittance factor (-0.3 µGal/mBar). The nominal pressure Pn at a site located at an elevation hm is estimated by the empiric equation (US Standard Atmosphere, 1976. (https://ntrs.nasa.gov/archive/nasa/casi.ntrs.nasa.gov/19770009539.pdf):
The variation in gravity due to polar motion (𝛿 gpm in µGal) during the measuring periods can be accounted for applying the equation (Torge and Müller; 2012)
here ω is the Earth´s angular rotational velocity (rad/s), a is the equatorial radius (semi-major axis) of the reference ellipsoid (m), φ is the latitude of the site, λ the longitude, and x, y the pole coordinates (rad) as provided by the International Earth Rotation and Reference Systems Service (IERS) (http://www.iers.org/IERS/EN/EarthOrientationData). Polar motion and air pressure corrections were calculated using the g-software from Micro-g Lacoste® (http://www.microglacoste.com/fg5x.php). In order to compare our results with those measured during the 1996 acquisition campaign with the FG5-111 gravity meter, all measured g values were transferred to the floor mark using a nominal sensor height of 1.30 m. The local gravity gradients used here were the same measured by the NOAA team in 1996; at those stations where the gradient was not available, we used the reference value of -3 µGal/cm (TEP, AGS, CNM, CGE).
Field measurements
During the field campaign of March 2016, the gravity meter FG5X-252 stayed at the CENAM Gravity Laboratory while the FG5X-220 LUH instrument was used for the measurements elsewhere. A complete FG5X instrument weights about 320 kg and is transported in 6 large boxes (Figure 3c) adding up to a packing volume of 1.5 m3 approximately. The space floor requirements for installation are about 3 m2 and a stable electric power supply of 110-240 VAC at 50-60 Hz. Nominal power requirements are 500 W sustained for at least 18 hours. The setup of the instrument takes about 1 to 2 hours for full operation it requires time to stabilize to room temperature (15-25°C). Although the FG5Xs have a worldwide dynamic range, they have a limited operating temperature range, which is necessary to keep as stable as possible during a measurement. During the second field campaign the temperature conditions in the coastal region climbed above 35°C during the day but settled during the night above the low twenties, particularly when measuring in Chamela (CHA) and CUNIVO (MAN). We observed that a temperature variation of 5-10 °C degree overnight can lead to total failure of the automatically running observations, or to a loss in accuracy of more than 2 µGal/deg. Once settled and stabilized, the gravimeter is programed to acquire data series over night until next late morning assuring at least one semi-diurnal tidal period for an adequate correction of data. A full station measurement typically consists of up to 3,000 single free-fall drops events which are corrected for Earth’s tides, atmospheric mass redistributions and polar motion. To transfer the g-result from the FG5X sensor height to the floor level, the vertical gravity gradient =δg/δh was taken as 3.000 µGal/cm at those stations where t he gradient was not available. Table 1 shows the summary of results from this and the previous acquisition campaigns.
Table 1 Location, coordinates, and corrected absolute gravity g values corresponding to the NOAA´s 1996 campaign, and results of the first (2016) and second (2018) field campaigns as part of this work.
| SNT | LOCATION | Lat | Long | Z (masl) | Dg/dz (µGal/mm) | 1996 (µGal) | 2016 (µGal) | 2018 (µGal) | Uncertanty (µGal) |
| CHA | Instituto de Biología UNAM, Chamela, Jal. | 19°29 ҆ 55.8” | 105°02 ҆ 41.8” | 100 | -3.709 | 978593393 | 978593377.4 | 978593371.3 | 1.9 |
| MAN | CUNIVO, Universidad de Colima (Manzanillo) | 19°07 ҆ 27.4” | 104°24 ҆ 04.4” | 18 | -3.023 | 978594708 | 978594731.8 | 978594713.8 | 1.9 |
| UGG | Instituto de Astronomía, U. de G., Guadalajara | 20°40 ҆ 29.7” | 103° 23 ҆ 03.4” | 1583 | -2.80 | 978197026 | 978196995.6 | 978196979.8 | 3.8 |
| UGP | Universidad. de Guadalajara, Campus Puerto Vallarta | 20° 42 ҆ 21.1” | 105° 13 ҆ 14.9” | 13 | -3.017 | 978589289 | 978589310.1 | 978589315.7 | 2.0 |
| TEP | CICESE-UT3, Tepic, Nayarit | 21°28 ҆ 54.4” | 104° 50 ҆ 58.0” | 948 | -3.00 | N/M | 978460630.9 | 978460630.4 | 1.9 |
| AGS | INEGI-Aguascalientes | 21° 51 ҆ 26.6” | 102° 17 ҆ 04.05” | 1888 | -3.00 | NA | 978174962.0 | N/M | 1.9 |
| IGU | Instituto de Geofísica, UNAM, Cd. De México | 19° 19 ҆ 36.85” | 99°10 ҆ 34.02” | 2280 | -2.479 | 977927005 | 977926980.0 | N/M | 2.0 |
| CNM | CENAM, Querétaro | 20° 32 ҆ 17.9” | 100° 15 ҆ 35.84” | 1922 | -3.00 | N/M | 978081416.0 | 978081416.8 | 1.2 |
| CGE | CGEO-UNAM, Juriquilla, | 20° 42 ҆ 7.2” | 100° 26 ҆ 50.50” | 1929 | -3.00 | N/M | 978098243.0 | 978098242.9 | 1.8 |
The Jalisco Block (Jb) relevance
The Jalisco Block (JB) is named after the western Mexico continental block (Figure 4a) about 40,000 km2 of surface limited by three extensional zones in land, namely the Tepic-Zacoalco rift (TZG), the Colima graben (CG), and the Banderas graben (BG); seawards the JB is limited by the northernmost segment of the Meso-American trench. The JB is a continental micro-plate that moves independently respect to the Rivera plate (RP), North American plate (NAP), and the Michoacan Block (MB) (Luhr et al., 1985; Allan, 1985; Johnson & Harrison, 1990; Bandy y Pardo, 1994; Selvans et al., 2010). The subduction rate of the RP under the JB is between 2.0 and 2.3 cm/yr (Nixon, 1982; Ferrari et al., 2012), however, at the boundary of the Rivera and Cocos plates (CP) the rate of subduction increases to 5.8 cm/yr (Johnson and Harrison, 1990) or 3.8 cm/yr according to other estimations (Ferrari et al., 2012). In any case, this difference in subduction speed must be accommodated through the Rivera transform fault (RFZ) and is highly probable that the Colima rift reflects in surface the divergence in speed and subduction angle of RP and CP at depth. Indeed, the RFZ could be extended in land to be correlated with the southern Colima graben (Alvarez and Yutsis, 2015A).

Figure 4 a) Location of AG stations (yellow circles) in the context of the Jalisco Block (JB) tectonic setting (compiled after Blatter and Hammersley, 2010, Rosas-Elguera et al., 1996; Garduño et al., 1998). Blue arrows are horizontal displacements (EARTHSCOPE-PBO, Plate Vel.), red squares are main cities. Latest Miocene to Quaternary faults shown with black lines. Closed red contours mark approximate extension of volcanic complexes surrounding the JB. CG, TZG and BG are Colima, Tepic-Zacoalco, and Banderas grabens. Gray arrows indicate convergence direction of tectonic plates (NAP=North America Plate, RP= Rivera Plate). b) and c) show the Jalisco Block batholith as imaged by the vertical gravity gradient (VGG) of the residual of Free Air anomaly (Basset and Watts, 2015). The dashed yellow contour highlights higher VGG´s surrounding an apparently fragmented denser crustal block. Green arrows represent the magnitude and direction of cumulated vertical displacements respect to 1996 first AG measurements.
AG Data comparison
The differences in gravity for the periods 1996 to 2016, 1996 to 2018, and 2016 to 2018 are shown in Table 2 the yearly averages corresponding to these periods. The AG differences of the 2016 (left) and 2018 (right) results with respect to the 1996 measurements are shown schematically in Figure 4b. Green arrows at JB gravity stations (yellow circles) indicate the direction of displacement according to the sign of g. The figure shows that Puerto Vallarta (UGP) and Manzanillo (MAN) stations have similar positive differences of g (+21 and +23 µGals respectively). In contrast, at Chamela (CHA) and Guadalajara (UGG) stations a net negative difference of g is obtained, -15 and -29 µGal respectively. The background map in the Figure 4b is the vertical gravity gradient of the residual (VGG) of the FA anomaly from Basset and Watts (2015). The JB batholith is outlined with a dotted yellow line in the figure based upon the higher gravity anomalies. With only the 2016 set of g values (left) it is tempting to conclude that the reason why UGP and MAN stations are subsiding at about the same rate is because both are located within extensional zones (Bahia de Banderas and Colima rifts). However, the 2018 set of AG revealed that although the argument may hold for UGP station, which continued the subsiding rate, for CHA station it seems something more complicated as it changed from a subsiding regime to an uplifting regime in only two years. In contrast, stations CHA and UGG indicate uplift, which for the last two years increased two to three times above the yearly average (see Table 2).
Table 2 Average differences in AG and yearly rate averages for the 20 years period (2016-1996), the 22 years period (2018-1996), and the later AG measurements (2018-2016).
| SNT | Z (masl) | Δg 2016-1996 µGal | Avg Δg µGal/yr | Δg 2018-1996 µGal | Avg Δg µGal/yr | Δg 2018-2016 µGal | Avg Δg µGal/yr |
| CHA | 100 | -15.61 | -0.78 | -21.72 | -0.99 | -6.11 | -3.06 |
| MAN | 18 | 23.83 | 1.19 | 5.77 | 0.26 | -18.06 | -9.03 |
| UGG | 1583 | -30.37 | -1.52 | -46.19 | -2.10 | -15.82 | -7.91 |
| UGP | 13 | 21.08 | 1.05 | 26.70 | 1.21 | 5.62 | 2.81 |
| IGU | 2280 | -25.00 | -1.25 | ||||
| TEP | 948 | -0.50 | -0.25 | ||||
| CNM | 1929 | 0.76 | 0.38 | ||||
| CGE | 1922 | -0.09 | -0.05 |
Discussion of results
Although the data base is still limited by the number of stations on the JB and the time series measurements of g, some general observations and conclusions can be drawn. The results obtained from the second campaign in 2018 proved that larger variations can occur within short periods of time. The observed differences between the 2016 and 2018 AG values were larger than expected. In the two years period the four gravity stations around the JB underwent important changes in the gravity field. The lowest change (+5.62 µGal) occurred at the station UGP, in Bahia de Banderas, where the positive sign implies sinking of the area in this short period. The highest change (-18.06 µGal) occurred at MAN station, within the Manzanillo Bay, equivalent to an uplift of 54.18 cm (Table 3) for the two years period assuming that the observed differences in gravity are all due to change in geoidal height. At Guadalajara city UGG station, the trend of g remained and confirmed uplift at this station with the second larger change observed (-15.82 µGal), which under the same assumption is equivalent to an uplift of 47.46 cm in two years. The remaining JB station (CHA) underwent the third larger uplift (-6.11 µGal) and remained consistent with a positive vertical displacement at a rate of 18.33 cm in the two years’ period.
Table 3 Average differences in AG and equivalent vertical displacement estimated using available gravity gradients at the gravity stations and assuming observed gravity differences are due solely to a change in height.
| SNT | Z (masl) | Dg/dZ µGal/cm | Avg Δg 2016-1996 µGal/yr | Avg dZ cm/yr | Avg Δg 2018-1996 µGal/yr | Avg dZ cm/yr | Avg Δg 2018-2016 µGal/yr | Avg dZ cm/yr |
| CHA | 100 | -3.709 | -0.78 | 2.89 | -0.99 | 3.67 | -3.06 | 11.34 |
| MAN | 18 | -3.023 | 1.19 | -3.59 | 0.26 | -0.78 | -9.03 | 27.29 |
| UGG | 1583 | -2.80 | -1.52 | 4.25 | -2.10 | 5.88 | -7.91 | 22.14 |
| UGP | 13 | -3.017 | 1.05 | -3.16 | 1.21 | -3.65 | 2.81 | -8.47 |
| TEP | 948 | -3.000 | -0.50 | -025 | ||||
| IGU | 2280 | -2.479 | -1.25 | 3.09 |
In the middle of September 2017, two large earthquakes occurred in Mexico (Figure 5a) that were registered at some of UNAVCO´s GPS stations (inset) at the location of the AG sites MAN, UGG and CHA in the JB. The recorded time series previous and after the two large earthquakes unveiled pre- and post-seismic vertical displacements even though the rupture occurred more than 500 km east of the JB. The earthquakes of magnitudes 8.2 and 7.1 with epicenters in Chiapas (07/Sep/2017) and Puebla (19/Sep/2017) had lower crustal focal depths of 58 and 57 km respectively. Pre and post seismic activity after a large earthquake have been recorded within the JB previously by Hutton et al. (2001). The authors demonstrated using a local network of GPS stations that post seismic surface displacements can last for months, even years, and could be explained as consequence of aseismic slip subduction. The comparison of the AG data, measured before and after the two large September 2017 earthquakes, provided further evidence of important short-term variations in geoidal height in the JB (see Table 3).

Figure. 5 a) Map of western Mexico showing the configuration of ocean floor along the northernmost sector of the trench. The epicenters of the two large earthquakes of September 2017 are shown with red stars, green arrows indicate convergence direction, and shaded grey zones represent the extension of the trans Mexican volcanic belt (TMVB). Lighter grey area delineates younger vulcanism. Yellow circles mark the location of the measured AG stations. b) Total magnetic anomaly map (Bankey et al., 2002) of the JB and offshore magnetic records of the sea floor spreading (dotted lines). The Rivera and Tamayo transform fault zones (RFZ and TFZ respectively) are highlighted with a NW-SE continuous lines drawn along transverse low magnetic anomalies, coincident with the bathymetric traces of the transform fault under the ocean layer. The red arrow indicates the segment of the RP that experienced aseismic slip below the JB. c) magnetotelluric (MT) profile parallel to the coast at the mouth of southern Colima graben. JB is Jalisco block, MB Michoacan block, RP and CP are Rivera and Cocos plates. EGG is the Gordo graben, RFZ the Rivera transverse fault, which is apparently related to a central resistivity deep seated body.
The unexpected rapid uplift at stations MAN (54.6 cm), CHA (22.7 cm), and UGG (44.3 cm), as well as the continued subsidence regime at station UGP (-17 cm), and the relative stability at station TEP (- 0.5 cm) suggest us that the earthquake with epicenter in Puebla (M7.1) triggered the aseismic slip subduction of only a portion of the Rivera Plate. A seismic waveguide (Burg et al., 1951) traveling eastwards from the earthquake source along the southern edge of the TMVB can account for the slow-slip activation of subduction in the JB region. Figure 5b shows the magnetic anomaly (Bankey et al., 2002) of the JB and offshore magnetic records (dotted NS lines) of the sea floor spreading. The Rivera transform fault zone (RFZ) is highlighted with a NW-SE continuous line drawn along the transverse low magnetic anomaly that coincides with the bathymetric trace of the transform fault under the ocean layer.
According to these results, it appears that only a segment of the RP underwent aseismic slip under the JB (red arrow), otherwise gravity stations UGP and TEP should have also register important uplift as on stations CHA, UGG, and MAN. Aseismic slip is facilitated by a wet oceanic crust and likely a sizable amount of saturated subducted sediments. The relatively low resistivities (<250 Ohm-m) of the RP under the otherwise resistive continental crust (> 1,000 Ohm-m) is imaged along a magnetotelluric (MT) section in Figure 5c (Alvarez et al., 2010). The electric structure along the profile (see location in a and b) suggest an irregular resistive crust of variable thickness at the NW sector of the profile (left of the image) associated to the JB micro plate. In the opposite side of the MT image it appears what may be the SW edge of the resistive Michoacan block (MB), separated from the JB by a relatively high conductivity region (~200 Ohm-m) with a central high resistivity (>2,000 Ohm-m) peak embedded. The extrapolation of the RFZ to the MT profile suggest that the central anomalous resistive body is related to the buried fault zone, which appears to be dipping northwestwards. The origin of the very low resistivity zone (< 20 Ohm-m) mediating between the JB and the RFZ is until now of unknown origin. In the context of the sea floor spreading and marine hydro-genetically precipitated ferromagnesian crust (Canet et al., 2008) of the oceanic RP, the observed high conductivities can be associated to subducted conductive sea floor. However, concentration of mineralized fluids can also account for the anomalous conductivity observed in the region (e.g. Corbo et al., 2013), and its presence along the Rivera transform fault zone would imply low frictional contact surface.
Conclusions
Accurate and stable absolute gravity measurements are now possible in Mexico with the certified FG5X-252 absolute gravimeter of CENAM, which has become also a national metrological reference. International comparisons have been successful in this goal and are planned to continue. The instrument certification allowed us to set up of new AG stations in central and western Mexico and to repeat measurements at the Jalisco Block AG sites established by NOAA in 1996.
The repeated measurement campaigns of 2016 and 2018 revealed unusual variations of AG in the JB that we associate with an event of aseismic subduction of the RP that occurred within of the two years period. The large earthquake of the 19 September 2017 with epicenter in the State of Puebla is thought to have triggered a slow -slip event that uplifted stations CHA (22.3 cm), MAN (54.6 cm), and UGG (44.3 cm). TEP (0.25 cm) and UGP (-16 cm) stations were unaffected by the uplift registered at the other JB sites. These constraints allowed us to advance the hypothesis that only a segment of the RP moved under the JB, which was facilitated by a lateral displacement along the nearby RFZ transform fault. Packed fluids on top of the subducted oceanic sediments may play a key role in this process. Monitoring measurements at established benchmark sites in the JB showed that rapid changes in geodetic height can be triggered by large earthquakes occurring hundreds of km away. A waveguide along the southern edge of the TMVB is assumed to have started the low-frictional mechanism of aseismic subduction in the region.

