


 nueva página del texto (beta)
 Inglés (pdf)
 Artículo en XML
 Referencias del artículo
 Enviar artículo por email
 Citado por SciELO
  Similares en
SciELO
Similares en
SciELO 
 Permalink
Introduction
Intraslab earthquakes in central Mexico occur in the subducted Cocos plate at a depth of ~ 40 to 80 km and involve normal faulting. The recent intraslab earthquake of 19 September 2017 (Mw7.1) was located near the border of the states of Morelos and Puebla (18.41 °N, -98.71 °E; depth H = 57 km) (Figure 1). It caused severe damage in central Mexico and Mexico City. Several towns in the epicentral region were almost completely destroyed. Extensive damage was reported in the states of Morelos and Puebla. In Mexico City 44 buildings collapsed and approximately 600 buildings were severely damaged. It was the second most destructive earthquake in the history of the city, next only to the 1985 Michoacán (Mw8.0) earthquake. The PGA at CU, a strong-motion station in the hill-zone of Mexico City that has been in continuous operation for the last 54 years, was 57 cm/s2, the highest ever recorded. In comparison, the PGA at CU during the 1985 earthquake was 29 cm/s2.
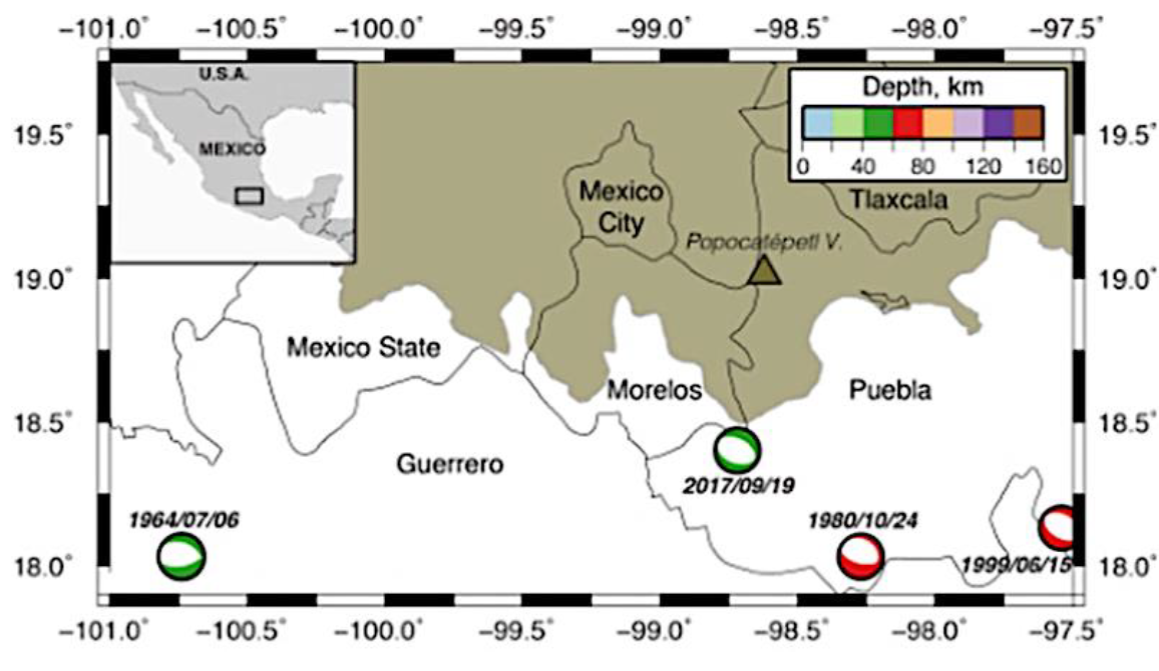
Figure 1 Map of central Mexico showing epicenters and focal mechanisms of four, recent significant intraslab earthquakes in the region. The epicenter of the 2017 earthquake is closer to Morelos and Mexico City than the other earthquakes.
It is well known that intraslab earthquakes pose significant seismic hazard to cities in central Mexico (see, e.g., Singh et al., 2018 for a brief review). In 1931 a Mw7.8 earthquake devastated the city of Oaxaca; in 1973 a Mw7.0 earthquake damaged some cities of Veracruz; a Mw7.0 earthquake in 1980 caused severe damage in the state of Oaxaca; in 1999 a Mw6.9 earthquake caused damage to the city of Tehuantepec and the states of Puebla and Morelos and Oaxaca; and the great intraslab earthquake of 8 September 2017 (Mw8.2), which occurred off the coast of Chiapas and Oaxaca, caused wide-spread destruction to the coastal towns of these states. Figure 1 shows epicenters of 4 significant, recent intraslab earthquakes in and near Morelos-Puebla region (06/07/1964, Mw7.3; 24/10/1980, Mw7.0; 15/06/1999, Mw6.9; 19/09/2017, Mw7.1). The earthquake of 2017 is the closest, reliably located, intraslab earthquake to Mexico City (Singh et al., 2018).
The 2017 and 1999 earthquakes were well recorded at many stations in central Mexico and Mexico City. The epicenters of the two events are separated by 127 km; the epicentral distance to CU in Mexico City from the 2017 and 1999 earthquakes are 113 km and 218 km, respectively (Figure 1). Here we analyze the accelerograms of the two earthquakes to relate the recorded seismic intensities with observed damage patterns. We then investigate whether the location alone can explain the difference in the pattern and level of damage during the two earthquakes or other factors also played a role. Our focus is central Mexico excluding Mexico City.
Recorded Strong Ground Motions
The 1999 earthquake was recorded in 33 stations on firm soil sites listed (Table 1). The largest recorded intensities (PGA= 184 cm/s2 and PGV=17 cm/s) were observed at CSER station located roughly 100 km from the epicenter. We constructed PGA and PGV contours via the Bayesian Kriging technique proposed by Kitanidis (1986). We first used the ground motion prediction equation (GMPE) proposed by Garcia et al. (2005) for Mexican intraslab earthquakes to generate prior median values of the intensities at different sites on a grid; these values were then updated with intensities listed in Table 1 via Bayes theorem. It is worth noting that 1999 data were used to construct the Garcia's GMPE therefore it fits well the 1999 data. We excluded recordings in Mexico City from the analysis because of the well-known large site effects. Figures 2a and 3a show PGA and PGV contours during the 1999 earthquake. The contours are elongated towards northwest from the epicenter suggesting rupture propagation towards this direction. This source directivity was previously documented from an analysis of the recorded waveforms (Singh et al. , 1999) as well as from PGA contours constructed using an interpolation technique based solely on the recorded data. The figures also show towns in the State of Puebla with population larger than 15,000.
Table 1 Recorded PGA and PGV during the 1999 earthquake
| Station | Lat | Long | R, km | PGA*, cm/s2 | PGV*, cm/s | Station | Lat | Long | R, km | PGA*, cm/s2 | PGV*, cm/s |
|---|---|---|---|---|---|---|---|---|---|---|---|
| AGCA | 16.837 | -99.645 | 275 | 10.11 | 0.80 | RABO | 18.569 | -98.445 | 124 | 141.59 | 11.01 |
| ATYC | 17.213 | -100.432 | 331 | 7.25 | 0.54 | RIOG | 16.014 | -97.439 | 245 | 5.71 | 0.46 |
| CHFL | 17.969 | -97.866 | 73 | 106.96 | 10.69 | SMLC | 16.655 | -96.729 | 196 | 13.29 | 0.67 |
| COMD | 18.122 | -100.524 | 323 | 15.56 | 0.89 | SMR2 | 16.774 | -99.438 | 261 | 7.57 | 0.75 |
| COPL | 16.611 | -98.984 | 239 | 9.59 | 0.81 | TAMA | 16.261 | -96.575 | 240 | 6.68 | 0.54 |
| COYC | 16.998 | -100.090 | 307 | 8.32 | 0.66 | TEAC | 18.618 | -99.454 | 219 | 33.30 | 2.68 |
| COYQ | 17.380 | -101.057 | 389 | 9.14 | 0.50 | TNLP | 18.096 | -99.561 | 224 | 35.79 | 2.31 |
| CSER | 18.989 | -97.377 | 112 | 184.47 | 17.39 | UNIO | 17.988 | -101.811 | 458 | 2.43 | 0.38 |
| JAMI | 16.284 | -97.821 | 218 | 17.18 | 0.55 | VIGA | 16.759 | -99.233 | 246 | 17.73 | 0.81 |
| LANE | 15.940 | -97.180 | 255 | 5.94 | 0.47 | VNTA | 16.914 | -99.819 | 286 | 6.06 | 0.49 |
| OCLL | 17.037 | -99.879 | 285 | 7.81 | 0.55 | YAIG | 18.862 | -99.067 | 191 | 43.16 | 3.42 |
| OMTP | 16.689 | -98.398 | 197 | 21.11 | 0.61 | CUER | 18.984 | -99.230 | 211 | 42.99 | 2.89 |
| OXLC | 17.065 | -96.703 | 160 | 20.74 | 1.80 | LVIG | 19.723 | -96.418 | 218 | 4.91 | 0.54 |
| PANG | 15.667 | -96.491 | 303 | 4.51 | 0.28 | MEZC | 17.930 | -99.591 | 228 | 27.44 | 1.62 |
| PET2 | 17.535 | -101.263 | 406 | 3.41 | 0.40 | OXIG | 17.072 | -96.733 | 158 | 28.53 | 1.40 |
| PHPU | 19.044 | -98.168 | 135 | 170.34 | 15.81 | BHPP | 19.109 | -98.227 | 143 | 58.55 | 5.51 |
| POZU | 17.090 | -99.598 | 257 | 18.42 | 0.71 | PLIG | 18.392 | -99.502 | 218 | 20.88 | 1.49 |
* PGA and PGV are the geometric mean of two horizontal components
1999
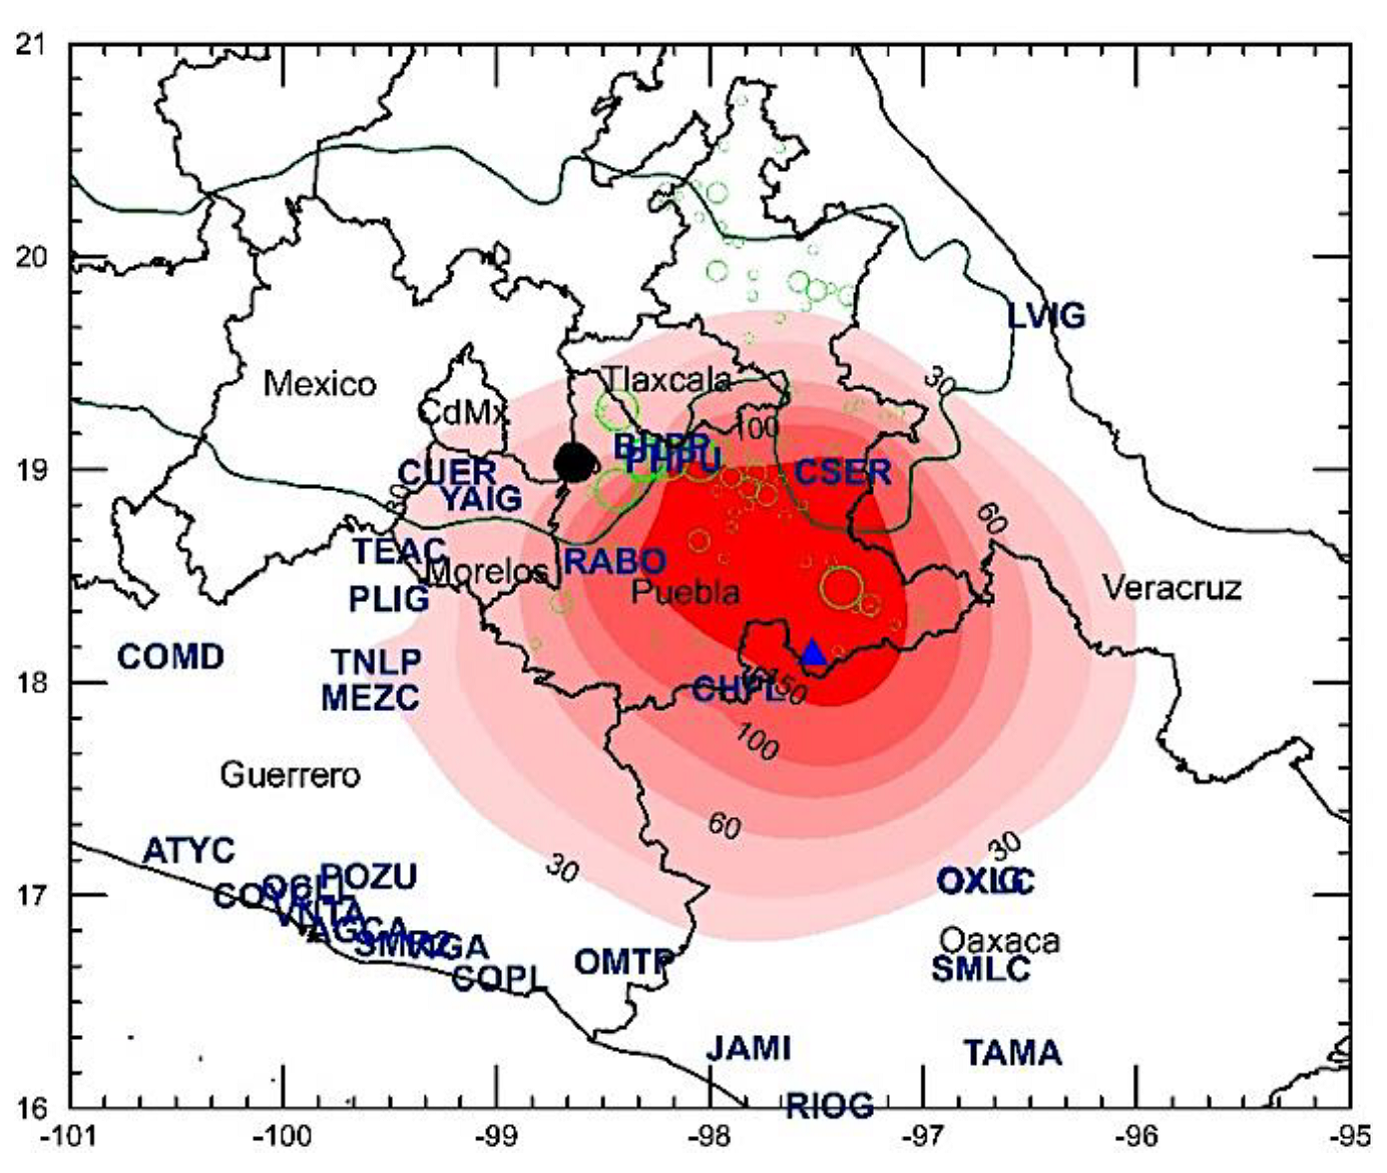
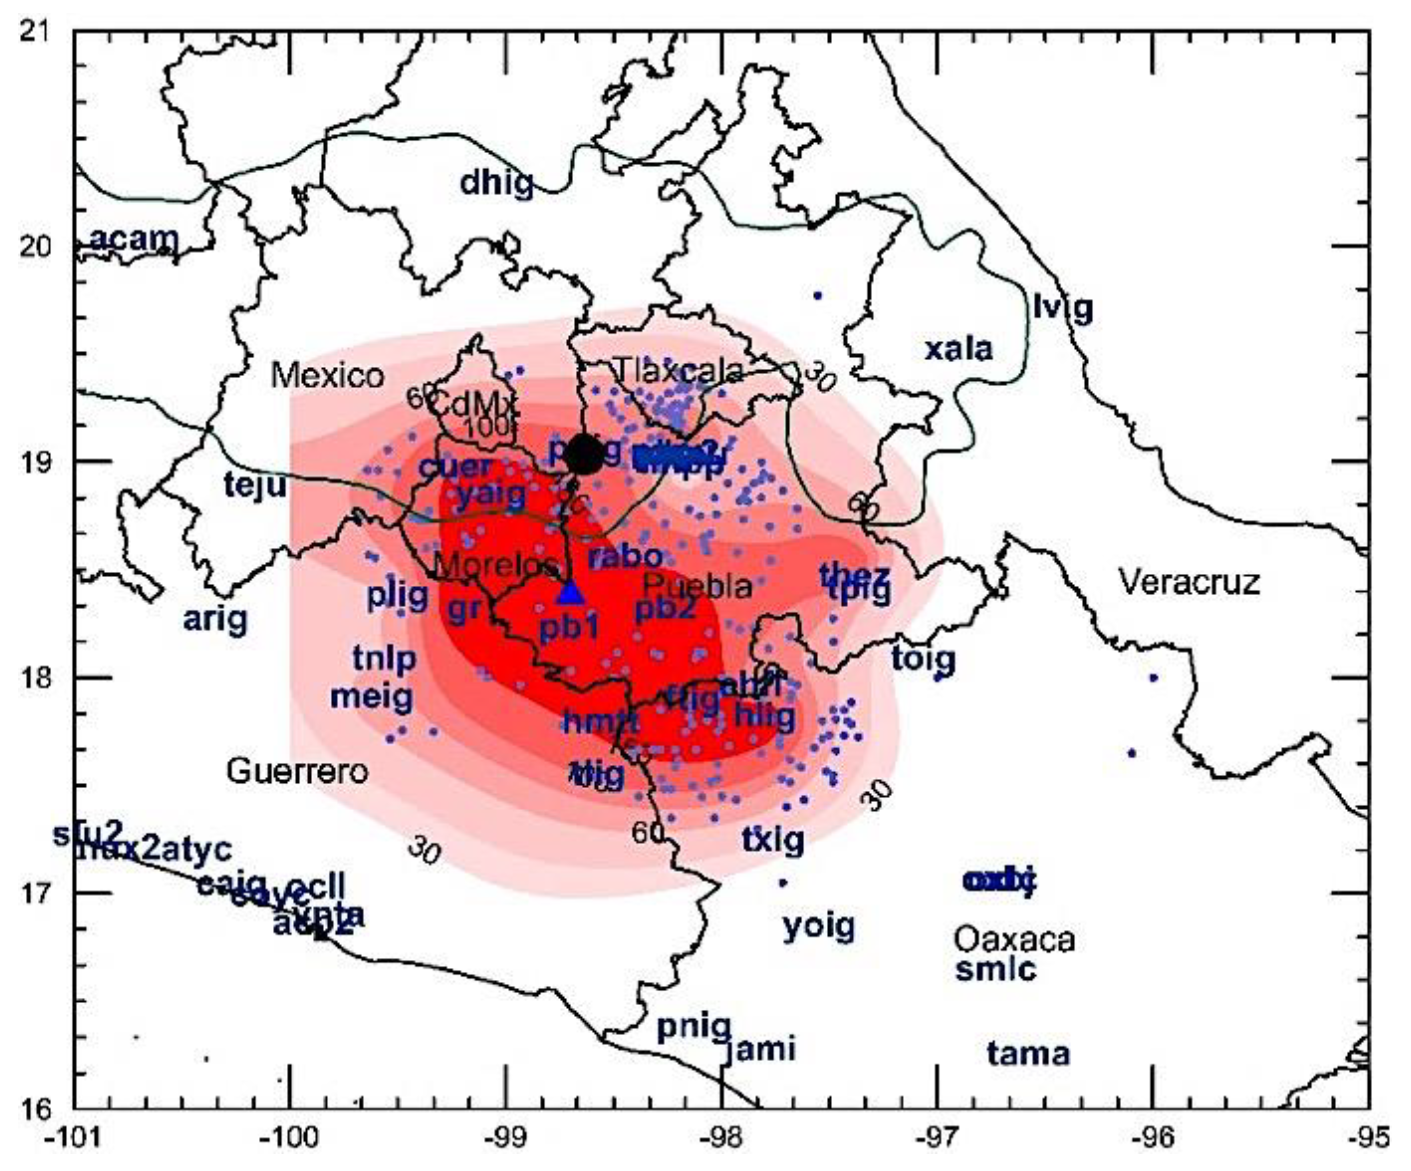
Figure 2 a) PGA contours during 1999 (Mw6.9) earthquake (top), and b) 2017 (Mw7.1) earthquake (bottom) in cm/s2. Triangle: epicenter. Station code is given by letters and is plotted at its location. Black dot: Popocatepetl volcano. Green contour: Mexican Volcanic Belt. Large, medium and small green circles are towns in Puebla with population > 100,000, 50,000 - 100,000 and 15,000 - 50,000, respectively
The 2017 earthquake was recorded at 64 firm soil sites (Table 2). The highest intensities were observed at FTIG station (PGA= 369 cm/s2 and PGV=12.7 cm/s) located roughly 100 km southeast from the epicenter. The PGA and PGV contours, shown in Figures 2b and 3b, were constructed following the same procedure as described before. The contours for this earthquake are elongated in the NW-SE direction with the epicenter in the middle, suggesting a bilateral rupture. Slip distribution on the fault plane of this earthquake has been mapped from the inversion of teleseismic waveforms (L.Ye, personal communication, 2018) as well as from the inversion of regional data (Melgar et al., 2017; A. Iglesias, personal communication, 2018). Not surprisingly, directivity is not discernible in the teleseismic inversion because of the relatively small magnitude of the event. Inversion by Melgar et al. suggests a directivity towards NW, which is contrary to Iglesias ' inversion that supports rupture propagation predominantly towards SE.
Table 2 Recorded PGA and PGV during the 2017 earthquake
| Station | Lat | Long | R, km | PGA*, cm/s2 | PGV*, cm/s | Station | Lat | Long | R, km | PGA*, cm/s2 | PGV*, cm/s |
|---|---|---|---|---|---|---|---|---|---|---|---|
| hlig | 17.830 | -97.800 | 128 | 227.98 | 14.29 | cuer | 18.984 | -99.230 | 102 | 158.94 | 18.88 |
| hmtt | 17.800 | -98.560 | 90 | 170.55 | 12.10 | ftig | 17.908 | -98.133 | 100 | 368.52 | 12.51 |
| phpu | 19.040 | -98.170 | 107 | 141.73 | 9.84 | Ivig | 19.723 | -96.418 | 287 | 1.84 | 0.37 |
| ppig | 19.070 | -98.630 | 94 | 112.62 | 12.96 | plig | 18.392 | -99.502 | 101 | 61.45 | 5.85 |
| tlig | 17.560 | -98.570 | 111 | 110.70 | 3.90 | pzpu | 19.055 | -98.227 | 105 | 105.35 | 13.67 |
| teju | 18.900 | -100.160 | 172 | 83.30 | 3.53 | rabo | 18.569 | -98.445 | 81 | 141.50 | 7.99 |
| meig | 17.920 | -99.620 | 124 | 74.59 | 2.42 | sxpu | 19.040 | -98.215 | 104 | 127.41 | 18.99 |
| tpig | 18.420 | -97.360 | 153 | 71.34 | 7.41 | tgbt | 16.777 | -93.089 | 624 | 0.88 | 0.12 |
| acp2 | 16.870 | -99.890 | 219 | 35.36 | 1.35 | thez | 18.478 | -97.383 | 151 | 157.41 | 11.34 |
| oxlc | 17.070 | -96.700 | 265 | 22.52 | 1.34 | tnlp | 18.096 | -99.561 | 112 | 58.25 | 3.62 |
| atyc | 17.210 | -100.430 | 233 | 18.69 | 0.67 | pb1 | 18.240 | -98.700 | 81 | 201.21 | 7.19 |
| coyc | 17.000 | -100.090 | 222 | 18.32 | 0.86 | pb2 | 18.330 | -98.260 | 81 | 223.43 | 15.12 |
| oxbj | 17.070 | -96.720 | 264 | 18.11 | 1.45 | gr | 18.330 | -99.190 | 81 | 258.29 | 7.86 |
| vnta | 16.910 | -99.820 | 212 | 10.63 | 0.89 | huig | 15.768 | -96.108 | 407 | 4.11 | 0.32 |
| pet2 | 17.540 | -101.260 | 292 | 10.03 | 0.44 | peig | 15.999 | -97.147 | 320 | 10.88 | 0.92 |
| xala | 19.530 | -96.900 | 234 | 8.28 | 1.50 | pnig | 16.392 | -98.127 | 239 | 6.63 | 0.82 |
| caig | 17.050 | -100.270 | 231 | 8.07 | 0.42 | toig | 18.096 | -97.065 | 186 | 19.36 | 1.40 |
| unio | 17.990 | -101.810 | 336 | 6.08 | 0.42 | txig | 17.254 | -97.761 | 172 | 41.42 | 5.20 |
| urua | 19.420 | -102.070 | 375 | 6.04 | 0.86 | yoig | 16.858 | -97.546 | 219 | 9.43 | 1.63 |
| nilt | 16.570 | -94.620 | 482 | 5.98 | 0.29 | cdgu | 19.700 | -103.448 | 521 | 1.95 | 0.70 |
| pang | 15.670 | -96.490 | 389 | 4.68 | 0.51 | coll | 19.191 | -104.681 | 637 | 1.38 | 0.17 |
| acam | 20.040 | -100.720 | 284 | 4.48 | 1.31 | jami | 16.284 | -97.821 | 260 | 15.30 | 1.43 |
| ziig | 17.610 | -101.460 | 309 | 4.19 | 0.50 | lane | 15.948 | -97.187 | 322 | 5.50 | 0.77 |
| cmig | 17.090 | -94.880 | 434 | 2.99 | 0.35 | lmpp | 19.001 | -98.182 | 103 | 37.13 | 3.33 |
| dhig | 20.300 | -99.040 | 221 | 2.73 | 0.80 | nux2 | 17.217 | -100.791 | 263 | 7.66 | 0.51 |
| coma | 19.330 | -103.760 | 544 | 2.23 | 0.44 | ocll | 17.037 | -99.879 | 204 | 17.49 | 0.88 |
| chpa | 16.250 | -93.910 | 565 | 2.16 | 0.27 | pbp2 | 19.045 | -98.208 | 105 | 95.98 | 15.31 |
| mmig | 18.290 | -103.350 | 493 | 2.14 | 0.34 | rpig | 21.885 | -99.983 | 413 | 4.41 | 1.29 |
| tuig | 18.030 | -94.420 | 458 | 2.07 | 0.33 | sjal | 18.585 | -103.670 | 527 | 3.31 | 0.22 |
| yaig | 18.862 | -99.067 | 85 | 202.00 | 13.00 | slu2 | 17.281 | -100.935 | 273 | 11.78 | 0.53 |
| arig | 18.281 | -100.344 | 182 | 31.44 | 1.73 | smlc | 16.655 | -96.729 | 292 | 10.50 | 1.11 |
| chfl | 17.969 | -97.866 | 116 | 76.38 | 7.30 | tama | 16.261 | -96.575 | 333 | 7.30 | 1.00 |
* PGA and PGV are the geometric mean of two horizontal components

The area under PGA contour of 150 cm/s2 in 2017 is roughly 15,400 km2, slightly greater than the corresponding area of 12,700 km2 in 1999. This PGA contour during 2017 covers 75%, 20%, 4% and 2% of the states of Morelos, Puebla, Guerrero, and Oaxaca, respectively; the corresponding numbers during 1999 are 0%, 35%, 0%, and 2%. In 2017, 24%, 45%, 17%, and 14% of the total area under the 150 cm/s2 contour fall in the states of Morelos, Puebla, Guerrero, and Oaxaca, respectively (Table 3). In contrast, in 1999 the total area under the same PGA contour was distributed as follows: 0%, 84%, 13%, and 3% in the states of Morelos, Puebla, Oaxaca, and Veracruz, respectively.
Table 3 Percentage of total area and population under PGA contour of 150 cm/s2 in different states in central Mexico during the 1999 and 2017 intraslab earthquakes. Total area under this contour was 1.27x10⁴ km2 and 1.54x10⁴ km2 during 1999 and 2017, respectively.
| State/ area | Year | Population | % of total area under | Inhabitants under 150 |
|---|---|---|---|---|
| 150 cm/s2 contour | cm/s2 contour | |||
| Morelos / 4.96x10³ km2 | 1999 | - | 0 | 0 |
| 2017 | 1.97x10⁶ | 24 | 1.46x10⁶ | |
| Puebla / 3.429x10⁴ km2 | 1999 | 5.00 x10⁶ | 84 | 1.57x10⁶ |
| 2017 | 6.37 x10⁶ | 45 | 1.30x10⁶ | |
| Guerrero/6.36x104 km2 | 1999 | - | 0 | 0 |
| 2017 | 3.65 x10⁶ | 17 | 1.23x10⁵ | |
| Oaxaca/9.38x104 km2 | 1999 | 3.44x10⁶ | 13 | 6.05x10⁴ |
| 2017 | 4.10x10⁶ | 14 | 9.42x10⁴ | |
| Veracruz/7.28x104 km2 | 1999 | 6.91x10⁶ | 3 | 3.62x10⁴ |
| 2017 | - | 0 | 0 |
Estimated number of persons living within PGA contour of 150 cm/s2: 1.67x10⁶ in 1999 and 2.98x x106 in 2017.
Seismic Intensities and Reported Damage
From the PGA contours shown in Figures 2 to 3, assuming uniform density of population and construction throughout the region, we expect:
Extensive damage in the State of Morelos in 2017 but little damage in 1999.
More damage in the State of Puebla and the city of Puebla during 1999 than in 2017.
Lesser damage to the south of the epicenter in 1999 but nearly equal damage to NW and SE of the epicenter in 2017.
Marginally more damage during 2017 than in 1999.


A detailed description of the damage during the 1999 earthquake is given by Alcocer et al. (1999). Information on damage during 2017 in central Mexico has been compiled by E. Reinoso and his colleagues (personal communication, 2018). A preliminary estimation of damage to historical monuments is available to us (Secretaría de Cultura, 2018). The municipalities receiving funds for reconstruction from the government program for natural disasters (FONDEN) in 1999 and 2017 should, in principle, provide information on the damage. In 2017, the municipalities receiving funds, generally, fall within the PGA contour of 60 cm/s2 (Figure 4). However, the correlation between PGA and municipalities receiving funds from FONDEN during the 1999 earthquake is poor (Figure 4). This may be a consequence of the fact that FONDEN became operational in 1999. The criteria for assigning funds in 1999 may have been different from those in 2017.
1999

Figure 4 a) PGA contours in cm/s2 for 1999 (top) and b) 2017 (bottom) earthquakes and municipalities that received funds for reconstruction from FONDEN.
2017
Since the available damage reports during the two earthquakes were not elaborated using the same criteria, it is difficult to relate seismic intensity contours of the two earthquakes with ensuing reported damages. Even so, a rough comparison is possible. There were no fatalities reported in Morelos in 1999 (Alcocer et al., 1999); in 2017 there were 74. Although 45 fatalities are reported in Puebla in 2017 and only 15 in 1999 (Alcocer et al., 1999), it is generally accepted that the damage in the state was more severe in 1999 than in 2017. This is also in agreement with damage to historical monuments (churches, monasteries, and government buildings) during the two earthquakes. The 1999 and 2017 earthquakes caused damage to 1124 and 448 historical monuments, respectively (Secretaría de Cultura, 2018). Less damage to the south of the 1999 epicenter is partly supported by the geographical distribution of municipalities receiving funds from FONDEN (Figure 4).
If we assume that the area of severe damage is proportional to the area under the PGA contour of 150 cm/s2 then we expect only marginally more damage in 2017 than in 1999. Yet, there is consensus that the damage in 2017, even excluding Mexico City, was far greater than in 1999. One possibility is that the area of high seismic intensities in 2017 coincided with that of high density of population and historical monuments. Since areas under PGA and PGV contours during the two earthquakes are roughly similar, the difference in their source strength is unlikely to be the cause of much higher damage in 201 7. Even so, we first explore, in more detail, the source characteristics of the two earthquakes and its effect on the damage pattern. We then return to distinct locations of the two earthquakes along with uneven density of population, dwellings and historical monuments, and demographic increase since 1999 as the principal causes of the difference in damage during the two earthquakes.
Possible Source Effect on Ground Motion and Damage Distribution
PGA and PGV values as function of minimum distance to the rupture area, R, during the 1999 and 2017 earthquakes are illustrated in Figure 5. The figure also includes predicted median values from the ground motion prediction equation by Garcia et al. (2005), henceforth called the G05 model. In general, PGA and PGV values are similar for the two earthquakes. G05 model fits well the PGA data but underestimates observed PGV, except for the 1999 earthquake at sites at R greater than about 200 km located to the south of the epicenter. We note that PGA and PGV for 2017 at sites north and south of the epicenter follow the same attenuation trend. During 1999, however, the PGA, but especially PGV values, are greater to the north and smaller to the south with respect to the trend. This is in agreement with bilateral and northward rupture propagation during 2017 and 1999 earthquakes, respectively, mentioned before. PGA at CU, a firm site in the UNAM campus, Mexico City, during the two earthquakes are in agreement with G05 model but PGV values are much higher than predicted by the model.

Figure 5 a) PGA and b) PGV during the 2017 and 1999 earthquakes as a function of minimum distance to the fault, R. The filled symbols are sites to the north of the epicenter and the star is CU station in Mexico City. G05: prediction from GMPE of Garcia et al. (2005). Observed PGV is greater than G05 model prediction, except at sites south of the 1999 epicenter.
Several stations recorded the ground motion during both earthquakes. This permits a comparison of Fourier amplitude spectra of the two earthquakes and, hence, probe their relative source strength. For the comparison, we reduced the spectra of the 1999 earthquake to the same hypocentral distance as the 2017 earthquake by correcting for geometrical spreading, G(R), and quality factor, Q. Following Garcia et al. (2004), we take G(R) = 1/R and Q=251f0.58. The geometric mean of two horizontal components of the reduced spectra are shown in Figure 6. The reduced spectra at sites PHPU, YAIG, RABO and PLIG are greater in 1999 than 2017 at frequencies close to 1 Hz. At CUER the two reduced spectra are similar or somewhat smaller in 1999. At CHFL the reduced spectrum in 1999 is slightly smaller than in 2017. The spectra in Figure 6 are consistent with rupture propagation to the north in 1999.

Figure 6 Fourier acceleration amplitude spectra at some stations that recorded the 2017 and 1999 earthquakes. The 1999 spectra, reduced to the same distance at which the 2017 earthquake was recorded by correcting them for geometrical spreading and anelastic attenuation, are also shown.
From the above, we expect the reduced 1999 spectrum at CU in Mexico City to be higher than the 2017 spectrum. Figure 7, however, shows just the opposite; the 2017 spectrum near 1 Hz is significantly higher than the 1999 spectrum. The reason, as discussed by Shapiro et al. (2002), is that the seismic waves from 1999 earthquake reaching CU traversed below the active

Figure 7 Fourier amplitude acceleration spectra at CU in Mexico City during the 2017 and 1999 earthquakes. The station is located at hill zone. The 1999 spectrum was corrected for geometrical spreading and anelastic attenuation to reduce it to the same distance at the which the 2017 earthquake was recorded.
Popocatepetl Volcano and suffered high attenuation. During the 2017 earthquake the wave path to CU does not pass through the volcano (Figures 1, 2, and 3). A test of this hypothesis is provided by the 2017 recordings at DHIG and PNIG that are located at roughly the same distance (~ 230 km) from the epicenter (Figure 2). The path to DHIG, however, crosses the volcano. As expected, the spectrum at DHIG relative to PNIG is depleted at f > 0.8 Hz (Figure 8).

Figure 8 a) (Left) Fourier amplitude acceleration spectra at stations DHIG and PNIG during the 2017 earthquake (see Figure 1 for location of the stations). The stations are located at nearly the same hypocentral distance from the earthquake (~230 km). b) (Right) PNIG to DHIG spectral ratio.
To summarize, we find that the 1999 source was more energetic to the north of the epicenter than the 2017 source. It follows that the significantly larger damage in central Mexico during 2017 as compared to 1999 can't be attributed to the source. The 2017 earthquake produced severe damage to certain zones in Mexico City while the 1999 earthquake was only moderately felt. The difference in the damage can be attributed to the fact that the 2017 earthquake was closer to Mexico City (R=127 km) than the 1999 earthquake (R=226 km). High attenuation due to wave path crossing Popocatepetl during 1999 was also partly responsible. The 2017 earthquake occurred closer to more densely populated towns and cities of the State of Morelos than the 1999 earthquake. Next, we explore the effect of location of the earthquakes on the damage.
Effect of Location of the 1999 and 2017 Earthquakes on the Damage in Central Mexico
We assume that the damage is proportional to the area enclosed in the PGA contour of 150 cm/s2. As mentioned earlier, these areas were 1.24x10⁴ and 1.54x10⁴ km2 during 1999 and 2017, respectively. The distribution of these areas in different states is given in Table 3, along with the total area and number of inhabitants of each state. A demographic increase of 1.65% per year has been assumed in the estimation of number of inhabitants. As given in the table, the total number of inhabitants within the PGA contour of 150 cm/s2 during 1999 and 2017 were ~ 1.67x10⁶ and 2.98x10⁶, respectively. These simple calculations suggest roughly two times more damage in 2017 as compared to 1999. Note that the affected number of inhabitants in 2017 in the states of Morelos and Puebla are 1.46x10⁶ and 1.30x10⁶, respectively. This implies only slightly higher damage in Morelos than in Puebla. E. Reinoso (personal communication, 2018), however, reports 1432 and 464 damaged structures in Morelos and Puebla, respectively. Clearly, our estimation of damage is over simplified. It, nevertheless, provides a gross overview of the damage.
Conclusions
From the analysis of strong-motion recordings during the 1999 and 2017 intraslab earthquakes in central Mexico, we conclude that: (1) The rupture during 1999 propagated towards north while the directivity was bilateral during 2017. (2) PGA and PGV contours during the two earthquakes had similar areas, suggesting roughly similar source strength. PGA and PGV as function of distance were also similar during the two earthquakes. However, PGV values during 1999 at stations to the south, in the direction away from rupture propagation, were, relatively, smaller. (3) The GMPE for Mexican intraslab earthquakes (Garcia at al., 2005) predicts well the observed PGA during the two earthquakes but grossly under estimates PGV. (4) At a finer level, the 1999 source was somewhat more energetic to the north of the epicenter than that of 2017. (5) Path effect may significantly affect the ground motion and, hence, the damage pattern
In view of the above, we would have expected a similar level and pattern of damage during the two earthquakes or even larger damage to the north of the epicenter during the 1999 earthquake. In reality, the pattern and level of damage during the 2017 differ from those observed during the 1999 and the 2017 earthquake caused significantly more damage in central Mexico. This leads us to conclude that the distinct locations of the two earthquakes along with uneven density of population, dwellings, and historical monuments in the region, and the demographic increase since 1999 were the principal causes of the difference in damage during the two earthquakes. Changes in construction quality may also have played a role in the observed differences. Finally, path effect may significantly affect the ground motion and, hence, the damage pattern. This is especially true for waves traversing Popocatepetl volcano which greatly attenuates of high-frequency shear waves.

