


 nueva página del texto (beta)
 Inglés (pdf)
 Artículo en XML
 Referencias del artículo
 Enviar artículo por email
 Citado por SciELO
  Similares en
SciELO
Similares en
SciELO 
 Permalink
Introduction
Most hydrocarbon plays in fault bounded structural traps are associated with faults. These faults maybe sealing or allowing the flow of hydrocarbons through them. Several techniques were introduced to carry out fault seal analysis. These include: distribution of pore pressure of the fluids, clay smearing to estimate the strength of sealing capacity of the faults (Berg and Avery, 1995), use of the shale smear factor (SSF) which provides continuous shale smear on the fault surface (Lindsay et al., 1993), geochemical analysis and fluids pressure present in the reservoir to identify fluid composition in juxtaposed sand (Alexander, 1998), and the use of Allan-type diagram to analyze juxtaposed reservoirs and traps (Allan, 1989). The SSF method estimates the profile thickness of shale drawn along the fault zone during faulting. The Allan-type diagrams usually use the interpreted horizons from seismic data to define the hanging wall and foot wall offset across the fault and lithology to identify stratigraphic changes between seismic horizons (Cerveny et al., 2004). Shale gouge ratio (SGR) is used to determine the sealing potential of a fault to minimize fault risk associated with hydrocarbon exploration and production, by estimating the amount of clay-shale material incorporated into the fault plane, depending upon the fault displacement and shale content of the displaced rock (Yeilding et al., 1997). SGR and SSF parameters vary over the fault surface, implying that faults cannot simply be designated sealing or non-sealing.
Fault seal can arise when juxtaposition of sand against shale due to the displacement along a fault causing the seal to hydrocarbons. Such faults are called juxtaposition seals. In some cases, the fault itself acts as a seal to hydrocarbons flow such that the sealing mechanism is due to fault itself rather than juxtaposed rocks (Yielding et al., 1997). In this case the displacement of a rock along a fault results in abrasion or smearing and causes gouge material from surrounding rock to be incorporated into the fault plane and hence acts as a seal to hydrocarbons (Fulljames et al, 1997; Sverdrup et al, 2003).
In the current study, an attempt has been made to classify faults mainly on the basis of juxtaposition, SGR, and SSF analysis. This will help to understand the seal capability of faults in the Badin Block, which are generated due to extensional tectonics in the southern Indus basin of Pakistan. Closely spaced sand and shale beds in the study area are analysed for leakage identification. Properties associated with sealing capacity or leakage of the fault were estimated by using algorithms which are based upon the juxtaposition of reservoir against sealing lithology.
Geological framework and stratigraphy
Three major sedimentary basins including the Indus, Baluchistan and Kakarkhurasan Basins exist in Pakistan. Among these, the Indus and Baluchistan basins are separated by a major faulted and fractured zone (Raza et al., 1990; Quadri and Shuaib, 1986). The axial belt of highly folded mountains covers an area of about 828,00 km2. The Indus Basin has been explored quite extensively and a huge amount of oil and gas has been extracted. The main structural features of the Indus Basin are: a platform, fore-deeps, and folded and faulted zones (Raza et al., 1990). The area corresponds to the Indian Platform and coincides with the present Indus plain that is further sub-divided into: The Punjab Monocline, the Sukkur Rift zone, and the Sindh Monocline (Zaigham et al., 2000). The Badin area is geologically adjacent to the coast-line of Pakistan near Indian border. The study area lies in the main oil producing region of Sindh Monocline within lower Indus basin (Figure 1). The dominant feature of the area is extensional tectonics as shown by the presence of tilted blocks (Memon et al., 1999). The Hydrocarbon traps in the region are normal faults. The Sember Formation is the source rock, the Lower Goru having good porosity is the reservoir rock and the Upper Goru Formation provides an excellent seal (Jamil et al., 2012).

During Early to Middle Cretaceous time, Lower Indus Basin was subjected to an extensional regime existed in faulted blocks, this was followed by volcanic intrusions, as witnessed in the southern part of Sindh (Pakistan) and Kutch region in India (Raza et al., 1990). These two important geological episodes have significantly affected and altered the tectonics of the Badin area, creating a series of normal faults resulting in horst and graben structures. The tilted fault block traps were in existence at hydrocarbon generation time. The oldest formation present in Badin area is the Chiltan Limestone of Jurassic age, which is covered by the rocks of Triassic age (Khan et al., 2013). Whereas, Sembar and Goru Formations of Lower Cretaceous age with sand-shale sequence are lying above the Chiltan Formation (Wasimuddin et al., 2005). The Lower Goru sands correspond to the hydrocarbon reservoir rocks while the shaly Upper Goru shale Formation provides a geological seal (Ahmad et al., 2012). The structural closures associated with faults are responsible for oil and gas accumulation in Lower Goru sandstone (Kemal et al., 1991). The Lower Goru Formation contains several layered sand units sandwiched between the Upper Goru Formation and the shaly Sembar Formation. The sands are known as: Upper sand, Middle sand and Basal sand which are separated by several shale intervals (Berger et al., 2009). The sand is subdivided into different units known as sands A, B, C, and D with alternative shale intervals (Figure 2).

Several main tectonic events controlling the sedimentology of the Badin Block are: (a) the rifting of the Indian Plate from Gondwanaland during Jurassic or Early Cretaceous time which probably created the northeast-southwest to north-south rift systems (Zaigham and Mallick, 2000); (b) the disjointing of the Madagascar and Indian plates that occurred in the Mid to Late Cretaceous might have caused some sinistrial strike-slip faulting. Hotspot activity and thermal doming in the region took place at the Cretaceous-Tertiary boundary (Carmichael et al., 2009; Keller et al., 2008); (c) these geological events resulted in caused uplift, erosion, extrusion of the Deccan volcanics and probably the north-north-west-striking normal faults. The syn-rift and post-rift depositional pattern of the Lower Goru and Upper Goru formations continued during Early to Middle Cretaceous, which could be noticed as thin layering of Upper Goru on the top of the faulted blocks (horst blocks) whereas thicker in the lower graben (Daniel et al., 2000).
Methodology
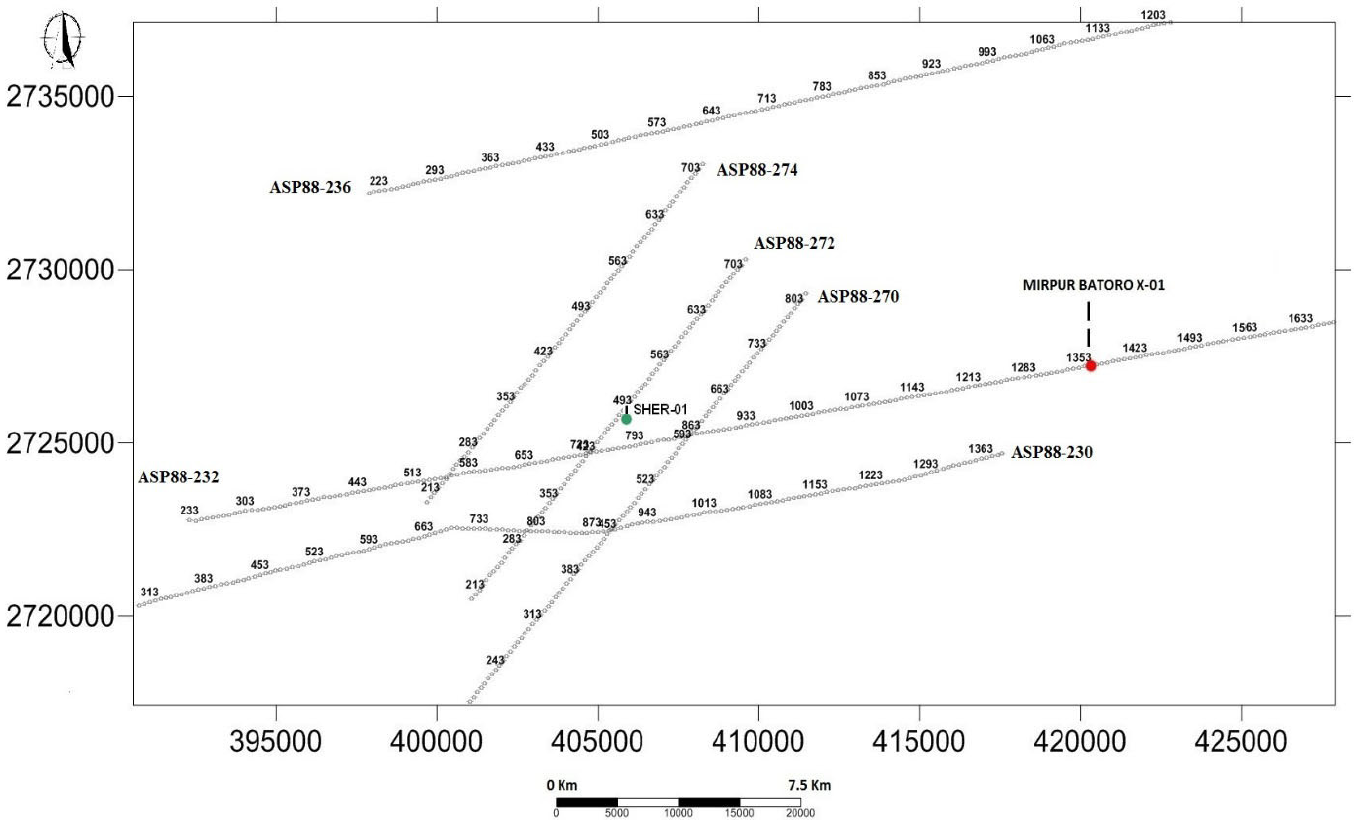
A set of seismic data commonly used for subsurface mapping and interpretation was used to study the area. The area is rich in both structural and stratigraphic traps, the data used for the present study is comprised of 3 dip-oriented (ASP88-274, ASP88-272, and ASP88-270) and 3 strike-oriented (ASP88-236, ASP88-232, and ASP88-230) seismic lines and information from two wells namely Sher-01 and Mirpur Bataro X-01 (Figure 3).
The horizons are picked by incorporation of seismic and well log data using synthetic seismogram. Faults are identified and picked in the seismic sections (Figure 4), the time sections are converted to depth sections using velocity information obtained from well data. Fault seal analysis was carried out by adopting the methodology presented by Yielding et al., (1997). In the first phase of the fault seal analysis, a first-order seal analysis identifies reservoir juxtaposition zones over the fault surface using the interpreted seismic horizons to prepare Allan-type and Juxtaposition diagrams. For Allan-type diagram initially a reference line representing the fault plane, was drawn from the base map along x-axis. While y-axis comprises the two-way time (TWT) of the sand-shale intervals. In this way, the hanging wall and the foot wall of all sand-shale intervals are modeled on two different sheets. Overlapping both sheets give a 3D model of sand/shale intervals showing areas of reservoirreservoir juxtaposition and reservoir-non reservoir juxtaposition. Juxtaposition diagram enables a rapid examination and prediction of fault seal capacity. This technique provides images for the hanging wall and juxtapositions for varying throws, and allows an evaluation of the juxtaposed stratigraphic intervals for a given throw. These diagrams simplify the analysis of juxtaposition for a single fault plane (Cerveny et al., 2004).
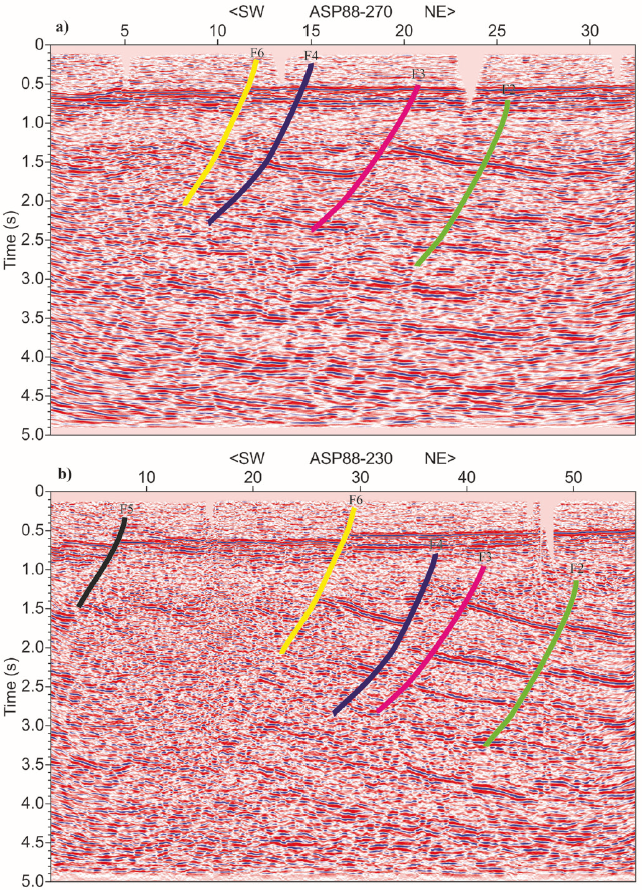
Figure 4 Seismic sections with identified faults showing the half-graben structure. a) Dip oriented seismic line (ASP88-270) with faults F2, F3, F4, and F6, b) Strike oriented seismic line (ASP88-230) with faults F2, F3, F4, F5 and F6.
The second phase of the analysis evaluates other lithology dependent attributes that contribute to the sealing capacity of a fault. i.e. SGR and SSF. The SGR is estimated by taking the volume of shale from the gamma ray log of Sher-01 and estimating the thickness of the shale bed from a seismic section; both of these parameters in association with the fault throw are incorporated in the equation below:
SGR = Σ (Thickness of shale bed * Volume of shale in fraction) / Fault throw * 100%
The SSF is estimated by using the following relation:
SSF = Fault throw / Shale layer thickness
The juxtaposition maps are correlated with SGR and SSF to confirm the results. Flow charts for seismic interpretation and fault seal analysis utilized in this study are given below:

Results and discussion
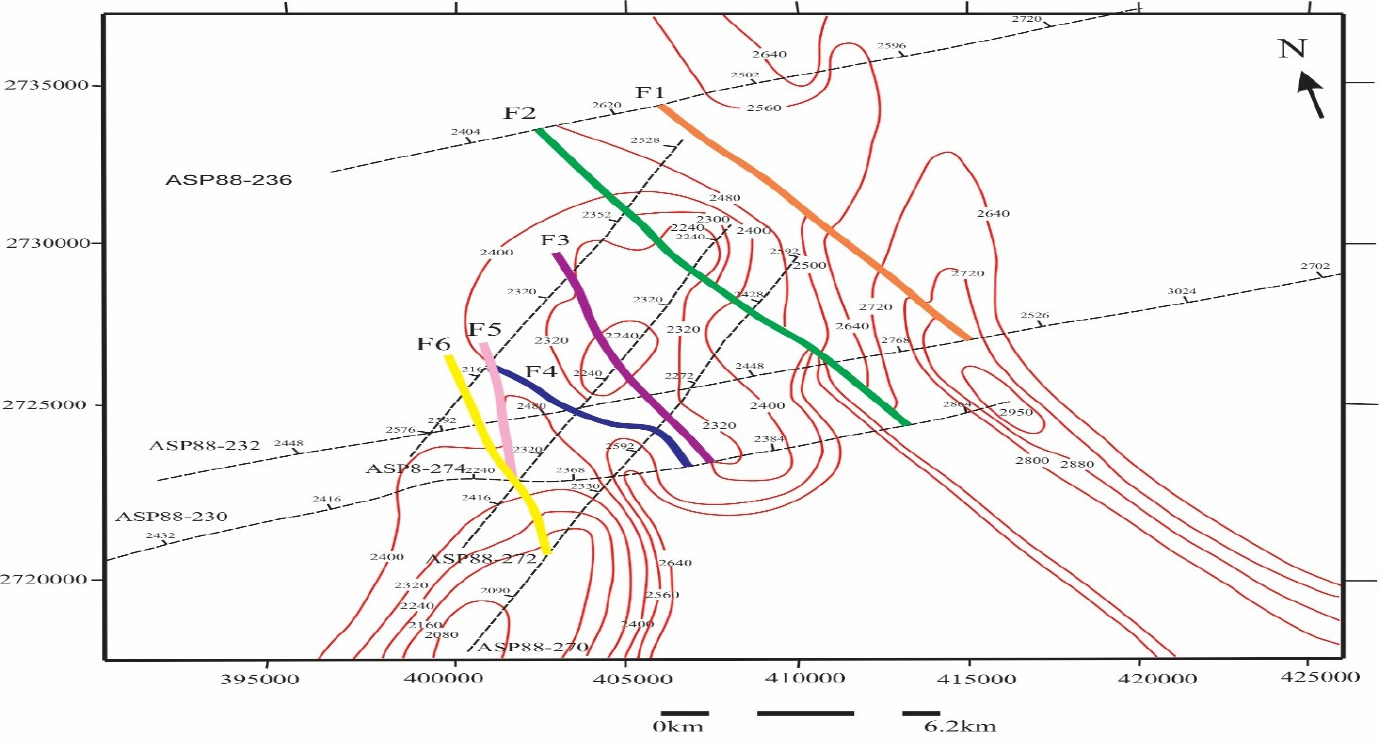
Figures 5 and 6 show the time and depth contour maps of top of the Lower Goru Formation respectively. The structure from their maps represents a half-graben and analysis of the study concerned with fault F2 as it is extended throughout the area. The maps show decreasing values of time and depth contours towards the center of the map and confirm the dipping of Top Lower Goru (TLG) towards East. The contour values increase towards the southwest and southeast part. A closure is also observed towards the center that can serve as a hydrocarbon lead.

Figure 5 Time contour map in msec of top of the Lower Goru Formation with high values at sides and low values towards the center. Fault F2 is extended throughout the area and covering all dip and strike oriented seismic lines.
Allan-type diagram
The hanging and foot walls of Lower Goru Formation are presented in Figures 7 and 8 respectively. Different sand intervals including sand A, B, C, and D with 85m, 119m, and 100m thickness 85m respectively are represented by different colors, and different shale types lie within the sand intervals as: Talhar shale with 187m thickness situated between sand A and B, Badin shale with 395m thickness situated between sand B and C, and Turk shale with 249m thickness situated between sand C and D respectively. An Allan-type diagram is interpreted as follows: the intersection of similar colors shows self-juxtaposition of a single sand interval, the intersection of two different colors shows the juxtaposition of two different sand intervals, while non-intersected colors show the juxtaposition of sand against shale (Figure 9). The fault can function as a migration path to hydrocarbons if there is self-juxtaposition of a single sand interval as represented by intersection of similar colors or juxtaposition of two diachronic sand intervals as shown by intersection of two different colors. The fault can provide a seal to hydrocarbon migration only when sand-shale or permeable-impermeable rocks are juxtaposed against each other as represented by non-intersected colors. It is clearly visible that sand A is not only self-juxtaposed but also slightly juxtaposed with sand B so it can be designated as poor seal i.e., green color is juxtaposed with itself and also with maroon color below. Between sands B and C, there is some shale incorporation and a possible sand shale juxtaposition which increases the sealing capacity of the fault. Between sands C and D, a possible sand juxtaposition between foot walls is seen but a sand shale juxtaposition is also evident, and is considered to act as a seal.

Figure 7 Hanging wall of Lower Goru Formation. Sand intervals A, B, C, and D are shown with Green, Red, Yellow, and Brown color respectively. The Talhar, Badin, and Turk shale lie within the sand intervals.

Figure 8 Foot wall of Lower Goru Formation. Sand intervals A, B, C, and D are shown with Green, Red, Yellow, and Brown color respectively. The Talhar, Badin, and Turk shale lie within the sand intervals.

Juxtaposition diagram
Another complicated evaluation of the stratigraphic distribution across the fault plane, as used in Allan-type diagrams, are simplified through juxtaposition diagrams in which SGR and SSF parameters vary over the fault surface. Higher values of SGR correlate with greater fault seal potential (Sahoo et al., 2010). For SGR < 20 % or a ratio of < 0.2, the sealing capacity of the fault is considered to be unlikely. If SGR varies between 0.2-0.4 v/v (20% - 40%) the fault is considered as poor seal and will be retarding to fluid flow. For SGR 0.40.6 v/v (40% - 60%) the fault is considered to be a moderate seal. For SGR > 0.6 v/v (>60%) the fault is considered as a likely sealing fault (Singh et al., 2011). Similarly, for SSF < 7, a fault is considered to be a good seal while for SSF > 7, a fault is considered to be a poor seal (Lindsay et al., 1993). Figure 10 shows an increase in SGR as depth increases i.e. the sand A and B have low SGR values while sand C and D have comparatively high SGR values. This suggests a good fault sealing potential in sands C and D while a poor sealing potential for sands A and B. On the other hand, the SSF has showed high values in sands A and B thus suggesting a less sealing capacity, while a low value in sands C and D. This pattern indicates a good sealing potential of the fault at these sands (Figure 11).

Figure 10 Juxtaposition diagram showing SGR. The sands A and B have low SGR values at shallow level, while high SGR values of sands C and D towards the base indicate good sealing potential of the fault.

SGR and SSF trends
The identified trends of SGR and SSF show variations with respect to the varying fault throw among different sand intervals (Table 1). The trend shows that SGR decreases with increasing fault throw, while SSF increases with increasing fault throw for a particular sand interval. Therefore, sealing capacity of the fault (F2) increases from sand A (poor seal) where SGR = 0.44 % - 0.9 % and SSF = 0.23 - 1 to sand D (moderate seal) where SGR = 10 % -44 % and SSF = 0.05 - 0.22.
Table 1 Average SGR, SSF, and fault throw of sands A, B, C, and D.
| Sand type | Avg SGR % |
SSF | Fault throw (m) |
|---|---|---|---|
| A | 0.90 | 0.23 | 42.50 |
| 0.45 | 0.96 | 174.2 | |
|
|
0.44 |
1.00 |
180.5 |
| B | 4.80 | 0.11 | 42.50 |
| 1.17 | 0.47 | 174.2 | |
|
|
1.10 |
0.48 |
180.5 |
| C | 24.4 | 0.05 | 42.50 |
| 6.06 | 0.20 | 174.2 | |
|
|
5.85 |
0.21 |
180.5 |
| D | 40.0 | 0.05 | 42.50 |
| 9.77 | 0.21 | 174.2 | |
| 9.43 | 0.22 | 180.5 |
Conclusions
Interpretation of the seismic sections of the study area showed faulted blocks of the extensional regime with a half-graben structure. Time and Depth contour maps confirm that Top Lower Goru (TLG) is dipping towards East and the zones of closed contours along a fault (F2) show possible traps for hydrocarbon accumulation. It is predictable from Allan-type diagram that hydrocarbon migration can be prevented in the sealing zones of juxtaposed sand-shale beds evident in sands C and D. Moreover, the remaining zones occupied by self-juxtaposed sand and juxtaposed rocks of two different sand intervals of sand A and B are providing the migration path to hydrocarbons. Juxtaposition diagram shows that SGR decreases with increasing fault throw while SSF increases with increasing fault throw for a particular sand interval. The SGR of the fault (F2) increases from sand A (0.44 % - 0.9 %) to sand D (10 % - 44 %). Whereas, the SSF decreases from sand A (0.23 - 1) to sand D (0.05 - 0.22). Therefore, the sealing capacity of the fault (F2) increases from sand A to sand D and can be designated as poor to moderate seal for the hydrocarbons.

