


 nueva página del texto (beta)
 Inglés (pdf)
 Artículo en XML
 Referencias del artículo
 Enviar artículo por email
 Citado por SciELO
  Similares en
SciELO
Similares en
SciELO 
 Permalink
Introduction
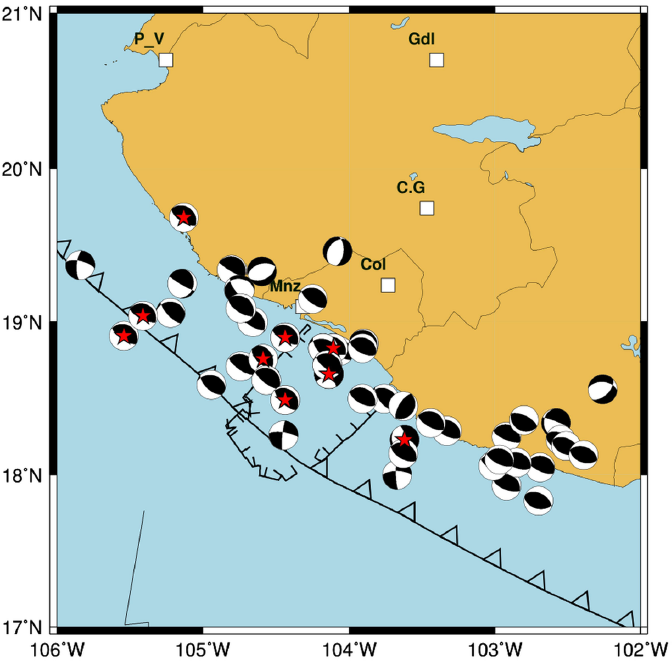
The Mexican west region is tectonically complex. The oceanic Rivera and Cocos plates subduct beneath Mexico, which is part of the continental North American plate (Figure 1). Earthquakes of different sizes have occurred in this triple junction zone, some of them WITH magnitudes THEN eight (e.g. the 1932 earthquake, Mw=8.2, occurred about 90 km to the northeast (Singh et al., 1985), the 1995 earthquake, Mw=8.0, occurred in front of the Colima-Jalisco frontier (Pacheco and Sykes, 1992). The most recent great earthquake, the 2003 earthquake (Mw=7.5), occurred about 140 km from Colima city. Twenty nine people were reported dead and more than ten thousand houses were damaged, (IGF seismic report; 2003, Quintanar et al., 2010).

Figure 1 Tectonic frame: Analyzed earthquakes (stars) and stations (triangles) used in this study. White squares indicate cities. Last two letters of SSN stations are IG.
There have been many seismic studies in the area mainly devoted to study seismic source and spatial slip distribution along the fault plane (Yagi et al., 2003; Quintanar et al., 2010; among others) of great earthquakes. More recently Yamamoto and Jimenez (2015) analyzed a seismic sequence occurred during 2006 in a lapse time of 25 days in in the area. They obtained focal mechanisms. They observed that orientations and type of the fault planes obtained were consistent with regional faults: normal faulting within the El Gordo and Colima grabens and inverse faulting out of them but within the subduction zone.
A source parameters analysis of moderate (4.9<M<5.5) earthquakes occurred in the zone from 2005 to 2009 was performed. Some of them occurred within the Gordo graben. Focal mechanisms were estimated by time-domain inversion of the seismic moment tensor (Dreger, 2000). Waveforms from stations of Colima seismic network (RESCO) were used and, in order to reduce the gap, data from the Mexican Seismological Service (SSN) network was acquired for some events. The analyzed events are shown in Figure 1.
The state of stress of the area was evaluated using the axes of the principal stresses and focal mechanism solution of events with magnitudes greater than 5 and depths less than 30 km occurred in the area since 1981, as reported by The Global Centroid Moment Tensor (CMT project). This area is of particular interest since it is located within the boundary of Cocos and Rivera plates whose nature has been currently debated.
Data
Records from broadband stations of the RESCO network were used consisting of a Guralp CMG-40TD system and records at 100 sps. SSN stations consist of a STS-2 sensor coupled with a Quanterra recorder. Recording rate was variable. Some of them record at a rate of 80 sps and some at a rate of 100 sps. An example of records from some stations of both networks is shown in Figure 2. All available records (RESCO and SSN stations) were included for relocation.
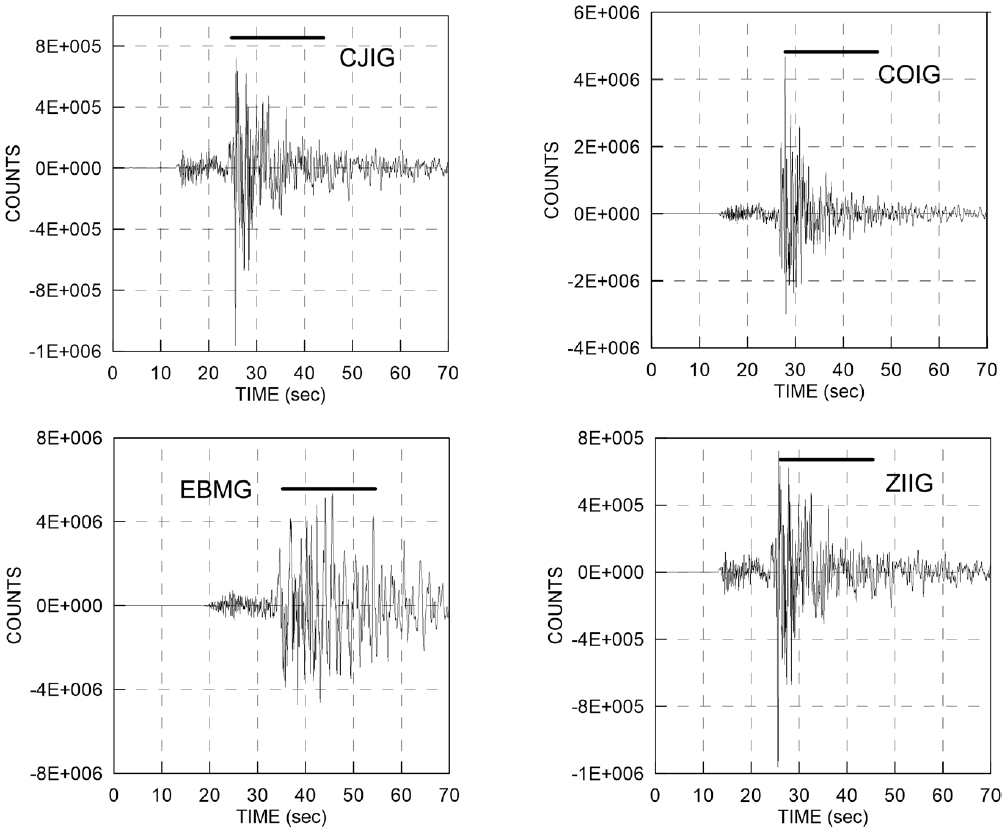
Figure 2 Wave forms of horizontal components at four stations (CIJ, COIG, EBMG and ZIIG,) used to compute the source parameters of February, 2005, earthquake. The horizontal solid line shows the time window used in the computations.
The events using arrival times of P and S-waves were relocated. Including RESCO stations in the location provided same azimuthal coverage but improved with regional stations. The velocity model estimated by Gardine (2010) was used obtained from tomographic inversion of arrival times of regional events to 70 seismic stations distributed along Jalisco, Colima and Michoacán states during two years (MARS and CODEX NSF projects). The model consists of 14 layers with constant thickness (Table 1).
Table 1 Velocity model (1D) Gardine (2010) used in the process to obtain location, and Green's functions estimation in tensor moment inversion.
| Thick Km |
Vp Km/s |
Vs Km/s |
Density gr/cm3 |
|---|---|---|---|
| 3.000 | 5.3 | 3.04 | 2.6 |
| 3.000 | 5.60 | 3.21 | 2.80 |
| 3.000 | 5.90 | 3.39 | 3.00 |
| 3.000 | 6.10 | 3.50 | 3.20 |
| 3.000 | 6.40 | 3.67 | 3.40 |
| 3.000 | 6.70 | 3.85 | 3.60 |
| 3.000 | 7.10 | 4.08 | 4.00 |
| 3.000 | 7.20 | 4.13 | 4.20 |
| 3.000 | 7.30 | 4.19 | 4.40 |
| 3.000 | 7.40 | 4.25 | 4.60 |
| 6.000 | 7.50 | 4.31 | 4.80 |
| 6.000 | 7.70 | 4.42 | 5.00 |
| 15.000 | 8.10 | 4.65 | 5.20 |
| 50.000 | 8.30 | 4.71 | 5.40 |
HYPOCENTER code of Lienert et al. (1988), and Lienert and Havskov (1995). The average in epicentral uncertainties was of ± 6 km in longitude and ± 10 km in latitude and ± 6 km in depth. These uncertainties are due to the poor azimuthal coverage caused by the fact that the epicenter is in the sea while stations are located inland. Location of events are shown in Table 2.
Table 2 Hypocentral locations.
| Date | Origin time | Latitude N | Longitude W | Depth |
|---|---|---|---|---|
| 20050228 | 01:05:59 | 18.76 | -104.59 | 18.00 |
| 20060731 | 18:25:20 | 18.83 | -104.11 | 20.00 |
| 20060813 | 15:14:26 | 18.23 | -103.62 | 23.00 |
| 20061119 | 06:59:08 | 18.49 | -104.44 | 30.00 |
| 20070531 | 10:11:11 | 18.66 | -104.14 | 20.00 |
| 20070906 | 03:42:42 | 19.68 | -105.13 | 30.00 |
| 20081022 | 08:51:26 | 18.90 | -104.44 | 25.00 |
| 20091208 | 18:23:59 | 18.91 | -105.54 | 12.00 |
| 20091212 | 17:05:16 | 19.04 | -105.41 | 10.00 |
Source parameters.
Knowledge of source mechanisms and source parameters of local and regional earthquakes can help to better understand recent tectonic processes in this tectonic zone. One method for estimating earthquake source parameters is the spectral analysis of observed waveforms. A general source model of the displacement spectra of both P and S waves (Abercrombie 1995) is:
where Ω0 is the long period amplitude, f is the frequency, f c is the corner frequency, n the high frequency fall-off rate, γ is a constant, t is the traveltime, and Q a frequency independent quality factor. In this study the point-source model proposed by Brune (1970) was used, which corresponds to the so called "omega square" model (i.e. n = 1 and γ = 2), this is a modified model ofequation (1). Following Drouet et al. (2011), the idealized displacement body wave spectra can be characterized by a flat part at lower frequencies and a fall-off above a corner frequency given by
Where M0i is the seismic moment, and f c the corner frequency for some event i.
The dynamic source parameters such as, source radius, seismic moment stress drop and relative displacement can be estimated from the amplitude of the flat part and from the corner frequency in the case of both P- and S-wave spectrum. The spectral analysis for the estimation of source parameters of some moderate and strong earthquakes in this zone has been widely used by many authors (Yagi et al., 2003; Quintanar et al., 2010 among others).
First step for analysis was to homogenize all records to 80 sps. For each event, records with the best signal to noise ratio were selected. Observed records were corrected by instrument response. Physical parameters were assumed to be: density, 2.7 gr/cm2 , shear-wave velocity, 3.4 km/sec2 , free surface amplification factor, 2, Radiation pattern, 0.6 (RMS average of the shear displacement radiation pattern over all the focal sphere, Boore and Boatwright, 1984). Anelastic attenuation Q was assumed to be frequency dependent with Q 0 and a to be 100 and 0.52 respectively (taken from a regional study of attenuation, Dominguez et al., 2003).
From the spectral analysis of recorded signals at stations CJIG, COIG, ZIIG, MOIG, EBMG and R15B using and Keyllis-Borok's theory (Keyllis-Borok, 1959) and Brune's model (Brune, 1970), seismic moment (Mo), average displacement (Ū), time (T), source dimension (r) and stress drop (σ) were estimated. Displacement spectra for windows of 20 seconds for the horizontal components, where it was assumed to contain the most energetic part of SH waves were estimated. An example of the selected window for records from the 2005 earthquake is shown in Figure 2.
Figure 3 shows the SH-wave spectra for stations COIG, CJIG, EBMG and ZIIG respectively for the 2005 earthquake. The theoretical spectra is also shown using Brune's model (Brune, 1970). The same procedure was performed with all events on Table 2.
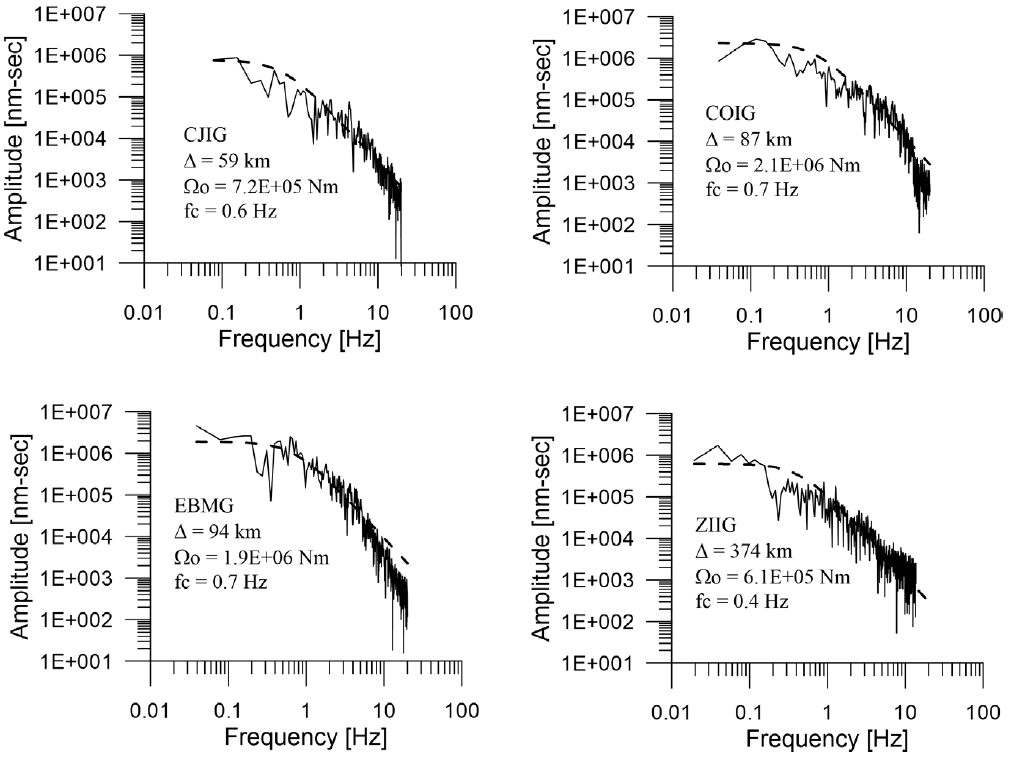
Figure 3 Displacement spectra of the 2005 earthquake for the four stations and the time window shown on Figure 2. Dotted line: theoretical spectra.
An average of source parameters is shown in Table 3.
Table 3 Source parameters of earthquakes 4.9<M<5.5 for the area of study. Mw: Moment Magnitude, Mo: seismic moment, r: source radius, ū: average displacement, Δσ: stress drop, T: source time.
| event | r (km) | Mo(Nw-m) | Ū (m) | Δσ (Bar) | Mw | T (sec) |
|---|---|---|---|---|---|---|
| +20050228 | 1.73±0.13 | 1.52E+17 | 0.48±0.07 | 125±12.11 | 5.4 | 1.35±0.10 |
| +20060731 | 1.45±0.05 | 3.28E+16 | 0.15±0.04 | 48.0±15.30 | 4.9 | 1.08±0.05 |
| +20060813 | 1.32±0.15 | 7.84E+16 | 0.42±0.08 | 144.3±21.9 | 5.2 | 1.02±0.12 |
| +20061119 | 1.71±0.38 | 4.60E+16 | 0.13±0.03 | 36.70±10.0 | 5.0 | 1.27±0.38 |
| +20070531 | 1.51±0.29 | 1.11E+17 | 0.432±.21 | 126.01±24.4 | 5.3 | 1.12±0.21 |
| 20070906 | 1.58 ±0.28 | 1.10E+17 | 0.425±.24 | 125.83±41.44 | 5.3 | 1.15±0.25 |
| 20081022 | 1.34±0.13 | 7.65E+16 | 0.39±0.13 | 132.98±11.6 | 5.2 | 1.00±0.17 |
| 20091208 | 1.69±0.12 | 1.53E+17 | 0.49±0.21 | 127.74±43.9 | 5.4 | 1.28±0.08 |
| 20091212 | 1.77±0.24 | 1.89E+17 | 0.55±0.12 | 140.09±14.10 | 5.5 | 1.32 ±0.94 |
+ inverted events with Dreger (2003).
Seismic moment tensor Inversion
A moment tensor inversion was performed in order to retrieve the focal mechanism and seismic moment using the four available broadband seismic stations. The velocity model described by Gardine (2010) (Table 1), and the seismic moment tensor inverse software (Dreger, 2003) were used. A complete waveform inversion of displacement record was performed assuming a point source. This assumption can be considered valid for events at regional distances with magnitudes M<7 and periods between 10 and 20 seconds (Fukuyama and Dreger 2000). Green functions were obtained with Saikia (1994) algorithm using frequency-wavenumber integration. In this software package, it is assumed that the event location is represented by the high frequency hypocentral location, and a low frequency centroid location is not determined.
The seismic records of the three components from the four stations mentioned above were used. Epicentral distances are between 94 and 354 km. Horizontal channels were rotated in order to obtain radial and tangential components. Signals were instrument-corrected and filtered between 0.02 to 0.05 Hz as suggested by Dreger et al. (2000) for these magnitudes in order to maintain low period signal.
The iterative inversion process was conducted by varying the focal depth. The quality of the result is given in terms of variance reduction (VR); a quality factor has been assigned by Dreger as 4 for VR>80 which occurs when working with high precision data. Quality of the inversions resulted in 3.
Figure 4 shows variance reduction vs depth for the 2005 event. The maximum reduced variance was found at h = 18.0 km for that event in contrast with that of 10 km obtained when locating the earthquake with HYPOCENTER. All events were inverted in the same way.
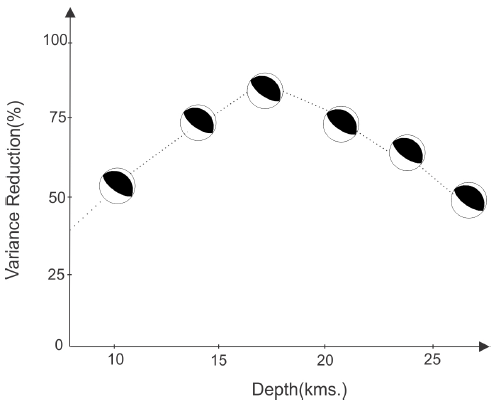
Figure 5 shows the best solution obtained for five of the eleven earthquakes. Observed (black) and synthetic signals (red) are showed for tangential, radial and vertical components.

Figure 5 Observed (black) and synthetic (red) seismograms result of the inversion process of the seismic moment tensor for three events of the area of study. The results of the inversion process as well as the focal mechanism are included. Table 4 shows focal mechanisms of the same events inverted in this study but reported by CMT Project for comparison.
Table 4 Focal mechanism reported by CMT Project. First plane.
| Earthquake | Strike (deg) |
Dip (deg) |
Rake (deg) |
|---|---|---|---|
| 20050228 | 114 | 72 | 83 |
| 20060731 | 115 | 62 | 87 |
| 20060813 | 211 | 67 | 87 |
| 20061119 | 305 | 23 | 82 |
| 20070531 | 239 | 86 | -11 |
The results agree with those reported by CMT project except for the 20060813 event. Differences are to be expected since CMT project solutions are usually obtained with teleseismic data and the present one is obtained with nearfield data. Local data are expeded to give in most cases, more precise results than teleseismic data. Using P-wave polarities Yamamoto and Jiménez (2013) obtained similar fault plane solutions for events 20060731 and 20060813.
Seismic moment obtained by tensor inversion (and so magnitude estimation) was slightly greater than that obtained by Brune's theory but both methods agree quite well.
Figure 6 show the focal mechanisms of all the events in Table 2 and those reported by CMT project for the past thirty years. Mechanisms of almost all of them are in agreement with the tectonics of a subduction zone. However, some strike-slip type and even normal mechanisms require other explanation. According to Astiz and Kanamori (1986), events like the 20060813 event (normal type), occur where the trench axis bends sharply, causing extensional or compressional intraplate stress. As this tectonic area is located within, a triple junction which generates complicated interactions between these plates, it is more likely that the 20060813 event to be due to the interaction between plates.
State of stress in the region from historical seismic activity
Moderate to big seismic events are common in this region. At least 60 earthquakes with magnitudes M W between 5 and 6 and more than 80 with magnitudes greater than 4.8 have been located within a radius of 100 km from Colima coast during the last 30 years. Figure 7a shows axes of the principal stresses of events on Table 2 and those reported by CMT project for magnitudes 4.9<Mw<5.5 and depths less than 30 km occurred in the area since 1978.
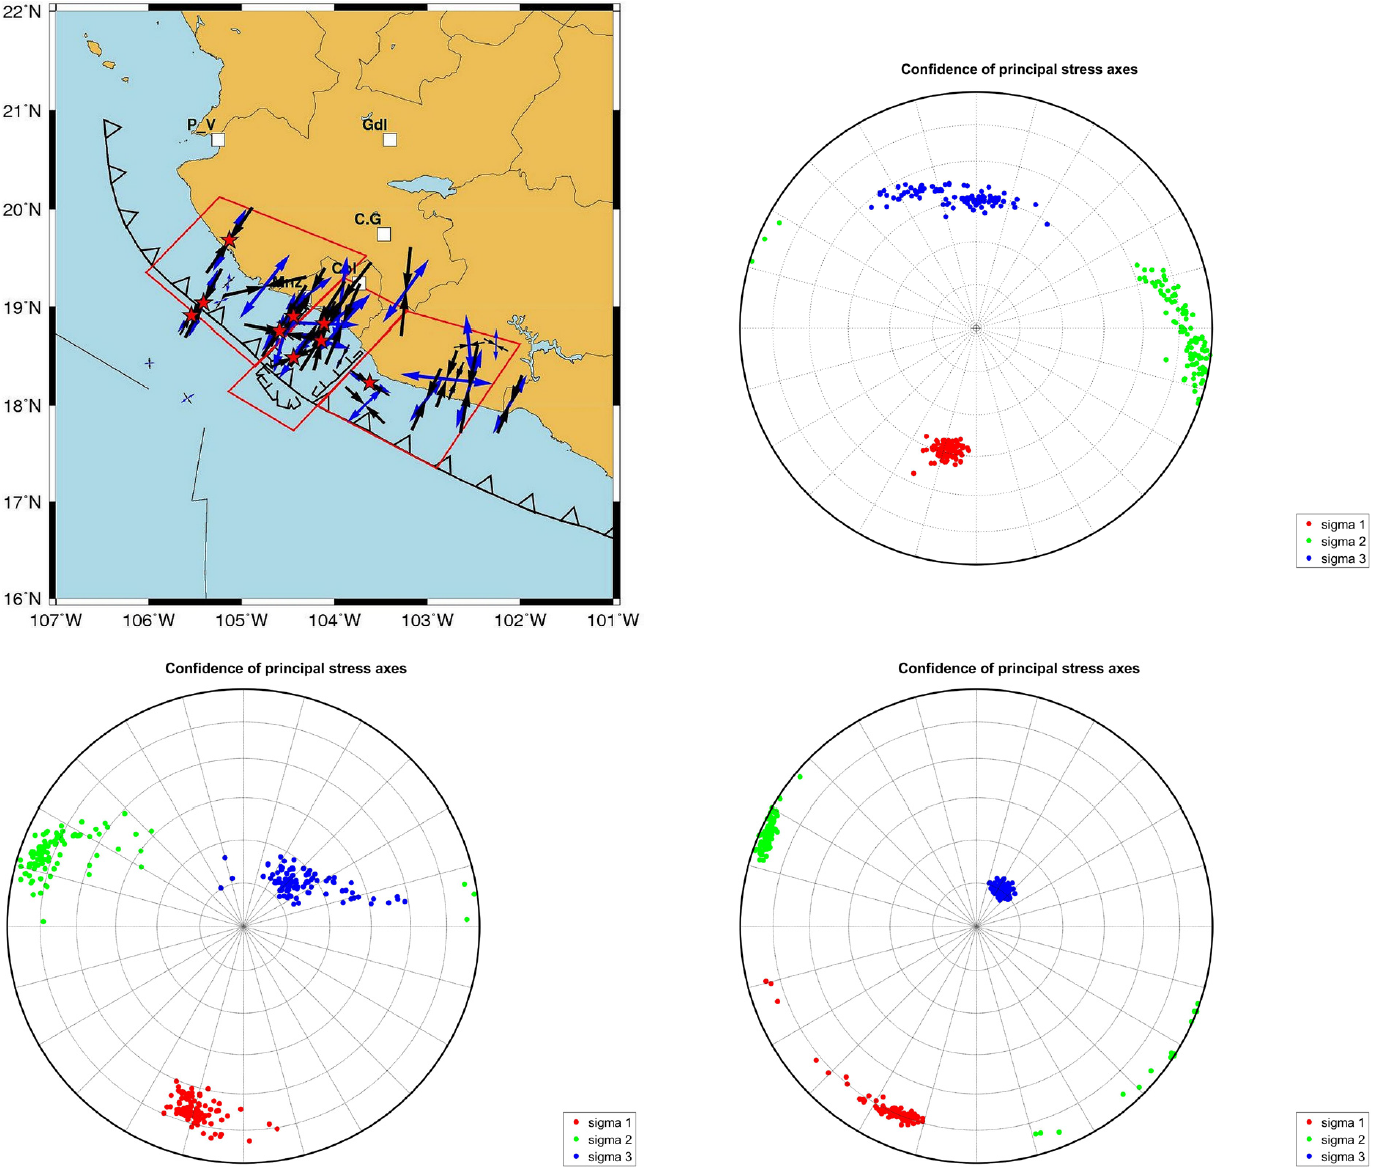
Figure 7 a) Axes of the principal stresses of events reported by CMT project occurred in the area since 1978. Black (P axes) and blue (T axes) arrows, b) to d) stress inversion results for the three sub-regions. Principal stress axes with their 95% confidence limits are plotted on lower hemisphere stereonets.
It can observed that almost but not all of them all events have the same axis orientation: NW-SE for tension axis and NE-SW for compression axis in agreement with a subduction zone.
A stress analysis was performed using focal mechanism solution of events with magnitudes greater than 5 and depths less than 30 km occurred in the area since 1981, as reported by CMT project . The study was divided area in three distinct morphologic sub-regions. Sub-region 2 is the zone within El Gordo graben, sub-regions 1 and 3 are both sides, northwest and southeast of this graben respectively. Stress tensors were obtained for the three sub-regions using a linear least-square inversion algorithm developed by Michael (1984, 1987). It uses the statistical method of bootstrap resampling for determining the orientation of three principle axes and stress magnitude by finding the best fitting stress tensor to the observed focal mechanisms. The inversion results are shown in Figures 7b to 7d.
Sub-region 2, El Gordo graben, is predominantly characterized by inverse focal mechanism solutions but also a few strike slip solutions (e.g. 20070531 event). σ1 is oriented sub-horizontal in SSE-NNW direction, σ3 trending in SW-NE direction with plunge of 68 o and σ2 trends in WSW-ENE direction with a plunge of 19 o.
Sub-region 1 is also dominated by inverse focal mechanism solutions but also a few strike slip solutions and even normal faults. σ1 is oriented in SW-NE direction with plunge of 40 o, σ3 trending in SSE-NNW direction with plunge of 40 o and σ2 trends in SE-NW direction with a plunge of 21 o.
Sub-region 3 is also dominated by inverse focal mechanism solutions but also a few strike slip solutions. σ1 is oriented in WSW-ENE direction with plunge of 11o, σ3 trending in NE-SW direction with plunge of 70 o and σ2 trends in WNW-ESE direction with a plunge of 15 o.
Values from the three sub-regions indicate a compressive stress regime, which is characteristic of a subduction zone. It is interesting however, that plunge of σ1 goes from a moderate angle in the northwest to sub-horizontal in the southeast. The existence of normal and strike-slip mechanisms is also interesting in a subduction zone.
Inland, extensional stresses are dominant, so the normal mechanisms found.
Discussion and conclusions
Using records from RESCO seismic stations along with records from SSN seismic network 11 earthquakes between 2005 and 2009 were relocated with magnitudes between 4.9 and 5.5.
Source parameters: estimated were source dimension, seismic moment, stress drop, average displacement and source time. Seismic moment obtained from moment tensor inversion is slightly greater than that obtained by spectral theory and focal depths are greater than those obtained using HYPOCENTER code to locate the event. Most of the obtained and reported mechanism solutions in this study are in agreement with the tectonics of the area of study: reverse faults for the subduction zone and strike slip for the events off that zone.
There are however, some mechanisms, which reflect the complexity of the area.
Yamamoto and Jimenez (2015) also obtained a normal fault mechanism for the 200608 event and attributed their estimation to a manifestation of the Gordo graben rather than to subduction. It is possible that some events (ie. 200608, 200705 or 20070531) which occur in the region are not related to the subduction but to the relative movement between these two plates.
From stress inversion, values which indicate a compressive stress regime were obtained, characteristic of a subduction zone. It is interesting however, that plunge of σ1 goes from a moderate angle in the northwest to sub-horizontal in the southeast. The existence of normal and strike-slip mechanisms is also interesting in a subduction zone.
In this region, the oceanic Rivera and Cocos plates subduct below Mexico which forms part of the large North American plate. Both plates have been imaged but only for depths greater than 150 km (Yang et al., 2009) so the boundary between them for shallow depths, as well as the relative convergence speed between them and North American plate, remains controversial. The exact boundary between both plates is uncertain although is likely associated with the El Gordo Graben (Bandy et al., 1995, Yang et al., 2009). Bandy et al. (1995) suggest that the subducted Rivera-Cocos boundary lies directly beneath the Southern Colima Rift (SCR) and is parallel to it. According to Kostoglodov and Bandy (1995), near the SCR, the relative convergence speed of both of them is roughly equal and about 5 cm/yr. Spica et al. (2014) found two low velocity zones at different depths southeast and northwest of Manzanillo bay, attributed to the uppermost layers of Rivera and Cocos plates.
Sub-regions 1 and 2 are within the Rivera-Cocos Plate Boundary (RCPB). The two plates are the result of the fragmentation of a proto Cocos plate as a response of the collision of the East Pacific Rise (EPR) with the Middle American Trench (MAT). The different responses of the different parts of the proto plate resulted in a zone of extensional deformation, which remains to the present days (Menard, 1978; Bandy, 1992; Londsdale, 1991).
Broadband Seismic Networks such as SSN and RESCO provide good quality data allowing seismologists to conduct seismic studies in order to better understand the tectonic behavior and the stress distribution of the country. However, the spatial gap and the distances between stations and epicenters still represent a constraint on more detailed knowledge of the distribution of the lithosphere extensional process of specific areas such as the Colima region.

