


 text new page (beta)
 English (pdf)
 Article in xml format
 Article references
 Send this article by e-mail
 Cited by SciELO
  Similars in
SciELO
Similars in
SciELO 
 Permalink
Introduction
After nearly 70 years of dormancy, Popocatépetl volcano reawakened on December 21 1994 with an activity predominantly consisting of dacitic lava dome-forming episodes and their subsequent destruction by vulcanian explosions. This lava dome eruption is still ongoing and there is no certainty on the way in which it may evolve in the future.
The assessment of the hazard related to such activity at the light of the available information may help to reduce the vulnerability through the preparation and set up of a series of specifically designed measures (such as mitigation and evacuation plans) for the most probable eruption scenario (De la Cruz-Reyna and Tilling 2008).
However, assessing hazard is a complex task requiring a broad understanding of the patterns of occurrence of the different volcanic manifestations. In the ongoing eruption, the intensity of the eruptive activity has been limited to moderately large explosions and exhalations (protracted explosions with extended gas output) producing significantly high eruptive columns with substantial dispersion of ash and volcanic gases into the atmosphere. Such events are not necessarily related to dome destruction explosions, as they often occur during dome growth episodes. In addition to the wind parameters, the dispersion forecasts are strongly dependent on the source term, which describes both the intensity rate of volcanic emissions and their initial vertical distribution in the atmosphere, both controlling the height of the columns.
Here, we address this problem considering volcanic hazard as a measure of the probability that a threatening volcanic event occurs in a specific time interval, and defines, along with the exposure and the vulnerabilities to that manifestation, the volcanic risk. To calculate the volcanic hazard we analyze the statistics of the volcanic manifestations that may have some degree of damaging potential in the current state of Popocatépetl's activity, this is the explosive events generating eruptive columns exceeding 4 km above the volcano summit henceforth referred to as "significant explosions" or "SE". The data were obtained from the daily activity reports of CENAPRED (Centro Nacional de Prevención de Desastres). Among other volcano surveillance devices, CENAPRED maintains a seismic monitoring network and an array of three video cameras surrounding the volcano, transmitting in real time to its monitoring center. The images are included in the website of CENAPRED with photos updated every 60 sec. The surveillance monitors at CENAPRED have graphic scales allowing, weather permitting, quick estimates of the column heights, which are included in the daily reports.
Popocatépetl volcano
Popocatépetl volcano, rising 5454 m.a.s.l and with an 800 x 600 m wide crater is considered one of the high-risk active volcanoes in North America. This quaternary volcano is located in the Trans-Mexican Volcanic Belt, about 70 km southeast of México City and 40 km from the city of Puebla, with more than 80,000 people living in a high-risk area, and nearly one million in intermediate-risk areas (Ramos-Jiménez, 2017, this issue). Over 20 million living within a radius of 100 km around the volcano may be exposed to ash falls associated with a major eruption (De la Cruz-Reyna and Tilling 2008, De la Cruz-Reyna et al., 2017). At least three previous major cones have been destroyed by gravitational failure during the Pleistocene producing massive debris-avalanche deposits covering broad areas to the south (Robin and Boudal 1987; Boudal and Robin 1989; Siebe et al., 1995; Siebe et al., 1997; De la Cruz-Reyna and Siebe 1997; Sosa-Ceballos et al., 2012). The volcano eruptive history includes a wide spectrum of eruption styles, including 9 plinian events in the last 23,000 years (Siebe et al., 1996; Siebe and Macias 2006; Mendoza-Rosas and De la Cruz-Reyna 2008, Siebe et al., 2017) and about 19 eruptions with VEI (Volcanic Explosivity Index, Newhall and Self, 1982) in the range 2 ~ 3 in the last 500 years (De la Cruz-Reyna and Tilling 2008; Mendoza-Rosas and De la Cruz-Reyna 2008; 2009).
Since Popocatépetl volcano reawakened on December of 1994, it has been the focus of volcanologists attention due to its peculiarities, such as a very high passive gas output (Delgado-Granados, et al., 2001; Grutter et al., 2008), and the lengthy lava dome eruption episode so far lasting more than 20 years (De la Cruz-Reyna et al., 2017). In this period, at least 40 distinct lava domes have been emplaced in the crater of Popocatépetl. Gómez-Vázquez et al. (2016) and Mendoza-Rosas et al. (2017) analyzed this process and found that the activity has developed as a succession of five high and low-rate regimes of emplacements and lava production rates, and that the volumes and thicknesses of the emplaced domes are scaled by exponential distributions. However, as discussed below, the succession of SE shows a different pattern of occurrence to that of the dome emplacements, and we therefore analyze it as a separate process.
Eruptive column height database
In this paper we analyze the eruptive activity that has generated columns with heights ≥4 km above the volcano summit (SE) for the period 1997 - 2016 using the eruptive column data from CENAPRED
(http://www.cenapred.gob.mx/reportesVolcan/BuscarReportesVolcan?optBusqueda=1), and from Martin-Del Pozzo et al. (2008), and Martin-Del Pozzo (2012). That period was chosen to ensure the reliability and completeness of the record, since the column height-calibrated video monitoring system of CENAPRED has been fully operative since 1997 and most of the columns higher than 4 km above the volcano summit could be seen above the cloud layer unlike smaller columns.
We counted 64 SE events producing column heights reaching or exceeding 4 km over the Popocatépetl summit from June 1997 to November 2016 (Figure 1). The highest columns exceeding 7 km above the volcano summit (about 13 km above sea level) occurred on 30 Jun 1997, 29 Nov 1998 and 22 Jan 2001 (local times).
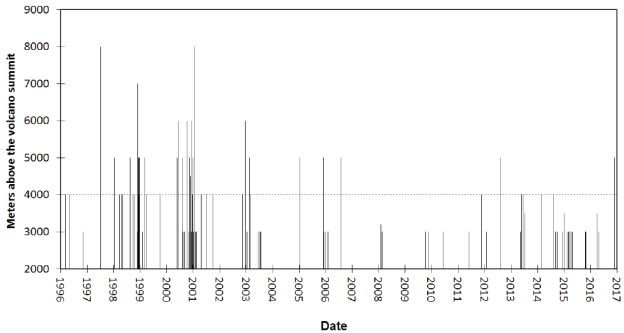
Figure 1 Plot of 138 eruptive events producing columns exceeding 3000 m above the volcano summit since 1996. Data from CENAPRED (website), Martin-Del Pozzo et al. (2008) and Martin-Del Pozzo (2012). About 47% of these emissions reached or exceeded 4 km above the summit (dashed line level). Although the 3 km exceedance series may be incomplete, as smaller columns are frequently hidden by meteorological clouds, the 4 km of higher series (SE) is probably complete. The volcano is 5454 m high.
Figure 2 shows the cumulative number of SE events. The grey and white areas in the figure mark the five high and low regimes of dome emplacement and long-term magma production rates described in Gómez-Vazquez et al. (2016) and Mendoza-Rosas et al. (2017). Inspection of the figure reveals an irregular stepwise behavior of the higher eruptive column occurrences, with high rates and drastic slope changes around 1998, 2000-2001, 2003 (marked with red vertical lines). These changes occur near, but not coincident with, the first three regime transitions of the dome emplacement rates.
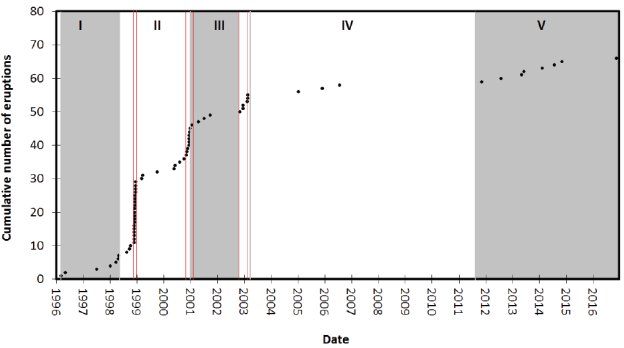
Figure 2 Cumulative number of SE at Popocatépetl volcano producing columns of 4 km or more above the volcano summit. The red lines mark the evident transitions between occurrence rates of those explosions. The gray (high rate) and white (low rate) areas (Roman numerals) represent the alternated regimes of lava dome emplacements and mean lava extrusion rates described in Gómez-Vázquez et al. (2016) and Mendoza-Rosas et al. (2017).
The transitions between dome emplacement rates marked as regimes IV and V in Gómez-Vázquez et al. (2016) and Mendoza-Rosas et al. (2017) are not reflected in the cumulative number of major eruptive columns, and only a significant reduction of the rate of events is observed after July 2003 (Álvarez-Ramírez et al., 2009). This indicates that the processes controlling the larger explosions involves additional factors than those controlling the lava dome emplacements, and may thus have a different statistical behavior.
Features of the significant explosion sequence
We first test the whole data of eruptive columns ≥ 4 km above the summit for independence and stationarity. To test for independence we calculated the autocorrelation function (ACF) of the time intervals between successive eruptive column occurrences. Figure 3 shows that there is no significant correlation between one time interval and the next (one-lag serial correlation is only 0.204). However, at some larger lags, the ACF exceeds the 5% Kolmogorov-Smirnov (K-S) significance level (0.244) needed to reject independence, suggesting some long-term effects as in Lag 3 and 7 with 0.27 and 0.26 correlation values respectively may reveal some shrouded dependence effects.
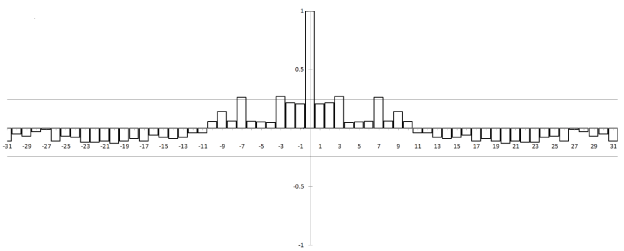
Figure 3 Autocorrelation function of the successive time intervals between eruptive events with eruptive columns ≥ 4 km above the summit from 1997 to 2016. The horizontal thin solid lines represent the 5% significance level Kolmogorov - Smirnov values needed to reject independence.
We then tested the stationarity of the sequence performing a 3-points moving average test (Klein 1982; De la Cruz-Reyna 1996; Mendoza-Rosas and De la Cruz-Reyna 2008; 2009; 2010). Figure 4 shows the results of the test for the highest eruptive columns sequence. The circles represent averages of three consecutive repose interval (time between major explosions) plotted at the date of explosion ending with the third repose interval marked as a filled circle (Klein, 1982; De la Cruz-Reyna, 1996). The solid horizontal line is the mean of all the repose times; the thin dotted line represents the 95% upper confidence level, and the thick dashed line represents the 90% upper confidence level. In Figure 4 four open circles and one filled circle fall well above both confidence levels revealing the non-stationarity of the process mostly caused by the significantly different eruptive activity rates before and after 2003.
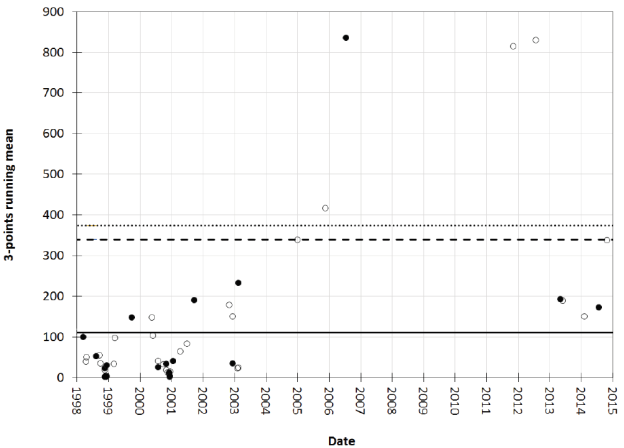
Figure 4 Moving average of three-consecutive reposes of eruptive activity with column heights ≥4km, both in period from 1997 to last eruptive activity in 2016. The solid horizontal line is the mean of all the time periods between events. The dotted line represents the 95% upper confidence level, and the dashed line represents the 90% upper confidence level calculated with the chi-square and the binomial distribution (De la Cruz-Reyna, 1996)
As a further test of the whole period 1997 2016 under an intrinsic hypothesis of weak stationarity, we computed a variogram for multiples of the spacing between the events. The variogram method is commonly applied to spatial geo-statistical analyses as it readily identifies the homogeneity of the increments in the studied stochastic process (Cox and Miller, 1965, Jaquet and Carniel 2001, 2006; Jaquet et al., 2006). In the present case, we obtained an unbounded variogram confirming the non-stationary character of the whole SE sequence. We conclude that the process is non-stationary with a significant change in the occurrence rate around year 2003.
The time-dependence of the process presents an interesting feature. Inspection of Figure 4 reveals that points of the moving average tend to cluster near the horizontal axis (indicating short mean repose times and thus higher rates of SE near the time at which the largest explosions were recorded). This suggests that the rate at which the volcano releases thermal energy (closely related to the eruptive column height) is partitioned between a higher rate of explosions and an increase in the power of explosions. This issue and its consequences on the hazard assessment are addressed in the discussion and conclusions section.
Statistical analysis
To deal with the relatively high autocorrelation values at lags 3 and 7 (Figure 3), and to fulfill a condition of independence, we perform the statistical analysis separately for two different periods: From Jun 30, 1997 to February, 2003, and from February 2003 to December, 2016. 2003 is the year when significant changes in the rate of dome emplacements and in the rate of significant explosions were reported (Alvarez-Ramirez et al., 2009; Gómez-Vázquez et al., 2016; Mendoza-Rosas et al., 2017). The moving mean analysis (Figure 4) also shows significant changes in those periods. Figures 5 and 6 show the autocorrelation function and the stationarity tests respectively for each of the periods.
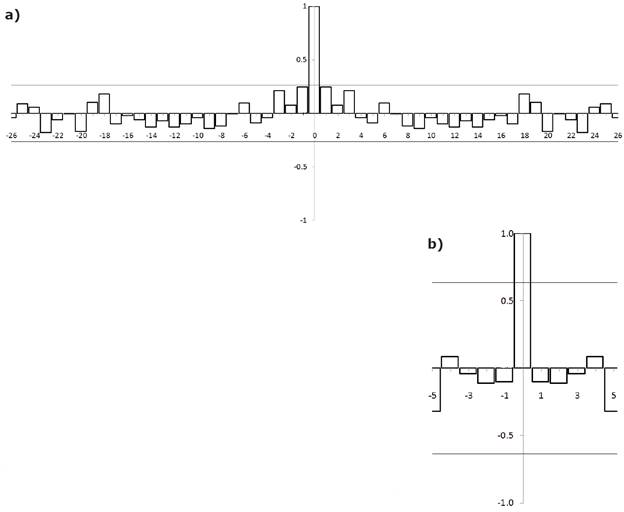
Figure 5 Autocorrelation function of successive time intervals between eruptive events with columns ≥4 km above the summit a) for the period 1997-2003, and b) for the period 2003-2016. The horizontal lines represent the 5% significance level K-S values needed to reject independence
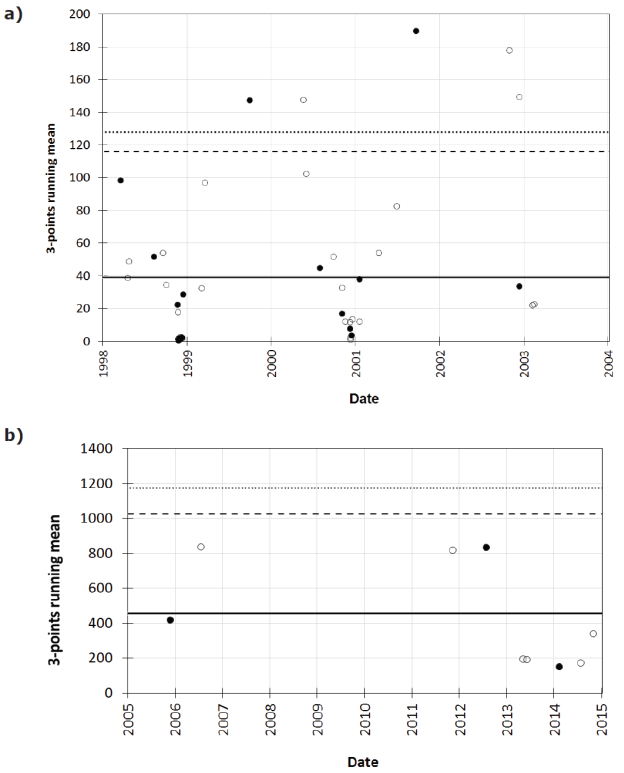
Figure 6 a) Moving averages of three consecutive reposes of eruptive activity with eruptive columns ≥ 4 km above the summit from 1997 to February, 2003, b) the same for the period 2003-2016. Horizontal lines as in Figure 4.
Figures 5 a and b respectively show that the time intervals between significant eruptive column occurrences in the periods 1997 to 2003 and 2003-2016 are uncorrelated and thus independent, as in each case the ACF does not exceed the K-S 5 % level of significance. However, the stationarity tests in Figure 6 show that while the period 2003-2016 is a stationary process, this is not the case for the period 1997-2003, in which several points are well above the confidence levels. We thus proceed to analyze these periods separately, but not without underscoring that the gradual clustering of points near the horizontal axis reveals that the effect of "surges" of higher rates of more powerful explosions occurs in both periods. This suggests that the moving average analysis could be a helpful, simple to use tool to recognize a condition of increased probability of powerful explosions at Popocatépetl, particularly when the amount of data are insufficient for a valid variogram or to perform another type of analysis.
Probabilities of eruptive columns ≥4km above the volcano summit
To assess the hazard, and considering that we have to analyze and compare the results between the stationary and non-stationary periods of time with different characteristics of independence described in the previous section, we obtained occurrence probabilities of events with eruptive columns ≥ 4 km above the summit for the specific time intervals: from 1997 to 2003 and from 2003 to 2016. We tested different probability distributions for the periods: the mixture of exponentials distribution (MOED), the exponential distribution, describing the waiting times between events of a Poisson process, and the Weibull distribution (Mendoza-Rosas and De la Cruz-Reyna 2008; 2009; 2010; Mendoza-Rosas et al. 2017; De la Cruz-Reyna 1991; 1993; 1996; Bebbington 2007; Bebbington and Lai 1996).
The exponential distribution is frequently used in life-testing statistical analysis of events occurring at random in time but in a stationary and memoryless fashion. A random variable X has an exponential distribution if it has a probability density function of the form
If θ = 0 and λ=1 the distribution is called the standard exponential distribution. Its probability density function is
Sometimes the exponential distribution may not adequately describe a process, particularly, when the rate of event occurrences may change with time, as for example in systems with age-dependent failure rates. In such a case, a generalization of the exponential distribution may be used, as for example the Weibull distribution (Eq. 1), often applied in reliability and quality control work (Weibull 1951; Kao 1958, 1959; Franck 1988; Berrettoni 1964) since it may accommodate rate variations through the proper choice of its parameters.
A random variable X has a Weibull distribution if there are values of the parameters c, α, and β such that
has the standard exponential distribution with probability density function
The probability density function of the Weibull random variable X is then
and the cumulative distribution function is
The Weibull survival (or reliability) function is
The Weibull distribution is a power transformation of the exponential distribution, presenting a convenient way to introduce some flexibility to fit a model through the power (or shape) parameter c, thus becoming suitable when the conditions for "strict randomness" needed for the exponential distribution are not fulfilled.
Another generalization of the exponential distribution to describe a process with piece-wise changes in the rate of event occurrences is a generalized mixture of exponentials, defined as the weighted sum of the component distributions
where t is the time between events, and the parameters Λ = (w 1 ,...w m , l 1,...l m) are such
that w
i
>0 for (j =
1,...,m), and
Feldmann and Whitt (1998) showed that any monotone probability distribution function can be approximated by a finite mixture of exponentials. They also showed that a Mixture of Exponentials distribution is especially useful in modeling long-tailed data without some of the mathematical complications of other distributions such as the Pareto (Johnson and Kotz, 1953) and Weibull probability distributions. The Mixture of Exponentials distribution (MOED), also called the hyperexponential distribution, has also been applied (referred to as the Schuhl distribution) to study headway (time between successive vehicles) in traffic flow models (Petigny 1966), to represent some demographic distributions (Susarla and Pathala, 1965) and several other applications (Titterington et al., 1985, Everitt and Hand, 1981, among others).
A mixture of m exponentials cumulative distribution function has the form:
with a survival probability distribution:
and a probability density function:
where λ
f
, w
j
>0 for (j=1,…, m), and
The conditional probability of at least one event occurring within the next t years, and the most recent event occurred s years ago (assuming a duration t in years) is
The MOED is particularly useful to model eruption sequences when the distribution of the eruption rate varies upon translation in a fixed interval (Cox and Lewis, 1966) and develops as a succession of eruptive regimes, each with its own characteristic eruption rate. The MOED has been used successfully in different volcanoes of Mexico that showed piece-wise regimes of activity (Mendoza-Rosas and De la Cruz Reyna 2009; 2010), and to model the time between dome emplacements of the ongoing lava dome eruption of Popocatépetl volcano (Mendoza Rosas et al., 2017). Similarly, Dzierma and Wehrmann (2010) and Wehrmann and Dzierma (2011) have used the MOED to describe the activity of the Chilean Southern Volcanic Zone.
The MOED was chosen for its mathematical simplicity involving a direct description of the different sub-populations or regimes, thus accommodating the non-stationary behavior. Mendoza-Rosas and De la Cruz Reyna (2009; 2010) obtained the parameters λ j . 's as the rates of the single exponential distributions, namely the number of events for the duration of each regime j. In dealing with the applications of the MOED to volcanic processes, the calculation of the weighting factors is very important, since the eruptive regimes often develop as a succession of relatively short high-rate regimes, followed by relatively long low-rate regimes in such a way that the regimes fluctuate around an approximately constant trend. We thus calculate the weighting factors w j 's as the normalized complement of the corresponding proportions of the duration of regimes:
Where D t is the duration of the whole sampled interval, and D i is the duration of each identified regime.
Here, we apply the MOED to the non-stationary eruptive column data for the period 1997 to 2003. The identification of regimes was done in two ways. First by eye, inspecting the cumulative curve for evident slope changes (red lines in Figure 2) and second, using a method based on statistical process control to discriminate between inherent variations of the observed repose times and significant variations that signals a change in the regimes (Ho, 1992) (green lines in Figure 7). Figures 2 and 7 show six distinct regimes divided by red and green lines respectively until 2003; after that the behavior is stationary. Considering the different identification methods of the regimes, we calculated MOED 1 and MOED 2 using the visual selection method (Figure 2) and the Ho method (Figure 7) respectively for the period 1997-2003 (Table 1).
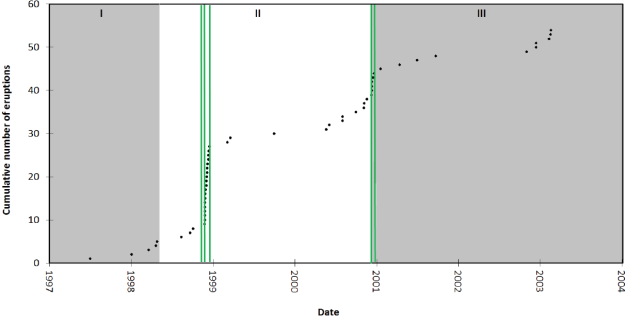
Figure 7 The vertical lines separate the regimes obtained with the statistical process control method developed by Ho (1992) at a 0.05 significance level for the non- stationary period Jun 30, 1997- February 2003. The alternated gray and white areas (Roman numerals) represent the regimes of lava dome emplacements described in Gómez-Vázquez et al. (2016) and Mendoza-Rosas et al. (2017).
Table 1 Parameters of different distributions for the non-stationary period 1997-2003.
| Eruptive columns ≥ 4 km above the summit in period from Jun 30, 1997 to February 2003 | ||||||||
| Weibull | MOED 1 | MOED 2 | ||||||
| Shape 0.59 | Regimes identified "by eye" | Weighting factors (wi) | Monthly rate (λi) | No. events | Regimes identified with the method of Ho (1992) | Weighting factors (wi ) | Monthly rate (λi) | No. events |
| Scale 25.82 | I (30/06/1997 -25/11/1998) | 0.1503 | 0.5259 | 9 | I (30/06/1997 25/11/1998) | 0.1503 | 0.5259 | 9 |
| II (26/11/1998 18/12/1998) | 0.1978 | 24.0564 | 18 | II (26/11/1998 28/11/1998) | 0.1997 | 33.9089 | 3 | |
| III (19/12/1998 03/10/2000) | 0.1365 | 0.3202 | 7 | III (29/11/1998 18/12/1998) | 0.1981 | 22.7352 | 15 | |
| IV (04/10/2000 22/01/2001) | 0.1892 | 2.6998 | 10 | IV (19/12/1998 13/12/2000) | 0.1296 | 0.4954 | 12 | |
| V (23/01/2001 06/11/2002) | 0.1367 | 0.1839 | 4 | V (14/12/2000 24/12/2000) | 0.1989 | 10.6502 | 4 | |
| VI (07/11/2002 23/02/2003) | 0.1894 | 1.3733 | 5 | VI (25/12/2000 23/02/2003) | 0.1234 | 0.3793 | 10 | |
The resulting probabilities of occurrence of at least one eruptive activity generating eruptive columns ≥ 4 km above the summit for both periods are listed in Table 3, and depicted in Figure 8.
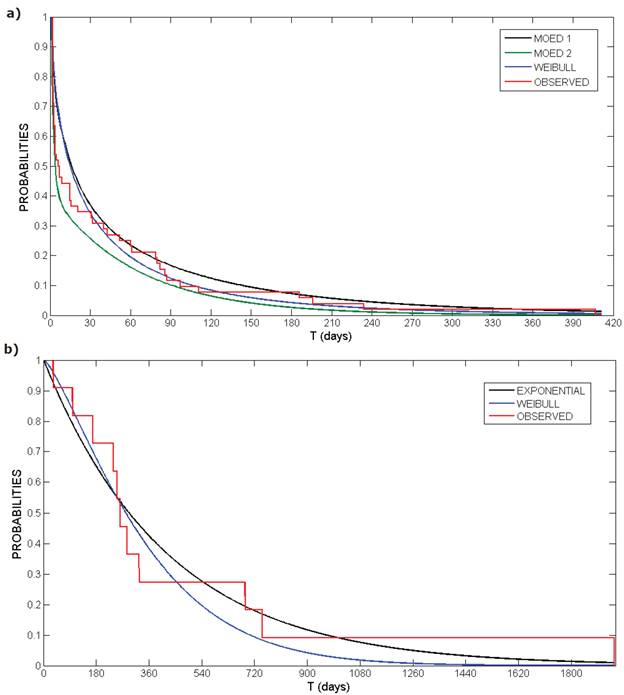
Figure 8 Probabilities of an eruptive activity with column height ≥4km above the summit exceeding an interval of t days calculated with different cumulative distribution functions from a) Jun, 1997 to February, 2003, and b) February, 2003 to the last event of 2016.
Considering that the second period of activity 2003-2016 behaves as a stationary process, we analyzed it using the exponential and the Weibull distributions (Table 2).
Table 2 Parameters of the exponential and Weibull distributions for the period with stationary behavior: 2003-2016.
Table 3 Probabilities of occurrence of at least an eruptive activity with column height ≥4km over the summit over different time intervals (T days). Probabilities were separately calculated for the periods from Jun 1997 to February, 2003 (non-stationary), and February, 2003 to the last event in 2016 (stationary).
| Non-stationary period from Jun 30 , 1997 to February, 2003 | |||
| T (days) | Weibull | MOED 1 | MOED 2 |
| 30 | 0.6649 | 0.6376 | 0.7478 |
| 60 | 0.8082 | 0.7679 | 0.8416 |
| 90 | 0.8777 | 0.8348 | 0.9001 |
| 180 | 0.9581 | 0.9282 | 0.9743 |
| 240 | 0.9769 | 0.9558 | 0.9894 |
| 360 | 0.9917 | 0.9817 | 0.9981 |
| 420 | 0.9948 | 0.9879 | 0.9992 |
| Stationary period from February, 2003 to last eruptive activity in 2016 | |||
| T (days) | Weibull | Exponential | |
| 30 | 0.0372 | 0.0691 | |
| 60 | 0.0892 | 0.1335 | |
| 90 | 0.1465 | 0.1934 | |
| 180 | 0.3234 | 0.3494 | |
| 240 | 0.4334 | 0.4363 | |
| 360 | 0.6184 | 0.5768 | |
| 420 | 0.6920 | 0.6333 | |
| 720 | 0.9071 | 0.8209 | |
| 1440 | 0.9971 | 0.9679 | |
The goodness of fit of the probability distributions and the observed data were evaluated using Kolmogorov-Smirnov tests for both periods, listed in Table 4. For the 1997 -2003 period the goodness of fit results for the MOED 1 and the Weibull distributions are similar. On the other hand, the MOED 2 distribution shows a poorer fit to the observed data indicated by the relatively high values of the K-S statistics.
Table 4 Kolmogorov-Smirnov statistics goodness of fit test for the different statistical distributions over two different periods of time. All distribution fits may be accepted at the 0.05 significance level.
| Eruptive activity with column heights ≥4km in the period 1997 -2003 | ||
| Kolmogorov Smirnov Statistic | Pass K-S test? | |
| MOED 1 | 0.0498 | Yes (≤0.170) |
| MOED 2 | 0.0747 | Yes (≤0.170) |
| Weibull | 0.0351 | Yes (≤0.170) |
| Eruptive activity with column heights ≥4km in the period from 2003 -2016 | ||
| Kolmogorov Smirnov Statistic | Pass K-S Test? | |
| Exponential | 0.2157 | Yes (≤0.410) |
| Weibull | 0.1951 | Yes (≤0.410) |
For the period 2003-2016, the Weibull and the Exponential distributions are equally acceptable to model the process since both pass the fit tests to the 0.05 significance level.
Discussion and conclusions
We analyze the statistical features of the SE with column heights ≥4km of the ongoing lava dome eruption of Popocatépetl volcano for the period 1997-2016. The independence and stationarity tests for the whole series of significant explosions revealed the non-independence and non-stationary character of the sequence of time intervals between events, making it difficult to make a simple statistical description of the process. However, we found that the behavior of the SE sequence changed in 2003. We thus separated it in two periods or stages, both showing independence among the time intervals between events, but with the first period (1997-2003) presenting a non-stationary behavior, while the second period maintained a steady behavior. To describe the sequence of SE, we tested several distributions for each of those stages. For the first non-stationary stage we tried the Weibull distribution and the Mixture-of-Exponentials Distribution (MOED), and for the second stationary stage, the Weibull and the Exponential distributions.
Fitting a MOED distribution requires a careful identification of the type of time dependence (non-stationarity) of the process. In the present case, we found that the time-dependence was characterized by a succession of alternate regimes with high and low rates of event occurrences. To identify the regimes, we first used a direct approach visually inspecting the curve of the cumulative number of explosions for significant slope changes separating high and low rates of occurrences as illustrated in Figure 2, and then a computational method based on statistical process control (Ho, 1992), depicted in Figure 7. The results are compared in Tables 1 and 3.
For the first, non-stationary stage, Weibull and MOED 1 provided the best results in the goodness of fit test, but we prefer MOED 1 since the distribution parameters are easier to calculate and depict a direct representation of physically meaningful features of the process, namely the rates of each of the identified regimes.
For the second, stationary stage, the Weibull and the Exponential distributions yield similar results.
Table 3 and Figure 8 show a marked difference between the probabilities of occurrence of significant explosions for each stage. For comparative purposes we show in Table 5 the ratios of the probabilities calculated for the non-stationary (N-S) and stationary (S) stages for different time intervals.
Table 5 Ratios of the probabilities calculated for the non-stationary (N-S) and stationary (S) stages for different waiting time intervals.
| Days | (N-S stage Weibull)/(S-stage Weibull) | (N-S stage stage MOED1)/(S-stage Exponential) |
| 30 | 17.89 | 9.221 |
| 60 | 9.06 | 5.751 |
| 90 | 5.99 | 4.316 |
| 120 | 4.46 | 3.521 |
| 240 | 2.25 | 2.191 |
| 360 | 1.60 | 1.702 |
| 420 | 1.44 | 1.560 |
During the time of study about 40 domes have been emplaced, but at least 138 moderately large explosions were recorded, either during the growth, or during the dome destruction episodes, with 64 of them exceeding an altitude of about 9.5 km a.s.l. Considering the fact that the highest rates of SE occurred during the relatively low lava dome emplacement rate regimes II and the initial part of IV defined in Gómez-Vazquez et al. (2016), it may be concluded that the lava dome emplacement and the SE sequences appear to be the result of different ways of interaction among some complex processes, mainly the magma ascent and crystallization rates and the intensity of degassing (Gómez-Vazquez et al., 2016; Mendoza-Rosas et al., 2017). Such factors seem to influence SE and lava dome emplacements in different ways, particularly during the SE non-stationary stage 1997-2003. In contrast, the SE stationary stage does not show a significant influence of the lava dome emplacement transitions between regimes IV and V.
Since the nature of the process may change from stationary to non-stationary without a clear or evident physical cause, and the probabilities are quite sensitive to such condition, the assessment of hazards requires a continuous testing of the independence and the stationarity of the ongoing process. The eruptive process apparently continues in a stationary stage, but a transition into a non-stationary stage may increase by an order of magnitude the probability of significant explosions in short time intervals, making it more likely the generation of "significant explosion swarms" as those shown in Figure 4. Since this indicates a much higher rate of thermal energy release, the hazard assessment must carefully evaluate the mass and energy balance of the volcano apparently reached around 2003 (figure 12 in Gómez-Vazquez et al., 2016). This acquires particular relevance for the long-term development plans of the volcano surrounding area, considering that about 20% of the major explosive eruptions worldwide have occurred during andesitic or dacitic lava dome eruptions (Ogburn et al., 2015), and that the log-linear regression model for compositional dependence of the expected duration of ongoing lava dome eruptions of Wolpert et al. (2016), indicates that there is a 40% probability that the ongoing activity of Popocatépetl may last for another 30 to 35 years and 20% probability that it extends for over 100 y.

