1 Introduction
Cosmic rays (galactic and solar) generate particle air showers that are absorbed and attenuated as they travel deeper into the atmosphere. Therefore, mountain detectors are relevant to register high cosmic ray fluxes.
Forbush decreases (FDs) are perhaps the most impressive phenomenon of galactic cosmic rays (GCRs) caused by solar activity. The cosmic ray intensity may have a drastic decrease (up to 20%) in a few hours, however the recovery is slow, lasting typically around seven to ten days. FDs are an extreme manifestations of transient modulation of GCRs, therefore an interesting subject of study to elucidate the mechanisms of solar activity with a recognizable influence in the interplanetary medium. FDs are generally correlated with corotating interaction regions (CIRs), interplanetary shocks or interplanetary coronal mass ejections (ICMEs) originated at the Sun (Subramanian, 2009; Richardson & Cane, 2011; Musalém, 2015).
In most of these cases, an associated plasma is much faster than the normal solar wind (300-800 ms^(-1)) and produces a shock wave, which acts as a magnetic ‘sweeper’ partially impeding the passage of the cosmic radiation to the region behind it. As the shock wave moves away from the point of observation, its influence diminishes. FDs are usually observed by particle detectors on Earth shortly before or after the passage of an ICME, a CIR or a shock; the counting rates fall takes place in the course of less than 24 hours, as a general rule. During the following seven to ten days, the intensity of the cosmic rays slowly returns topredecrease levels, this is known as the recovery period of the FDs.
Recent statistical studies on the relationship between characteristics of solar wind disturbances, ICMEs, CIRs and shocks, with properties of FDs (i.e.: Dumbovic et al., 2011; Musalém, 2015) revealed that not only the increase in magnetic field strength and fluctuations define the amplitudes of the GCR decrease; the length of time the Earth stays inside the solar wind disturbed region is also important; the recovery phase depends on the magnetic field strength and the size of the disturbance. The deepest FDs are always found to be associated with ICMEs accompanied by a magnetic cloud (Richardson & Cane, 2011; Dumbovic et al., 2011). Examining simultaneous observations of FD events by different GCR stations on the Earth’s surface remains a subject of interest. Variability in the manifestations of FDs demonstrates that there are still open questions in this field (Okike & Collier, 2011; Pintér et al., 2011). FDs are observed mainly by neutron monitors (NMs), but also at higher energies of primary GCRs by muon telescopes or other types of detectors (Braun et al., 2009; Abbrescia, et al., 2011; Bertou, 2011; Augusto, et al., 2012; Dasso et al., 2012; Deggeroni, et al., 2013). In this context, the possibility to add the results of a detector of a different design, such as the SNT is a question of interest in the subject.
The plan of the paper is as follows: In section 2 the influence of the atmosphere on cosmic radiation is briefly described, their interaction with air particles and due to meteorological parameters; In section 3 the main characteristics of the Solar Neutron Telescope at Sierra Negra is shown . The set of data employed in this study, together with the methods used are presented in section 4. Section 5 is dedicated to the presentation of the particular data and the results obtained. An interpretation of the results is given in section 6. Finally, in section 7 ar summary and conclusions are given.
2 Influence of the atmosphere on cosmic radiation
2.1 Interaction of primary cosmic rays with the atmosphere
Galactic cosmic rays (GCR) extend over an enormous range of energies, (106 − 1021 eV). These high-energy particles that come from outer space are mainly protons (90% - hydrogen nuclei, helium nuclei 9% and heavier cores 1%). When primary cosmic radiation enters the atmosphere, everything that happens is the result of its collision with air particles. These collisions may be of two types: with the electronic structure of the atom, or with the nucleus. Since the nucleus is so small, the collision with it is less common, but it involves very large energy changes, and these changes determine secondary cosmic rays development.
When a particle of primary cosmic radiation collides with the nucleus of an air molecule, cascades of a large number of secondary particles are produced, mainly pions. The charged pions quickly decay, emitting muons.
Secondary particles are absorbed more easily with the increase in the density of the atmosphere, some of them reach the surface of the Earth, and the most vigorous can penetrate the Earth’s crust.
When a primary cosmic ray hits directly with the nucleus of an atmospheric atom, depending on the energy of the primary particle, the size of the nucleus, etc., a variety of processes can occur. These may be divided into absorption and dispersion processes. In the scattering processes, the elasticity and the total kinetic energy are retained. On the other hand, if the dispersion is inelastic, a fraction of the energy of the incident ray is absorbed by the nucleus, leaving the latter excited. This energy is subsequently issued in the form of γ rays, α particles, and other nuclear collision products.
Due to the large energy of the incident particle, most of the secondary particles that are produced are propagated in the direction of the primary.
There are three possible scenarios (Figure 1) through which the primary particle transfers its energy in its journey to the sea level or down to a level below: the hadronic, the muonic, and the electromagnetic components.
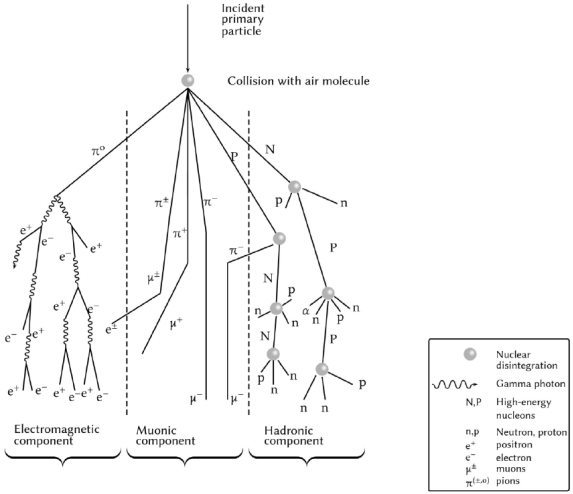
Figure 1 Basic scheme of an air shower. From left to right, the electromagnetic component (soft), muonic and hadronic cascades, are respectively denoted. Symbols ‘p’ and ‘n’ represent protons and neutrons.
Neutrons and protons that result of the disintegration of an atmospheric atom by a primary particle of low energy are those that originate the hadronic component. However, these nucleons, of lower energy as compared with the primary particle, have enough energy to act as if they were primary elements and interact with new atmospheric atoms, generating new showers. When reaching the lower atmospheric layers, the flow of this component decreases rapidly with the atmospheric depth.
2.2 Atmospheric parameters and their influence due to meteorological effects
Although the study of FDs was done using only the charged particle channels, in this section the calculations of the atmospheric correction coefficients for both charged and neutral channels of the SNT-SN are reported.
2.2.1 Barometric effect
Variations in the counting rates in a given time unit, due to the variation of atmospheric pressure are known as the barometric effect. Likewise, there may be variations in the counting rates of a cosmic ray monitor or telescope due to other meteorological factors such as: wind speed, temperature changes in the different seasons of the year, greater or lesser presence of humidity, greater or lesser presence of snow, among others (Dorman, 2004). The behavior of the pressure is inverse to the counting rates of the experiments: in the presence of a lower atmospheric pressure, a greater amount of particles are recorded.
Based in the Dorman’s criteria (2004, p. 352), a general expression for the correction of the counting rates as a function of the variability of the pressure at a certain height is
where P0 - normalization pressure, for the count value N(P0), N(P) - counting rate value at pressure P and β(P) - barometric coefficient, which is used to make pressure corrections to the counting rates in each channel. The barometric coefficient might be approximated as
where η1 and η2 - constant coefficients. If (P-P0) are small ⇒ then
If the variation in pressures is small, then
2.2.2 Wind speed effect
The dynamic pressure is determined by the Bernoulli’s equation Pdyn = ½ ρv2, where
ρ - the air density and v - the wind speed.
The wind speed effect becomes important from v ≥ 10 ms-1 (Dorman, 2004). Barrantes, et al. (2018) established that in the case of the SN station registers this effect can not be verified, since at the SN top, for v≈20 ms-1, the dynamic pressure values represent only the 0.24% of the mean barometric pressure, besides that, the dynamic pressure values lie in the standard deviation range of the mean barometric pressure data.
2.2.3 Relative Humidity effect
According to Dorman (2004), the effect of the relative humidity (RH) may be determinated using the ratio
where βrh= βP+Crh, βP and Crh - barometric and RH coefficients, computed by the linear regression method as the slopes in the corresponding graph of normalised counting rates vs ΔP and ΔRH, respectively. In any case, the presence of water in the air may influence a significant increase in barometric effect, because the humid air mass is denser than dry air, what is observable in the behavior of the barometric pressure for periods of dry and humid seasons (Barrantes, et al., 2018).
2.2.4 Temperature effect
To cross the same amount of matter (in g cm-2) in the atmosphere will be longer with increasing air temperature, but the number of nuclear interactions producing pions will decrease at a certain height (Dorman, 2004). This effect leads to a positive temperature effect for the muon component and to a negative temperature effect for the nucleonic component.
The atmospheric conditions for determining the temperature effect are usually characterized by the following parameters: the air temperature on the ground, the height and air temperature of the level where main muon generation is assumed to take place (usually levels of 100 or 200 mb), the average mass temperature of the atmosphere. Blackett (1938) used two parameters: the height H(hM) and air temperature T(hM) at the muon-generation level hM (about 100-200 mb). Therefore the total regression equation for the temperature component has the form:
where ΔT (hG) is the ground temperature deviation at the hG height and hM≥16 km (De Mendonça, Raulin, Echer, Makhmutov, & Fernandez, 2013). In the present case hG=4580 m asl. The detected CRs intensities that reach the surface of the Earth are influenced by the solar activity and by the structure of the geomagnetic field. In order to avoid this influence and to make a reliable calculation of the values of the atmospheric correction coefficients, two quiet intervals of solar activity: July 22 - August 20, 2004 (NOAA, K-Indexes, 2004) and September 23 - October 20, 2005 (NOAA, K-Indexes, 2005) were chosen. Since the data recorded by the SNT-SN and INAOE-SN stations were only at ground level, equation (6) was simplified as
2.3 Definition of coefficients for different atmospheric parameters
According to Dorman (2004) and based on the results shown in Table 2, the contribution of the atmospheric parameters in the normalized variations of the cosmic ray registers at Sierra Negra are determined by
Where
|
= βPδP - barometric component |
|
= CTδT - temperature component |
|
= CRHδRH - component due to RH |
|
= βWSδWS - component due to WS |
and βP, CT, CRH, βWS are the atmospheric correction coefficients.
Table 1 FDs selected for analysis. Reliability of the registers in SNT-SN is required. The threshold of the NMs are in GV: Oulu 0.81, Moscow 2.41 and Mexico City 8.42.
| FD | Oulu % | Moscow % | Mexico City % |
| 17/06/2011 | 2.8 | 2.5 | 2.3 |
| 05/08/2011 | 5.0 | 4.5 | 2.5 |
| 08/03/2012 | 11 | 9.0 | 7.0 |
| 05/04/2012 | 3.5 | 3.0 | 3.5 |
| 16/06/2012 | 5.0 | 4.0 | 4.0 |
| 14/04/2013 | 5.0 | 4.5 | 4.0 |
Table 2 Mean values of the atmospheric parameters for each of selected periods: Sep 23-Oct 20, 2004 and Jul 22- Aug 20, 2005. Here, Pdyn=½ ρair v2
w, ρair = ρ0(1-
| Period | P (ambar) | Pdyn (mbar) | T (°C) | RH (%) |
| Sep 23 - Oct 20 | 589.98 ± 1.06 | 0.18 ± 0.32 | 3.38 ± 3.19 | 82.78 ± 10.42 |
| Jul 23 - Aug 22 | 591.35 ± 0.90 | 0.25 ± 0.22 | 4.34 ± 4.61 | 67.13 ± 17.66 |
3 Instrumentation
3.1 Solar Neutron Telescope at Sierra Negra
Sierra Negra (SN) is a 4580 m asl inactive volcanic cone formed 460 000 yr ago, located at 18.98º N, 97.46º W, inside the Parque Nacional Pico de Orizaba, Mexico, at about 100 km east from Puebla City. The weather of the site is influenced by the dry climate of the high-altitude central Mexican plateau and humid conditions coming from the Gulf of Mexico (Carrasco, et. al., 2009). The Solar Neutron Telescope at the top of Sierra Negra (SNT-SN) is operating since 2004. A detailed description of the SNT may be found in González-Méndez (2010); the detector has the ability to measure the energy deposited by the incident particles, and their direction of arrival with a precision of 15 degrees. To detect neutrons associated with solar flares at the ground level, it is preferable to locate detectors very close to the Equator, ensuring that the exposure time to the Sun does not change much with yearly seasons and that the charged particle cuotoff required for incident ions is very high, eliminating as much as possible the influence of protons emmited during the same solar event. It is also preferable, to be located as high as possible a.s.l. to reduce the amount of matter which can interact with solar neutrons, increasing the probability of neutrons to be detected. Because they have zero charge, solar neutrons can travel from the Sun to the top of the atmosphere without being affected by any electromagnetic field, with a probability of survival for the neutron,
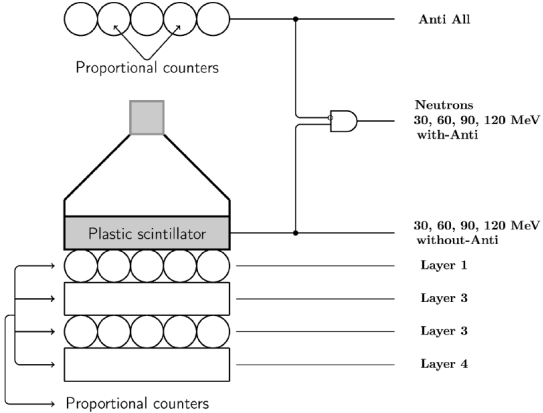
where t is the flight time of a neutron between the Sun and Earth, γ is its corresponding Lorentz factor and τ=(880.2±1.0) s is the neutron mean lifetime (Patrignani & others, 2016). SNTs were installed at different longitudes making a world network that has continuous observations of the Sun. The SNT-SN consists of plastic scintillators (PS) surrounded by proportional counters (PCs). It distinguishes between charged and neutral particles by an electronic anticoincidence system between the signals triggered by PS and PCs.
3.2 Structure and general operation of the Solar Neutron Telescope at Sierra Negra, Puebla
A scheme of the SNT-SN is presented in Figure 2. The detector was built and tested in March 2003 in SN; long operation periods since November 2004 have been possible. The area of each PS is 1 m2, with four of them the total detection area is 4 m2, the thickness of the plastics inside is 30 cm.
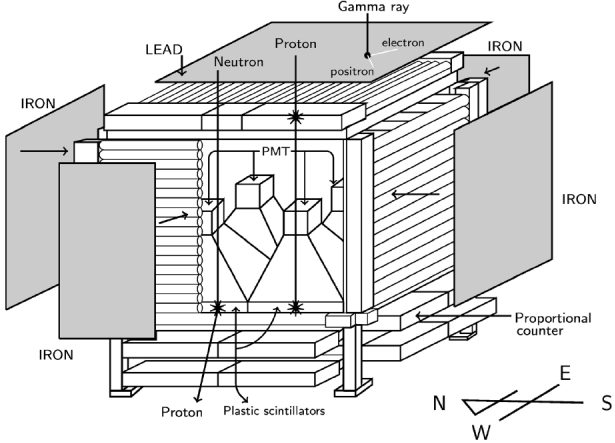
Figure 2 Scheme of the SNT-SN. Anticoincidences between protons and neutrons are shown using the PS and PCs. The dimensions of the SNT-SN are 2m x 2m x 2 m.
The SNT-SN has four energy (E) deposition channels, which correspond to E⩾30MeV, E⩾60 MeV, E⩾90 MeV and E⩾120 MeV. Above the uppermost PCs gondola (Figure 2) a 0.5 cm thick lead plate is placed, where 67% of the incident photons are converted into electron-positron pairs (Valdés-Galicia, et al., 2004). To reduce background radiation from the sides, PCs were protected of the background photons by iron plates of 0.5 cm thickness (González-Méndez, 2010), these four vertical planes iron sheets act as shielding. Most of the incident gamma rays are stopped by the lead, where they produce electron positron pairs; the charged particles (mostly protons) trigger the PCs and the PS, while the neutral particles only trigger the PS. All these events are registered by the system, which records the energy deposited by every particle in PMTs located just above the PS. Thus, the SNT discriminates between charged particles and neutrons based on the electronic anticoincidences between PCs and PS.
The energy deposited by the incident particles is measured with pulse height discriminators, connected to the PMTs which are installed above every PS inside light tight boxes. The height of the pulse is discriminated and recorded in the four different energy deposition channels stated above. The logical scheme of detection of the SNT-SN is shown in Figure 3.
4 Data coverage
In order to determine the correction coefficients due to atmospheric effects data on two periods were used: September 23 - October 20, 2004 and July 23 - August 22, 2005. These periods were selected since they are geomagnetically quiet (NOAA, K-Indexes, 2004, NOAA; K-Indexes, 2005), with a relative low solar activity, near the end of the 23th Solar Cycle (http://www.swpc.noaa.gov/products/solar-cycle-progression, solar activity images A REFERENIAAS). A part of these data consists of atmospheric pressure, temperature, relative humidity (RH) and wind speed, recorded by the INAOE-SN station called Campbell and which has been operational since 2000. The Campbell station consists of temperature and humidity sensors enclosed on a radiation shield, a barometer, an anenometer, a controle console and a data logger. The Campbell station data have a 1 min time resolution. The location of the Campbell station relative to the SNT-SN station is (201,104) m in the NE direction (Barrantes, et al., 2018). The data of atmospheric pressure at the SNT-SN station were also used. The SNT-SN station data on 2004-2005 period have a 1 min resolution. Since a FD is a phenomenon whose evolution is in the order of hours, all atmospheric data were averaged at intervals of 30 minutes, in order to analyze possible variations of the values of the atmospheric parameters in short time intervals, given the time scale of the phenomenon under analysis. To determine the value of the correction coefficients we used the linear regression method of Dorman (2004). There are various interpretations of what is a FD. In general, it is established as a global secondary cosmic radiation event at Earth level, registered by the worldwide network of NMs. Here, a FD is defined as the phenomenon which presents the next two characteristics (Musalém, 2015):
1. Its fall, at least 1.5% of the cosmic radiation flux, normalised to a quite period of three days before the FD. This allows us to discriminate from the diurnal variation (amplitude approx. 0.7%). The interval between onset and minimum point is reached in less than 24 hours.
2. The recovery time is 7 days, on average. It should be noted that the record of a FD will depend, among other factors, on the latitude at which the monitoring station is located: at greater geomagnetic latitude, lower geomagnetic rigidity threshold.
The Neutron Monitor station at UNAM (NMCDMX) (http://cosmicrays.unam.mx), is part of the worldwide network of cosmic ray detectors called Neutron Monitor Database (NMDB) (http://www01.nmdb.eu/nest). It has been operational since 1989. A list of FDs was produced for the period 2007-2013, based on the records of this station and Moscow and Oulu NMs (Musalém, 2015).
Six FD were selected, clearly observed in the S1, S2 and S3 charged particle channels, based on the available SNT-SN data set (see Table 1). These events were selected considering that they were recorded in both, the SNT-SN and the NMCDMX. The quality of the data recorded by the SNT-SN for each FD within the list was verified. Additionally, in order to be sure that the selected events were worldwide, FDs had to be registered by the three monitors of the Musalém (2015) list, as it is clearly evidenced in our case.
In the cases of FDs registered by SNT-SN, the records of charged particles were used, since the GCRs are essentially charged particles. Due to inconsistences in the data registered in the S4 channel for some FDs, data from this channel were not used. SNT-SN station data were averaged in intervals of 60 min., with the purpose of comparing these results with those obtained by the NMCDMX.
Table 8 presents the percentages of the maximum decrease for each selected FD recorded by the SNT-SN and the NMCDMX, whose similarities/differences are discussed in section 5.
Table 3 Values of the correction coefficients due to atmospheric parameters for the records of the INAOE-SN and SNT-SN stations, shown for neutral and charged particles channels. Period Sep 23 - Oct 20, 2004.
| Channel | βp %/ambar | CT %/(°C) | CRH/% |
| S1neutral | -0.173 ± 0.054 | 0.455 ± 0.011 | -0.008 ± 0.006 ** |
| S2neutral | -0.287 ± 0.038 | 0.245 ± 0.010 | 0.002 ± 0.004 * |
| S3neutral | -0.490 ± 0.031 | -0.008 ± 0.012 * | 0.23 ± 0.003 ** |
| S4neutral | -0.406 ± 0.046 | 0.244 ±0.014 | 0.13 ± 0.005 ** |
| S1charged | -0.354 ± 0.013 | -0.029 ± 0.006 | 0.10 ± 0.002 ** |
| S2charged | -0.399 ± 0.020 | -0.114 ± 0.007 | 0.18 ± 0.002 ** |
| S3charged | -0.515 ± 0.023 | -0.138 ± 0.08 | 0.26 ± 0.002 ** |
| S4charged | -0.600 ± 0.026 | -0.148 ± 0.010 | 0.28 ± 0.003 ** |
Table 4 Values of the correction coefficients due to atmospheric parameters for the records of the INAOE-SN and SNT-SN stations, shown for neutral and charged particles channels. Period Jul 22 - Aug 20, 2005.
| Channel | βp %/ambar | CT % / (°C) | CRH / % |
| S1neutral | -0.152 ± 0.095 | 0.587 ± 0.011 | -0.006 ± 0.004 ** |
| S2neutral | -0.337 ± 0.064 | 0.368 ± 0.009 | 0.002 ± 0.003 * |
| S3neutral | -0.536 ± 0.033 | 0.046 ± 0.008 | 0.016 ± 0.002 ** |
| S4neutral | -0.428 ± 0.074 | 0.392 ± 0.011 | 0.009 ± 0.003 *+ |
| S1charged | -0.363 ± 0.013 | -0.023 ± 0.004 | 0.008 ± 0.001 ** |
| S2charged | -0.424 ± 0.022 | -0.098 ± 0.005 | 0.013 ± 0.001 ** |
| S3charged | -0.544 ± 0.027 | -0.122 ± 0.006 | 0.018 ± 0.001 ** |
| S4charged | -0.622 ± 0.029 | -0.124 ± 0.006 | 0.020 ± 0.001 ** |
Table 5 Correction coefficients by atmospheric parameters for the channels S1, S2 and S3 for charged particles and the respective global average, for the periods of September 23-October 20, 2004 and July 22-August 20, 2005. As shown in equation (10), βtotal = βP + βT.
| 2004 | 2005 | |||||
| Channel | S1 | S2 | S3 | S1 | S2 | S3 |
| CT % / °C | 0.029 | 0.114 | 0.138 | 0.023 | 0.098 | 0.122 |
| βT % / mbar | 0.018 | 0.072 | 0.087 | 0.027 | 0.117 | 0.145 |
| βP % / mbar | 0.354 | 0.399 | 0.515 | 0.363 | 0.424 | 0.544 |
| βtotal % / mbar | 0.372 | 0.471 | 0.602 | 0.390 | 0.541 | 0.689 |
| Channel | S1 | S2 | S3 | |||
| βtotal % / mbar | 0.381 ± 0.030 | 0.506 ± 0.064 | 0.646 ± 0.078 |
Table 6 Relative variations in the percentage values for the FDs fall analyzed, corresponding to the data corrected by pressure and by temperature and pressure, where ff3 =
| FD | ffPP (%) | ffPT (%) | ff3 |
| 17/06/2001 | 2.12 | 2.25 | 0.06 |
| 05/08/2011 | 1.16 | 1.17 | 0.01 |
| 08/03/2012 | 5.42 | 5.56 | 0.03 |
| 05/04/2012 | 1.91 | 1.78 | -0.07 |
| 16/06/2012 | 2.59 | 2.55 | -0.02 |
| 14/04/2013 | 2.90 | 3.09 | 0.07 |
Table 7 Values of the percentages for the FDs fall analyzed and the corresponding proportion of the amplitude of the diurnal variation (ADV). The values in parentheses represent the proportion
| FD | ADV (%) | S1 | S2 | S3 |
| 17/06/2011 | 1.6 | 1.80 (0.88) | 2.02 (0.80) | 2.25 (0.71) |
| 05/08/2011 | 2.0 | 1.39 (1.42) | 1.20 (1.67) | 1.17 (1.60) |
| 08/03/2012 | 1.6 | 4.97 (0.32) | 5.35 (0.30) | 5.56 (0.29) |
| 05/04/2012 | 1.6 | 2.40 (0.67) | 1.96 (0.81) | 1.78 (0.90) |
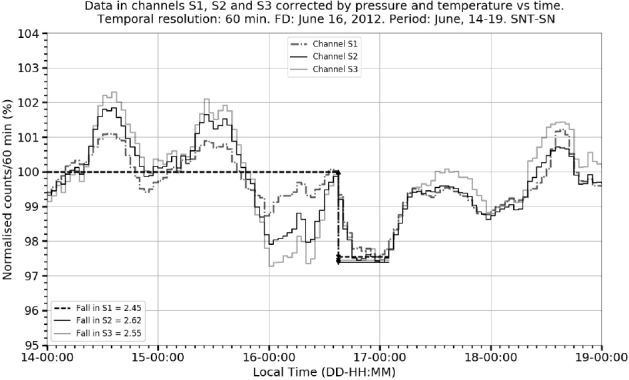
| 16/06/2012 | 3.0 | 2.45 (1.22) | 2.62 (1.14) | 2.55 (1.17) |
| 14/04/2013 | 2.0 | 2.60 (0.77) | 2.65 (0.75) | 3.09 (0.65) |
Table 8 Comparison of FD percentage recorded in the SNT-SN channels S1, S2 and S3, and the fall percentage registered by the NMCDMX.
| FD | S1 | S2 | S3 | Average | NMCDMX |
| June 17, 2011 | 1.80 ± 0.05 | 2.02 ± 0.05 | 2.25 ± 0.06 | 2.02 ± 0.34 | 2.3 |
| August 05, 2011 | 1.39 ± 0.05 | 1.20 ± 0.06 | 1.17 ± 0.08 | 1.25 ± 0.29 | 2.0 |
| March 08, 2012 | 4.97 ± 0.09 | 5.35 ± 0.09 | 5.56 ± 0.11 | 5.29 ± 0.53 | 7.0 |
| April 05, 2012 | 2.40 ± 0.08 | 1.96 ± 0.08 | 1.78 ± 0.08 | 2.04 ± 0.41 | 3.5 |
| June 16, 2012 | 2.45 ± 0.08 | 2.62 ± 0.07 | 2.55 ± 0.08 | 2.54 ± 0.31 | 4.0 |
| April 14, 2013 | 2.60 ± 0.08 | 2.65 ± 0.09 | 3.09 ± 0.10 | 2.78 ± 0.50 | 4.5 |
5 Calculation of correction coefficients
5.1 Correction coefficients by atmospheric parameters
Based on the mean values of the atmospheric parameters for each of the select periods that are shown in Table 2, it is evident that the contribution of the dynamic pressure to the total pressure at the SN summit is negligible, since for both periods the maximum value of the dynamic pressure is within the uncertainty range of the values of the barometric pressure.
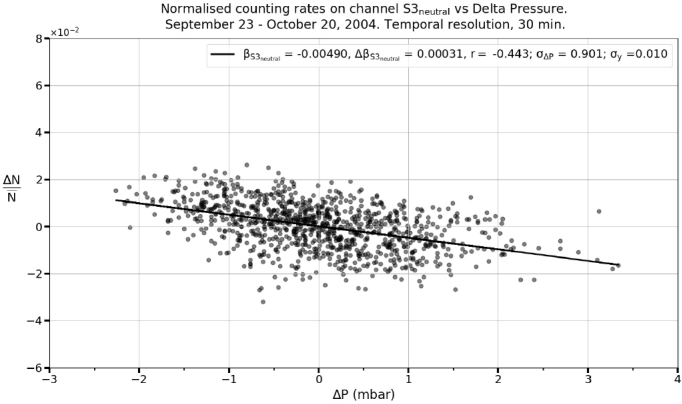
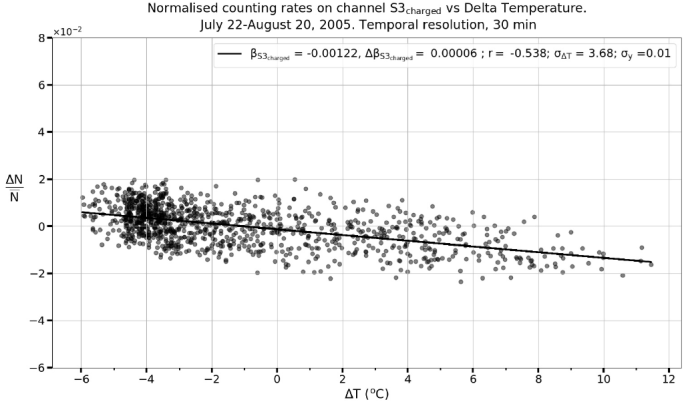
In Figure A-1 - Figure A-6 (appendix) the scatter plots of normalized counting rates as a function of barometric pressure, temperature and relative humidity variations are shown. βP, CT and CRH, ΔβP, ΔCT and ΔCRH represent the value of the respective coefficient and its standard deviation, calculated by linear regression. In addition, the value of the Pearson correlation coefficient and the standard deviations of the data of each axis are shown in the plot upper insert.
Table 3 summarizes the values of the coefficients per channel for the three atmospheric parameters considered during the period September 23-October 20, 2004.
Table 4 shows the values of the coefficients per channel for the period July 22 - August 20, 2005.
The values in Table 3 and Table 4 marked with a * are unreliable because their respective uncertainties are of the same order as the average value, i.e. the mean may be zero.
Those indicated with **, correspond to the relative humidity correlations with cosmic ray intensity, these values were not considered since, due to the high calorific capacity of the water, humidity acts as a temperature catalyst. This indicates that the influence of the relative humidity on the variation of the particle count recorded by the SNT-SN is included in the temperature correction. Besides, the RH coefficients are generally at least an order of magnitude smaller than the pressure or temperature coefficients. Therefore only two coefficients (pressure and temperature) are neccesary for the atmospheric effects correction to the SNT intensity rates.
It should be noted that the temperature coefficients for the neutral particle channels shown in Table 3 and Table 4 are positive. This is due to the predominance of the negative effect of temperature on the total neutron component over all the atmosphere. In the high atmosphere, neutral pions (π0 mean-life=(8.52±0.18)x10-17s) decay in electromagnetic component of air shower, a fraction of charged pions (π± mean-life = (2.6033±0.0005)x10-8s (Patrignani and others, 2016) decay in muons. On the other hand, a relative number of charged pions collide with nuclei of air particles, generating neutrons and protons: with increasing air temperature, the length for crossing the same depth of matter “(in g cm-2) will increase but the number of nuclear interaction pions will decrease (Dorman, 2004).
5.2 Determination of a global correction coefficient
The general correction coefficient is
To use equation (10) it is necessary to express the temperature coefficient CT(%/ºC) as βT(%/mbar).
Table 5 summarizes the values of the correction coefficients for each channel under study, for the analyzed quiet periods.
As can be observed in Table 5, for channels S1, S2 and S3 the ratios are 0.07, 0.23 and 0.22 respectively. In the case of the S1 channel, the βT value (0.023) lies within the range of the βtotal uncertainty. For the channel S2, its βT value (0.095) is of the same order that its βtotal uncertainty. In the case of the S3 channel, its βT value (0.116) is just a 49% higher than the standard deviation for its corresponding βtotal. These calculations show that the prevailing atmospheric parameter to perform the correction of the SNT-SN counting rates is the barometric pressure. The coefficients for neutral particles are not considered, since FDs events are phenomena related to charged particles.
6. Selected FDs time-intensity results
The plots presented below show the selected FDs, for which data were corrected by pressure and by pressure plus temperature. The vertical axis presents the values normalized to the average values of the counting rates of each channel, expressed as percentage of the total. The counting rates are normalized to the mean value of the data set corresponding to three quiet days before the onset of the FD. On the horizontal axis time is represented in DD-HH:MM format. The values in the inset of each graph are shown as percentage values. For the purpose of comparison with the NMCDMX hourly records, the temporal resolution of the data in every one of these plots is about 60 minutes.
6.1 June 17, 2011 event
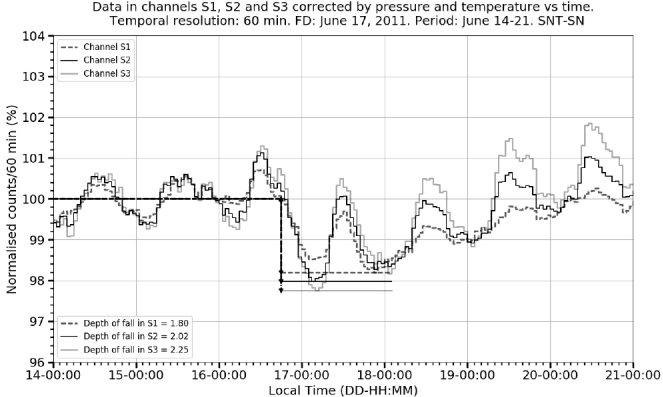
Figure 4 and 5 show that the level of daily fluctuations in the counting rates is high and that the maximum amplitude of the diurnal variation (1.6%) represents a high proportion of the percentage of the FD fall (71% in the S3 channel). Let us consider the depth of decrease (ffPP), based on data corrected by pressure, and the depth of fall ffPT, based on data corrected by pressure plus temperature. The parameter ff =
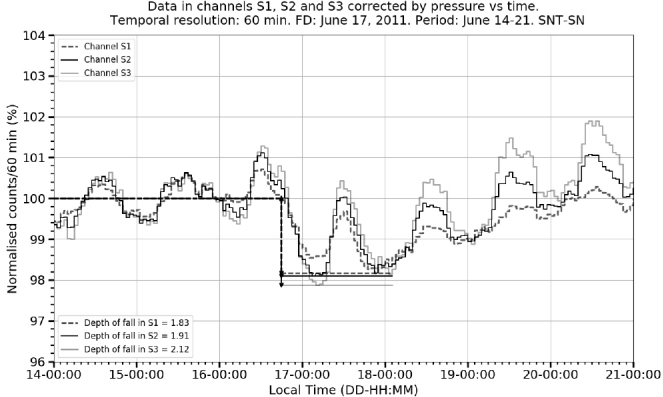
Figure 4 FD on June 17, 2011. The graph shows the normalized counting rates time evolution of the three charged particle channels in the counting rates corrected by pressure.
6.2 August 05, 2011 event
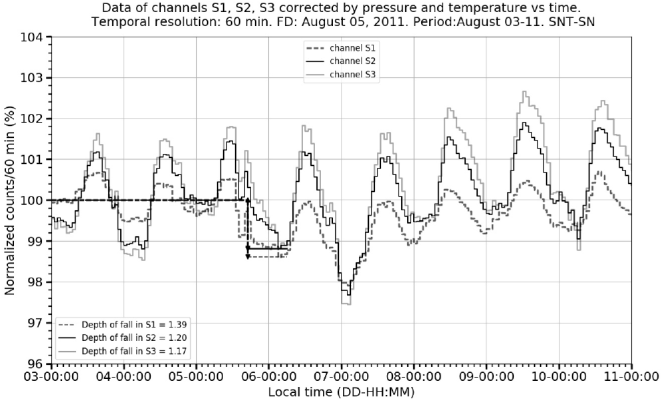
As in the previous case, Figure 6 and Figure 7 show that the level of daily fluctuations in the counting rates is high and that the maximum amplitude of the diurnal variation (3%) represents a very high proportion of the percentage of the FD fall (256% in the S3 channel). In this event, the relative differences between the fall percentage values shown in Figure 6 and Figure 7: for the channel S1 is less than 0.001, for S2 is 0.01 (1% of the decrease value) and for S3 is 0.01 (1% of the decrease value). In the S2 and S3 channel cases, the relative differences are two orders of magnitude smaller than the percentage decrease of the FD.
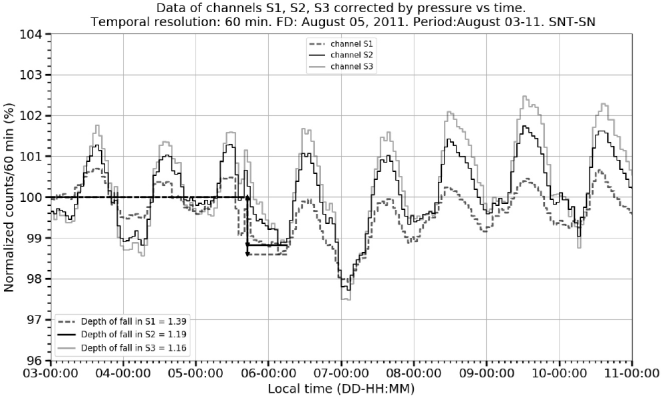
Figure 6 FD on August 05, 2011. The graph shows the normalized pressure corrected counting rates time evolution of the three charged particle channels.
6.3 March 08, 2012 event
Derived from the normalized counting rates in Figure 8 and Figure 9, we estimate for the channel S3,
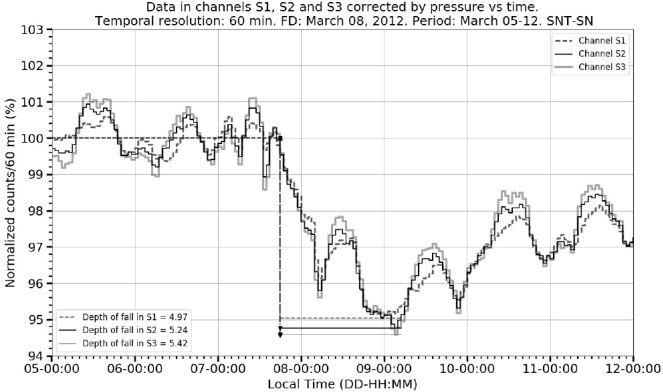
Figure 8 FD on March 08, 2012. The graph shows the pressure corrected normalized counting rates time evolution of the three charged particle channels in the records.
6.4 April 05, 2012 event
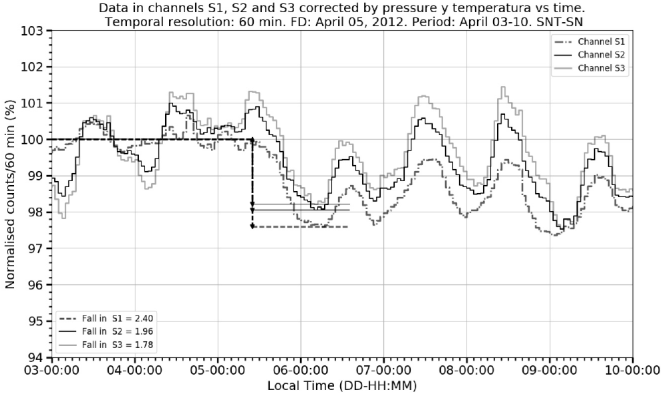
Figure 10 and 11 show that the maximum amplitude of the diurnal variation is about 2% and it represents a very high proportion of the percentage of the FD fall (82% in the S1 channel, for the counting rates corrected by pressure). In this event, the relative differences between the fall percentage values shown in Figure 10 and 11 for channel S1 is -0.02 (-2% of the decrease value), for S2 is -0.05 (-5% of the decrease value) and for S3 is -0.07 (-7% of the decrease value). For all channels, the relative differences are two orders of magnitude smaller than the percentage of FD.

Figure 10 FD on April 05, 2012. The graph shows the pressure corrected normalized counting rates time evolution of the three charged particle channels in the records.
6.5 June 16, 2012 event
Derived from the normalized counting rates in Figure 12 and 13 estimations were performed for the channels: S1, ff1
The June 12, 2012 FD presents high fluctuations in the ADV in all channel counting rate registers (2 - 4.5%) few hours before the start of the event. Its mean value (3%) represents a very high proportion (113%) of the deepest decrease value (2.66%).
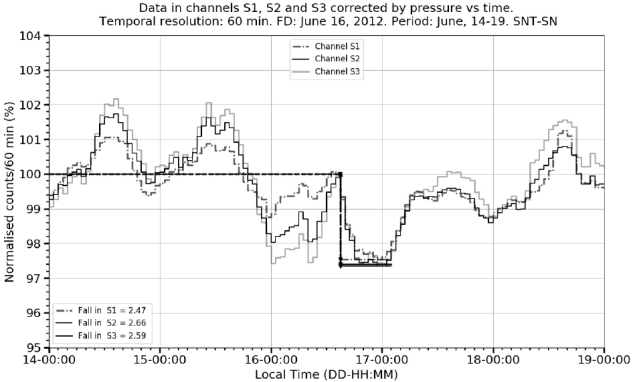
Figure 12 FD on June 16, 2012. The graph shows the pressure corrected normalized counting rates time evolution of the three charged particle channels in the records.
6.6 April 14, 2013 event
Once data corrections by pressure and by pressure plus temperature were made for this event, the variations ff1
As stated previously, one of the main goals of the present work was to determine the SNT-SN capabilities as an instrument for the analysis of FDs.
Table 7 shows the percentage decrease for each event and for each charged particle channel, together with the estimated ADV amplitude, which is then used to compare the FD depth in the counting rates with that of the diurnal variation.
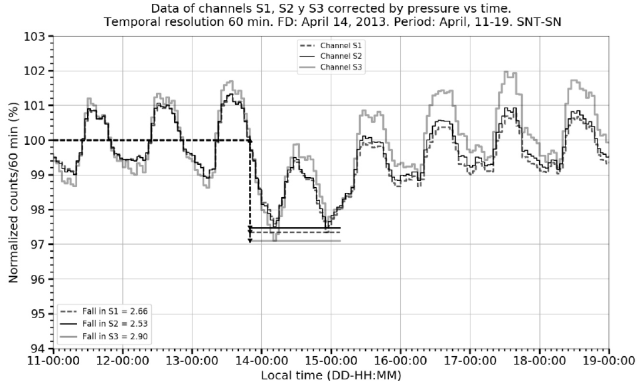
Figure 14 FD on April 14, 2013. The graph shows the pressure corrected normalized counting rates time evolution of the three charged particle channels in the records.
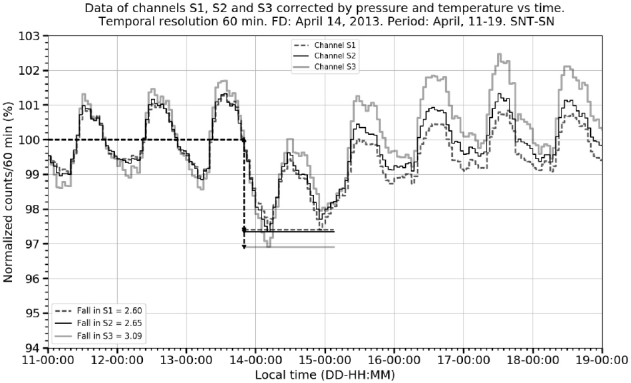
Figure 15 FD on April 14, 2013. The graph shows the temperature and pressure corrected normalized counting rates time evolution of the three charged particle channels in the records.
The results shown in Table 7 tell us that almost all of the amplitudes of the diurnal variation exceed the 50% of the maximum decrease of the different FDs studied. This fact leaves only one event for which the amplitude of the diurnal variation does not exceed 50% of the maximum decrease. This implies that the SNT-SN is not a reliable instrument to analyze FD events for which the percentage decrease in the counting rate is less than 5%.
The decay rates recorded in the S1, S2 and S3 channels of the SNT-SN were computed for the selected events. They are summarized in Table 8.
The uncertainty numbers expressed in the column ‘Average’ include the standard deviation of the FD values recorded in channels S1, S2 and S3 of charged registers, and the margin of uncertainty from the values for every channel, for each event. From the calculations shown in Table 8 it can be seen that for all the events chosen in this study, the estimated depths of the FDs by the SNT-SN are smaller than those registered by the NMCDMX (Musalém, 2015). As shown in Table 7, the March 08, 2012 is the only event for which the
Figure 16 shows the response functions for both detectors on March 2012, using Clem & Dorman (2000) formalism.
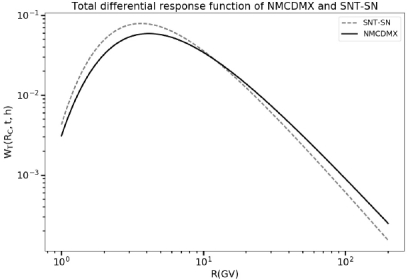
Figure 16 Total differential response functions for the NMCDMX and the SNT-SN, on March 2012. Plots were calculated according to Clem & Dorman (2000) expressions.
From Figure 16 it may be appreciated that the Rigidity Response for both monitors are very similar. Mean responses were computed, for SNT-SN is about 23.7 GV and for NMCDMX is about 24.5 GV.
Therefore, the difference can be considered in the minimum values registered by both stations on all selected events, and might additionally be due to the slight difference in their mean differential response values.
7 Summary and conclusions
In this work an analysis of six selected FDs in the period 2011-2013, recorded by the SNT-SN was presented. The aim was to determine if the SNT-SN is a reliable instrument for research on the FD phenomena. In order to know which of the relevant atmospheric parameters (pressure, temperature, relative humidity and wind speed) might have an influence in the registered counting rates, a detailed correlation study was done with each one of these parameters. It was determined that dynamical pressure is not significant in the total pressure value, therefore only the barometric pressure is considered for the subsequent analysis. Plots of the data recorded in the S1, S2, S3 channels for neutral and charged registers on the SNT-SN vs pressure, temperature and RH for the calculation of the correction coefficients, using data from quiet periods, avoiding in this way the possible influence of solar activity phenomena. Relative Humidity had not enough influence in the data variations and then only the barometric pressure and the temperature were taken into account in the calculation of the atmospheric corrections to the raw data (Table 3 and 4).
I the case of the S1charged channel, the mean value of the correction coefficient by temperature represents only the 5.9% of the mean value of the total correction coefficient, for the S2charged channel it represents the 18.6% of the mean value of its total coefficient and for the S3charged channel, it represents the 17.9% of its total coefficient (see Table 5).
In the case of the analysis of the selected FDs using data corrected by pressure, and by pressure plus temperature, the minimum relative difference was found in the event of August 05, 2011, reaching a relative difference of 0.01, while the biggest difference was obtained is in the case of the event of April 05, 2012 with the -0.07 (deeper falls in the counting rates corrected by pressure) and in the case of the event of April 14, 2013, with the 0.07 (Table 6), which lies in the margin of uncertainties for channels S2charged and S3charged. Those arguments lead to establish (as was discussed in comments of Table 5 and 6) that the only atmospheric parameter neccesary to perform the correction of the SNT-SN counting rates is the barometric pressure. The contributions of the temperature coefficients to the estimation of the total decrease values are not significant, since these contributions lie in the margins of uncertainty of the total decrease values (see Table 6 and SNT-SN averaged decrease values in Table 8), therefore, the temperature can not be considered as a factor for computing the correction coefficients.
When FD data for the SNT-SN were compared with those of the NMCDMX, difference in the percentage records of the FD minima on both monitors is significant. The Rigidity Response Mean Value of both stations was similar, but the difference in atmospheric depth can perfom the most relevant role in the differences found, since for the lower energy components of the secondary shower, the atmospheric absorption reaches at least an order of magnitude. A general conclusion of the present evaluation would be that, due to a diurnal variation of large amplitude (about (1.6 − 3)%, Table 7), the SNT-SN is not a reliable instrument for the analysis of FDs whose minimum value is less than 5% of the quiet day reference line. Despite the result of this paper regarding the limited capabilities of the SNT to reliable results during cosmic rays FDs, we should bear in mind that the SNT was originally designed and constructed with the main aim to detect solar neutrons, as its name clearly indicate. In this respect, the detector has been quite successful. (See e.g., González et al., 2015, and references therein). Being the product of strong solar flares, solar neutrons are short duration events (around 30 min) and do not require a long term high stability of the detector as in the case of FD events, in order to achieve this stability, an intercalibration of the Proportional Counters would be neccesary. However, we have now installed in Sierra Negra an unique and much more reliable detector, the Scintillator Cosmic Ray Telescope, recently set in operation (see e.g. Sasai et al., 2017).


 nova página do texto(beta)

