


 nova página do texto(beta)
 Inglês (pdf)
 Artigo em XML
 Referências do artigo
 Enviar este artigo por email
 Citado por SciELO
  Similares em
SciELO
Similares em
SciELO 
 Permalink
Introduction
The electrical resistivity techniques are assumed to be of considerable importance especially for subsurface mineral and structural exploration because of very high resistivity contrasts among the lithological units, controlled study depth, and ease of field operations. One of those techniques is the vertical electrical sounding technique (VES). Although, different approaches have been already proposed for interpreting field VES measurements, confusion arises however in selecting the suitable approach for the quantitative VES interpretation. Each and every approach has some merits and demerits, hence no single interpretative method can give satisfactory results in all subsurface conditions. Efforts are therefore concentrated on improving and developing different appropriate interpretative techniques for interpreting the measured VES data. The selection of the appropriate VES interpretative technique depends on the lithology if it is simple or complex, and on the resistivity contrast in the study region (Asfahani, 2016). Considerable modifications on the traditional VES configurations themselves have been carried out in order to get as much as possible information with high resolution about the lithology of subsurface structures. The geoelectrical configuration, the survey direction and line spacing and the electrode spacing must be chosen as judiciously as we can to get the optimum geoelectrical results.
Different geoelectrical approaches such as the asymmetrical mirrored three-electrode arrays AMN and MNB have been consequently proposed and used in various presentations to detect different targets (Karous, 1982). Those approaches proved that two-sided three electrode configurations are more suitable than the classical full array (Schlumberger, Wenner) over a complex geology (Candansayar and Basokur, 2001). Karous and Pernu (1985) combined the sounding and profiling techniques by means of AMN and MNB half-Schlumberger arrays, and introduced a fast and approximate data processing technique named as ‘gradient (G) transformation’ to identify thin conductors. They proved the ability of this combined technique in detecting vertical contacts, such as dykes and steeply dipping faults. The profiling curves’ inequality observed between the values of apparent resistivity by applying AMN and MNB array can be used to locate a resistivity heterogeneity along a given studied profile (Candansayar et al., 1999).
Schulz and Tezkan (1988) recorded simultaneously the Schlumberger and half-configurations to examine the dimensionality of the subsurface, and pointed out the superior resolving ability of two sided half-Schlumberger array. Hafizi (1998) detected fractures in a hard rock area using combined resistivity profiling and square array techniques. Candansayar and Basokur (2001) applied two sided three-electrode array to reveal small-scale targets. They examined the inversion results of 2-D of both traditional and asymmetrical apparent resistivity data. The inversion of 2-D of the two-sided three-electrode apparent resistivity data determines accurately the burial depth, the size, and location of the target. This findings proved that the three-electrode array has better resolution for detection of small targets compared to its four-electrode counterpart and dipole-dipole data.
The electrical resistivity methods have been introduced while prospecting for phosphatic resources in Syria (Asfahani and Mohammed, 2000). Traditional Vertical Electrical Sounding (VES) measurements using Schlumberger array were applied in Al-Sharquieh phosphate mine, and interpreted by different interpretative techniques (Asfahani and Mohammed, 2000; Asfahani, 2010). It was indicated that the task was made difficult by both the limitations of those techniques themselves and the complexity of the lithological section in the studied area.
Interpretation problems, such as non-uniqueness or suppression show that different geoelectrical input models can produce the same output model curve, and hence gives rise to ambiguity. Often the best-fitting model curve presents a good estimate of the true resistivity, since there are few options for generating alternate well-fitted curves. In other cases, however, the non-uniqueness is so complex, that other surveys, such as seismic or test wells are necessary to distinguish the correct structure from others. For example, for thin layers relative to the thickness of the overlying layer, the principle of equivalence will considerably affect the interpretation (Koefoed, 1979). The indication of those thin layers on the VES curve could be even absent due to the suppression principle (Koefoed, 1979). According to the equivalence principle, the thickness and resistivity cannot be determined from a sounding curve, but only their product, where T equivalence exists, or their quotient, where S equivalence holds, A unique interpretation for thickness or resistivity requires that one or the other should be determined using an independent method.
Other serious limitation in such electrical investigations as they fail to distinguish between formations of similar resistivities.
Scale limitations involving electrode spacings, depth of investigation and required resolution are also a drawback for resistivity soundings.
Interpretation of resistivity curves is made by a curve matching technique using master curves (Orellana and Mooney, 1966) for the initial determination of thicknesses and resistivities of corresponding layers (initial approximate model). The parameters of this approximate model were accurately interpreted using an inverse technique program, until a goodness of fit between the field curve and the theoretical regenerated curve was obtained (Zohdy, 1989; Zohdy and Bisdorf, 1989).
Correct quantitative interpretation requires two conditions to be satisfied: first, the calculations must be precise; second, a reasonable geological concept or model must be incorporated in the interpretation process. Disregard of either can have a serious negative impact on the validity of the results of a geoelectrical survey for any locality.
Present-day interpretation procedures are based on the assumption of a one-dimensional (1-D) medium. If this assumption is not satisfied, the interpretation results will be incorrect and a 2-D or 3-D approach must be adapted (Dey and Morrison, 1979).
The facies of phosphate deposits in Al-Sharquieh mine are characterized by very sharp changes in all directions (Asfahani, 2016). The curve matching method (CMM) (Orellana and Mooney, 1966) applied consequently for interpreting traditional VES data related to the study region has a quite poor resolution, such that we cannot identify on the logarithmic plots thin layers buried at depths more than five times their thickness. Many spurious results were produced, that caused difficulties during quantitative interpretation of the VES measurements. Asfahani (2010) modified the traditional geoelectrical Schlumberger configuration, developed and adapted a new structural interpretative approach aimed at enhancing the CMM.
Recently, Asfahani (2016) applied the inverse slope method (ISM) to reinterpret the same (VES) data measured in the Al-Sharquieh phosphate mine. It was found that ISM overcomes both the limitations of the CMM and the complexity of the lithological section.
The main objective of this paper is to apply geoelectrical combined sounding-profiling configuration for characterizing the sedimentary phosphatic rocks in Al-Sharquieh deposits mine in Syria. The combined three-electrode array suggested by Karous and Pernu (1985) is modified, adapted and applied in this work. The electrode C∞ fixed and planted at the infinity is slightly modified to be movable in this present research, where OA=OB=OC= AB/2. The gradient transformation (G) developed by Karous and Pernu (1985) is consequently modified in order to take into consideration the slight geometry modification of the three-electrode array. The modified gradient transformation (G) under a given station is calculated as a function of AB/2, where the vertical variations of resistivity are traced.
Geological Setting
The Palmyrides is a 350 km long, NE-SW elongated ridge located in central Syria (Figure 1-a). The Southern and Northern Palmyrides are separated by an extensive internally-drained basin called the Daww basin filled with Neogene-Quaternary deposits. In the Palmyrides ridge, a sedimentary sequence from upper Triassic to Neogene is exposed and consists of several lithologic units, including the Soukhneh group. The Soukhneh group divided into two lithological formations (Rmah and Sawwaneh) is characterized by its significant phosphorite deposits and composed mainely of two rock types: calcareous and siliceous rocks. The calcareous rocks are dominated by limestone, marly limestone, limy marl, and marl with characteristic limy balls ranging in size from a few centimeters up to 2 m in diameter. The siliceous rocks are composed of thin-layered flint horizons or flint lenses and nodules. Figure 1-b shows a typical geological column of phosphatic deposits in Central Syria (modified by Jubeli, 1998 in the Reference list).
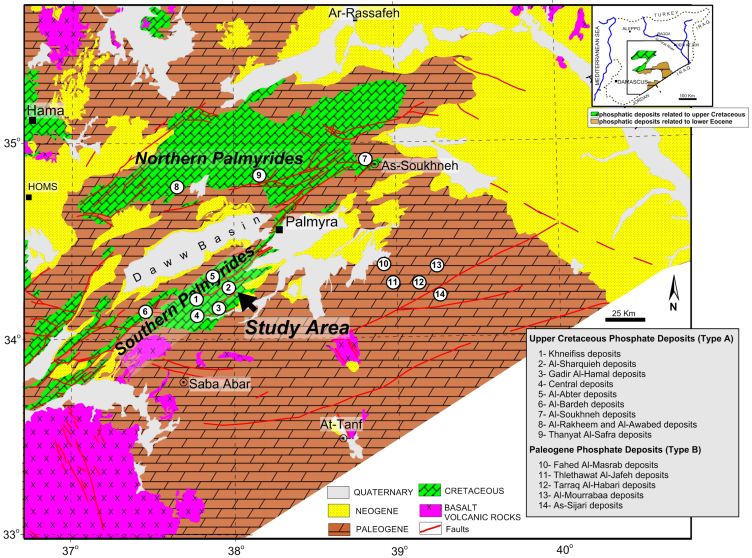
Figure 1-a Phosphatic deposits in the Palmyrides region of central Syria, including the Al Sharquieh mine (Asfahani, 2016).

The phosphatic layers are thick in the central part of the Palmyrides, and thin eastward until they pinch out under the marly deposits of the Arak and Tantour formations. Two principal types A and B of phosphatic deposits exist in Syria (Figure 2-a); type A are related to the phosphates of the Late Cretaceous age, while type B are related to the early Eocene Syrian Desert phosphorites (Ponikarov, 1966). Khneiffis and Al-Sharquieh locations are the main mines in Syria for phosphate extractions (Figure 2-a). The phosphatic deposits in the region are attributed to enrichment processes involving phosphorus and plankton particles, which indicates a paleogeographic evolution related to Cenonian transgression and the subsidence of the Arabian Platform. In addition, the phosphatic deposits are associated with primary and secondary uranium mineralizations. The former are associated with phosphate precipitation while the later fills open cracks and pores, due to surface and subsurface percolation (Abbas, 1987).
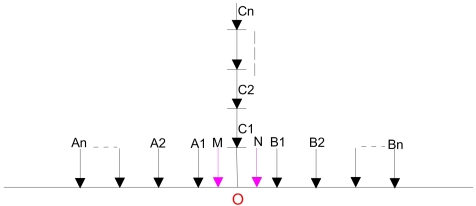
Figure 2 Schema of the combined sounding-profiling configuration (two three electrode configurations AMN and MNB). A, B and C: current electrodes, M and N: potential electrodes, O: configuration center.
The following facies are exposed at Al-Sharquieh mine (Asfahani and Mohamad, 2000):
Description of the combined three electrodes system
The particular array of the three electrodes system is used in this paper as shown in Figure 2. A, B and C represent the electrodes of electrical current, while M and N show the location of the potential electrodes. The current electrodes A and B are planted at the left- and right hand sides of a pair of potential electrodes respectively. Electrode C is located along the line perpendicular to the centre of the measuring profile, where OA=OB=OC=AB/2. Two measurement sequences are executed for each position of potential electrodes. The first apparent resistivity measurements are obtained by applying an electrical current into ground through the C1, C2,…, Cn and A1, A2,…, An electrodes. The measurements are similarly repeated by using the C1, C2,…, Cn and B1 ,B2 ,... Bn electrodes. The values of apparent resistivity ρAC and ρBC obtained by using CJ-AJ and CJ-BJ current electrodes in pairs respectively constitute the left and right apparent resistivity values corresponding to the same potential electrode pair (M and N). This procedure allows obtaining the resistivity variation as a function of depth (AB/2). Shifting the potential electrodes to the next electrode locations and repeating the same measuring sequence, a set of apparent resistivity values along the measuring line are acquired, and the resistivity section is obtained.
Simultaneous execution of profiling and VES surveys along a given profile results in combined sounding-profiling data, which allows detailed investigations about the study area to be obtained.
The apparent resistivity ρAC can be defined as:
where ΔV AMN , is the potential difference between M and N electrodes caused by the current (I) applied through the source (A) and (C) electrodes. The geometric factor, K AC of the array is given by the equation:
The apparent resistivity ρBC corresponding to the case where the current is applied through B and C electrodes is obtained in a similar way as for ρAC , where the geometric factor K BC is equal to K AC, being CM=CN.
Considering the conventional application where the current is injected through A and B electrodes, the following equations can be obtained for the apparent resistivity ρ AB :
Where
It is noteworthy to mention that apparent resistivity ρ AB can be directly computed from the two other apparent resistivity values ρAC and ρBC. This is a direct implication of the superposition rule without actually measuring the potential difference (Karous and Pernu, 1985).
After some algebraic arrangements, equation (4) yields
thus the resistivity “ρAB” is called “average apparent resistivity”.
The 16 separations of the current electrodes used in this research are: OA=OB=OC=AB/2: 1.13, 1.68 , 2.18 , 3.66 , 4.74 , 6.15 , 7.96 , 10.33 , 13.38 , 17.35 , 22.49 , 37.75 , 48.78, 63.48, 82.27 and 106.6 m. Several geoelectrical field essays have been tested, and aimed at determining the appropriate electrode spacings AB/2 for carrying out shallow VES, where it has been found that the mentioned seperations give good results in concordance with the geology. Those spacing distances were purposely selected and tested to apply shallow combined VES, where more shallow lithological details are required in the studied area. The phosphatic layer is also reached and characterized by such spacing distances. The potential electrode separations were 0.2, 1.5 , and 20 m.
Data acquisition
A database consisting of 45 vertical electrical soundings VES points have been used, measured at the available 45 drilled pits in the study area. At each drilled pit, a lithological description was carried out with a radioactive measurement using the total natural gamma ray technique. Those pits were also measured by applying the shallow VES. The usefulness of those VES in the definition of shallow phosphatic structures is already well established (Asfahani, 2010). The Terrameter SAS 300B with Booster Terrameter SAS 2000 was used to measure the traditional VES, and the combined VES. The resistance (ΔV/I) is directly measured, and apparent resistivities ρAB, ρAC and ρBC are subsequently computed according to equations (1) and (3) (Dobrin, 1976). The apparent resistivity values ρAB, ρAC and ρBC obtained by increasing the electrode spacing about a fixed point were plotted versus half electrode separation AB/2 to establish three field resistivity curves ρAB, ρAC and ρBC.
Gradient transformation (G)
The discrepancy between the values of apparent resistivity ρAC and ρBC obtained from the corresponding AMN and MNB configurations may be used to locate a resistivity inhomogeneity along the profile.
Karous and Pernu (1985) defined the gradient transformation “G” as
where x is AB/2 the spacing along the profile and L denotes the key numbers of measurement stations along the profile. All apparent resistivity values in equation (6) are measured for the same AO = BO= AB/2 spacing, where C∞ is located at infinity. The increasing or decreasing of the G values depends on the discrepancy between the apparent values measured by the AMN and BMN configurations. Thus, the value of G becomes proportional to the resistivity variation in the horizontal direction.
In the present research, the above equation is adapted and slightly modified to calculate the gradient “G” as a function of AB/2, where AO = BO= CO= AB/2 as follows:
The computed "G" in such a case becomes proportional to the resistivity variation in the vertical direction, and is very sensitive to the vertical lithological boundaries. It can be therefore used for interpreting the traditional VES.
A measured line is covered at regular interval Δx (separation between subsequent dipole centers O (xk)), which is equal to 200 m in the present research. The recording station at a given survey line coordinates three resistivities ρk AB, ρk AC, and ρk BC for a given AB/2. A simultaneous execution of profiling and sounding surveys result in combined sounding- profiling data, which allows us to obtain detailed data about the study area. The measured resistivity data obtained by applying this technique describes the resistivity distribution below the measured line. The resistivity results thus obtained can be presented in the simplest and most instructive form to indicate clearly the true distribution of resistivities under the studied survey line. The profile curves are obtained through plotting the values of resistivities ρk AB, ρk AC, and ρk BC and Gk for a given AB/2 as a function of the station coordinates xk . At every station xk, three sounding curves could also be obtained by plotting the apparent resistivities of ρk AB, ρk AC, and ρk BC and Gk as a function of AB/2 as will be shown below.
Ratio (ρAC /ρBC)
The ratio of ρAC /ρBC is also introduced in this research. It is inspired from the resistivity profiling using the Lee configuration aimed towards detecting the locations of the points of non-homogeneity (Asfahani et al., 2010), which could be interpreted and attributed to faults and fractures. The Lee configuration includes the use of five electrodes AMONB placed on a straight line on the ground (where OM = ON). Three resistivities were measured by applying this array as follows: traditional resistivity ρMN, and two other resistivities ρOM and ρON, were measured between OM and ON respectively. The ratio of ρOM/ρON has already been used to characterize the heterogeneity and lithological variations in the studied Qastoon Dam (Asfahani et al., 2010). The resistivity ratio of ρOM/ρON = 1, indicates an homogeneous medium between M and N electrodes. Ratio values deviating from 1 reflect a sharp geoelectrical contrast between adjacent media of different electrical characteristics, caused mainly by lithological variations, faults and fractures. In the present paper, the application of the above mentioned rule is adapted for analyzing the ratio of ρAC /ρBC, which will be presented in form of profilings and maps. This procedure helps in getting additional lithological and structural information about the heterogeneity and homogeneity of the medium in the studied area. This consequently guides and orients the geochemical explorations towards the heterogeneous phosphatic area, to take samples for analysis.
Results and Discussion
Forty five combined electrical resistivity soundings with the three electrodes configuration were measured at the 45 drilled pits, distributed in the study area along several profiles as presented in Figure 3. At each drilled pit, a radioactive measurement using the total natural gamma ray technique and a shallow combined VES were applied, with providing the lithological description. Such a lithological description is usefully employed for correlating the variations of different geoelectrical parameters obtained by the new shallow combined VES with the lithology as a function of depth. Those variations are also laterally correlated along the different studied profiles in the study area.
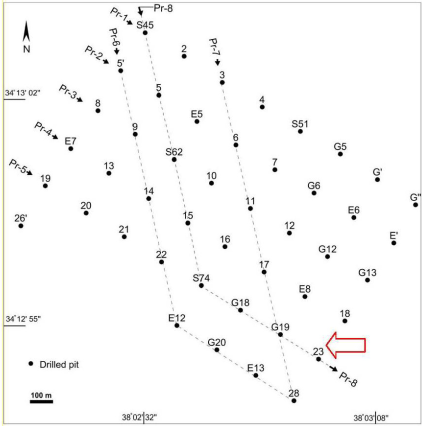
Figure 4 shows the lithological description of pit No. 23 (Figure 3) and the total radioactivity gamma ray measurement taken from the interior of this pit. The radioactivity in this pit reaches its maximum value of 400 cps, which indicates the presence of phosphatic layers. An example of combined geoelectrical VES measurements carried out at the same pit No. 23 is also presented in Figure 5a, where three resistivities are shown: the traditional Schlumberger ρAB, and both ρAC, and ρBC. This figure gives an idea on the behavior of ρAC and ρBC as a function of the spacing AB/2, where their variations, as a function of depth, reflect the lithological variations at the studied VES point. Their maximum divergences are located basically in the range of AB/2 between 10 and 50 m, while their minimum divergences are located in the range of AB/2 between 50 and 106.6 m. The variations of both the gradient (G) and the ratio of (ρAC/ρBC) as a function of AB/2 for the pit No. 23 are also shown in Figure 5(b, and c). The analysis of ρAC/ρBC) helps in getting more information about the heterogeneity of the medium in the study area in lateral and vertical directions.
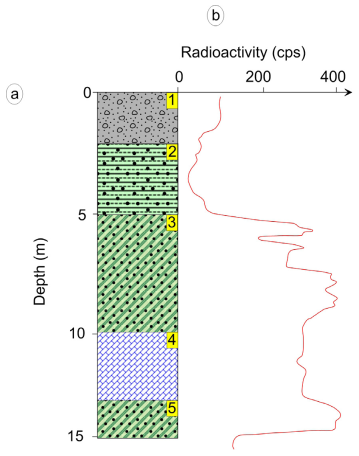
Figure 4 a): Lithological description of pit No:23, b): Natural radioactive gamma measurement at pit No:23. 1: Quaternary alluvium, 2: clay with phosphate, 3: phosphate sand, 4: limestone clay, 5: phosphate sand.
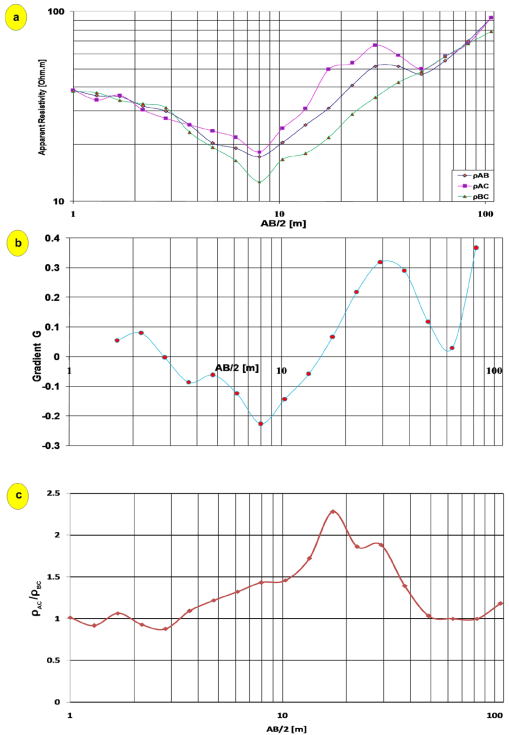
Figure 5 a) Traditional apparent resistivity ρAB, ρAC, and ρBC obtained by the combined VES sounding at pit No:23. b) Gradient G at pit No:23, and c) ratio of ρAC/ρBC at pit No:23.
Figure 6 shows the vertical variations’ maps of the measured traditional apparent resistivity presented as (Log ρAB), the gradient transformation (G), and the ratio (ρAC/ρBC), along profiles Pr-1 and Pr-5 as a function of the spacings AB/2, which vary from 1.13 to 106.6 m. Those maps have been established by using the interpolation Krige technique. It is the most frequently used for spatial interpolation, and based on linear interpolation combined with the mean square estimate error minimization (Krige, 1951). The logarithmic scale is used in this paper, because the original measured resistivity data of the traditional Schlumberger ρAB for these two profiles indicate only the presence of two resistive and conductive zones, which is difficult to be solely interpreted in geological and lithological terms. In fact, The measured traditional Schlumberger resistivity values ρAB in the study region have log-normal behavior, and the use of the logarithmic scale improves relatively, in such a case study, the resolution of the traditional resistivity data ρAB. The resistive and conductive zones are related to the presence of phosphate layers and clays respectively. The electrical resistivity increases with increasing phosphate content, and decreases with increasing clay content (Asfahani and Mohamad, 2000). The highest resistivity values are observed in the study area in the NW direction, where phosphatic beds are thinner and occur at or near surface (Asfahani, 2010).
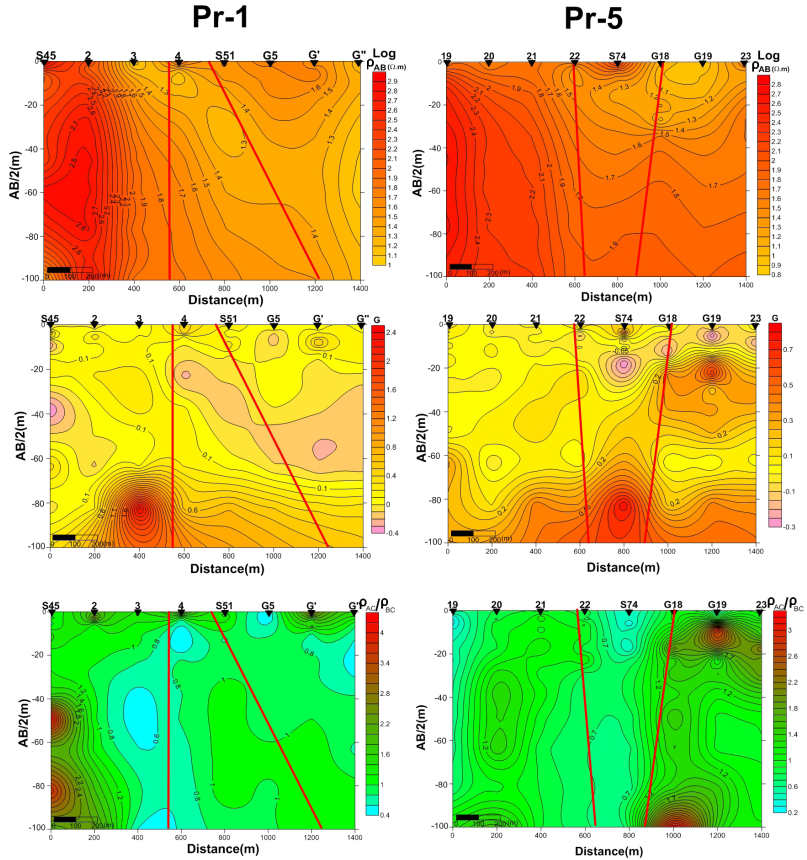
Figure 6 Vertical variation’ maps of traditional ρAB , G, and ρAC/ρBC as a function of AB/2 obtained along Pr-1 and Pr-5.
Both gradient (G) maps of Pr-1 and Pr-5 developed in this paper (Figure 6) clearly show a vertical lithological distinction in the conductive zone of ρAB, meaning that the (G) parameter has a strong vertical resolution in comparison to the traditional ρAB of a poor resolution. The results of (G) maps particularly along the Pr-5 are in a remarkable concordance with those already presented and published by Asfahani (2010) (Figure 7). The faults and fractured zones shown in all the maps presented in Figure 6 are inferred from Figure 7.
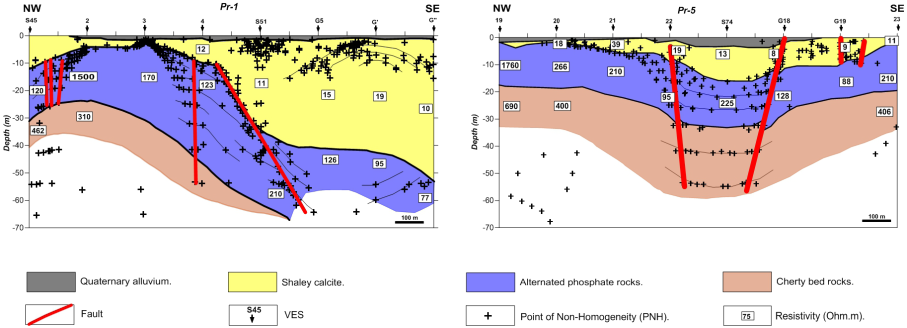
Figure 7 Quantitative interpreted shallow geological cross-sections for traditional VES profiles (Pr-1 and Pr-5) from Al-Sharquieh mine (Asfahani, 2010).
Figure 7 shows the interpretations of shallow VES, distributed along the two Pr-1 and Pr-5 profiles, by using the Pichgin and Habibullaev technique (Pichgin and Habibullaev, 1985) and the concept of the points of non homogeneity (PNH). The positions of the faults and the fractured zones were precisely determined along those two profiles by using the strict rules required according to this technique (Asfahani, 2010).
A clear vertical stratification is observed particularly under VES- G19 and VES-S74, where four different stratified values of gradient (G) reflect the presence of Quaternary alluvium, shaley calcite, altered phosphate rocks, and cherty bed rocks. The fractured zone between VES-22 and VES-G18 along Pr-5, which has been already determined by Asfahani (2010) (Figure 7) is clear and also indicated herein by the gradient (G) (Figure 6). The vertical ratio of (ρAC/ρBC) map along Pr-5 helps also in getting more information about the lithological and structural variations. The fractured zone between VES-22 and VES-G18 is characterized by a (ρAC/ρBC) equal or less than 1. The influence of the already determined fault (Asfahani, 2010) under VES-22 is less clear than the one determined under VES-G18, where high values of the ratio (ρAC/ρBC) reaching more than 3.5 are observed under VES- G18, VES- G19 and VES-23 in the SE direction. The comparison between the quantitative interpretation along Pr-1 and Pr-5 (Asfahani, 2010) and the qualitative ones presented in this paper indicate an acceptable similarity between the two different interpretations. This similarity proves the accuracy of the adapted quantitative lithological model shown and presented in Figure 7, and the high resolution of both the gradient (G) and the ratio (ρAC/ρBC) (Figure 6). The accuracy of (G) and (ρAC/ρBC) facilitates the analysis and the interpretation of the phosphate profiles in the study region, by providing clear lithological differentiations laterally and vertically.
Figures 8 (a and b) show the profiling variations of the measured traditional resistivity data (ρAB), the gradient (G), and the ratio (ρAC/ρBC) along the profile Pr-5 for both spacings AB/2 of 22.49 and 29.15 m. One can easily notice how both the developed parameters (G) and (ρAC/ρBC) are more sensitive than the traditional apparent resistivity (ρAB) parameter to the fractured zone already located between VES-22 and VES-G18 as presented in Figure 7. In fact, (G) and (ρAC/ρBC) show a notable decrease in the fractured zone particularly for AB/2 of 22.49 m, while no variations in the values of ρAB are observed.
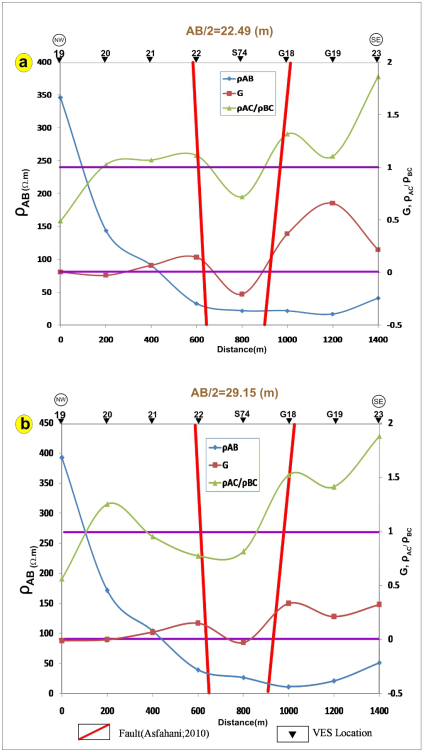
Figure 8 a) Profiling variations of ρAB, G, and ρAC/ρBC along Pr-5 for AB/2 of 22.49 m. b) Profiling variations of ρAB, G, and ρAC/ρBC along Pr-5 for AB/2 of 29.15 m.
Figure 9 shows the variation’s maps of traditional apparent resistivity data (Log ρAB), (G), and (ρAC/ρBC) related to the studied area for only different spacings of AB/2 of 3.66, 17.35, 37.78 and 82.28 m. The raw measured resistivity data of ρAB for AB/2 of 3.66 m indicates in its best case high resistive zone in the NW direction, while the whole study area for this AB/2 is characterized by relatively low resistivity not exceeding 120 Ω.m. The measured resistivity ρAB being of very low resolution, this explains the reason behind using the logarithmic scale (Log ρAB) (Figure 9) as discussed above. The use of such a logarithmic scale increases considerably the resolution of the measured resistivity data. The increased resolution of (Log ρAB) allows better comparisons with other two developed parameters (G) and (ρAC/ρBC) to get easily and integrally a complete interpretative picture of the studied profile as presented in Figure 9. The analysis of (G) for this AB/2 of 3.66 m reflects different geological situation, where a positive (G) concentrated on VES 17 is surrounded by negative G, indicating different lithological variations corresponding to this AB/2.
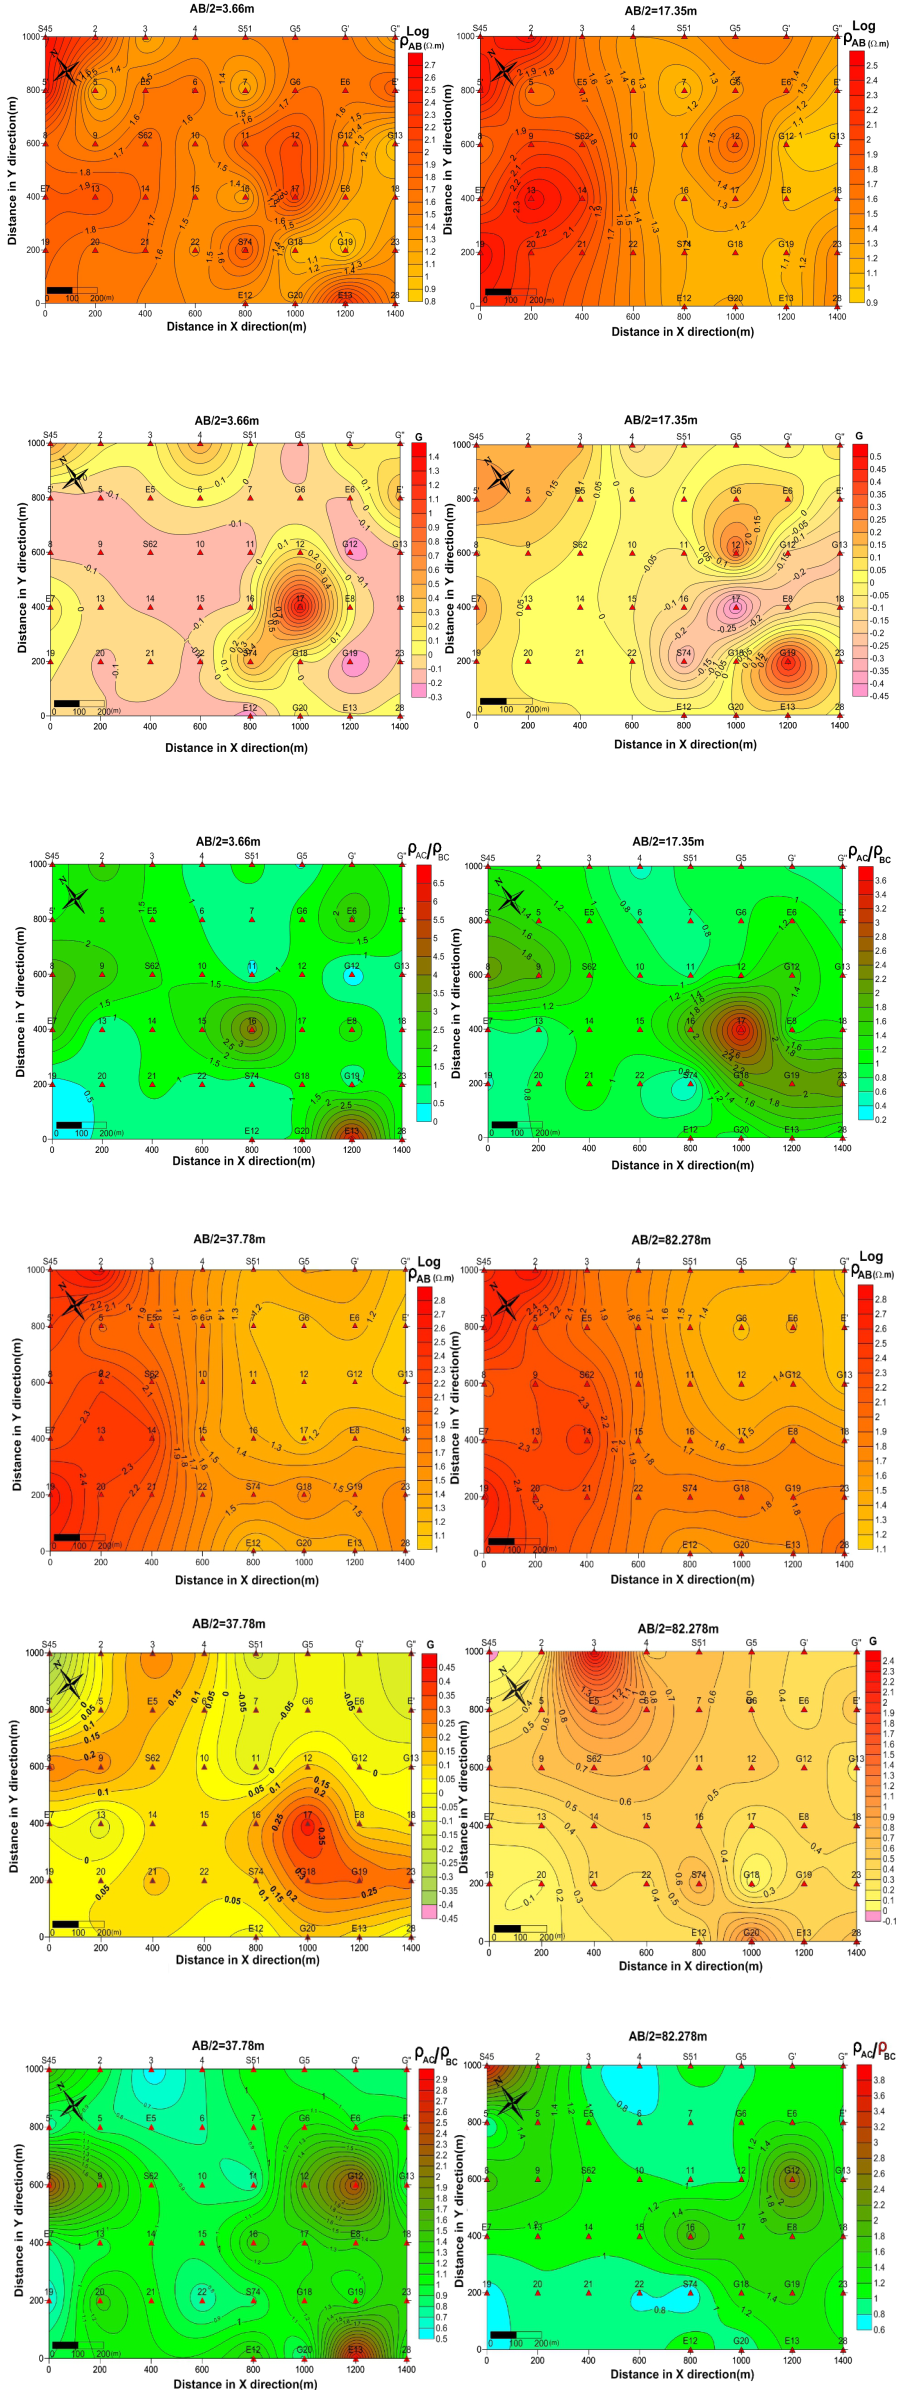
Figure 9 Variation’ maps of ρAB, G, and ρAC/ρBC for the study area for AB/2 of 3.66, 17.35, 37.78 and 82.28 m.
The logarithmic traditional resistivity map of (Log ρAB) for AB/2 of 17.35 m shows two distinct zones of low and high resistivity. The map of (G) for this AB/2 of 17.35 m shows, in the zone of low resistivity, two positive gradient G concentrated on VES 12 and G19, separated by negative gradient G concentrated on VES 17. The ratio map of (ρAC/ρBC) for this AB/2 of 17.35 m shows a high value reaching 3.6 concentrated on VES 17.
The same geological picture is observed while studying the variation’s maps of (Log ρAB), (G), and (ρAC/ρBC) for AB/2 of 37.78 m. Nothing is shown on the logarithmic traditional (Log ρAB) map except two relatively high and low resistivity distributions. The map of (G) for AB/2 of 37.78 m shows clearly a positive distinct structure of G concentrated on VES 17.
The map of (ρAC/ρBC) for this AB/2 of 37.78 m shows two high anomalies concentrated on G12 and E13.
The (G) and (ρAC/ρBC) maps show good lateral resolutions for the studied area for AB/2 of 82.28 m, in comparison with the logarithmic traditional apparent resistivity (Log ρAB) map of relatively poor resolution.
It is important to mention in the present case study the small range values of both developed parameters, the gradient (G) and the ratio (ρAC/ρBC) for all the established maps, shown in Figure 9, in comparison with the high range values of apparent measured traditional resistivity (ρAB) . The logarithmic behavior scale for the traditional resistivity (Log ρAB) values is therefore preferable as compared with the simple linear resistivity scale. In such a logarithmic scale, the resolution of the traditional resistivity maps (Log ρAB) is relatively better, where acceptable comparisons could be easily made with both maps of (G) and (ρAC/ρBC) as presented in Figure 9.
The above comparisons between different parameters of (Log ρAB) , (G), and (ρAC/ρBC) show good examples of the limitations of the traditional lateral and vertical apparent resistivity maps of (ρAB) if they are used solely. The advantages and the remarkable sensibility and resolution of the developed gradient parameter (G) for the lithological and structural variations in phosphatic environment are well demonstrated and documented.
Figure 10 resumes the structural and geological fence diagram showing lateral variations of the phosphatic layer in the study area at Al-Sharquieh mine. This diagram is obtained through interpreting the shallow Schlumberger configuration with different interpretative methods (Asfahani, 2010). The geological field surveys indicate also that the locations of the identified faults and the fractured zones are characterized by high radioactivity, due to secondary uranium concentrations introduced by ground waters along fracture zones (Asfahani, 2010).
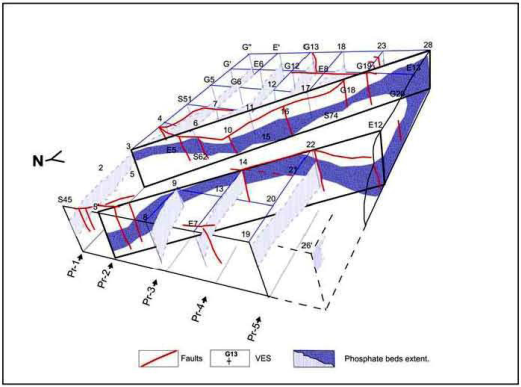
Figure 10 Structural and geological fence diagram showing lateral variations of the phosphatic layer in the study area at Al-Sharquieh mine, based on the interpretations of shallow VES configuration (Asfahani, 2010).
The delineation of the presence of faults and fracture zones through interpreting the shallow Schlumberger resistivity data is an indirect guide for uranium prospecting in such phosphatic environments.
Conclusion
Shallow geoelectrical combined sounding-profiling configuration was adapted and proposed in this research to characterize the phosphate deposits in Al-Sharquieh mine in Syria. Its results application allows us to make the following conclusions:
The high vertical resolution of the computed gradient parameter (G) of the modified combined sounding-profiling configuration is obtained compared with the traditional apparent resistivity Schlumberger (ρAB),which yields poor resolution.
The traditional resistivity measurements (ρAB) in the study area have a logarithmic behavior. The logarithmic scale is therefore preferable (Log ρAB) for establishing the different traditional resistivity maps, as documented above. This scale improves relatively the resolution of the resistivity data (ρAB), where acceptable comparisons could be easily made with both the gradient (G) and the ratio (ρAC/ρBC).
The high sensitivity of the computed parameter (G) for the vertical lithological boundaries helps in any quantitative interpretation of the traditional VES data.
The adapted geoelectrical combined sounding-profiling configuration is sensitive to fractured and faulted zones.
The determination of faults and fracture zones in the study area by the new shallow adapted combined array is a useful indirect guide for uranium prospecting in such a phosphatic environment.
Different maps were used to represent the results of the traditional resistivity (Log ρAB), (G), and (ρAC/ρBC) allowing integrated qualitative interpretations.
The sole interpretation of traditional resistivity measurements (ρAB) in the form of profiling and map resulted in very poor resolution and does not give sufficient clarity of the lithological and real resistivity distributions in the study area. The interpretation which combines additional different parameters such as (G), and (ρAC/ρBC) allows better resistivity and lithological distribution.
It is proven in this research paper that the combined soundings and the subsequent analysis of (G) and (ρAC/ρBC) data are important tools to improve the resolution of the geoelectrical interpretation.
The combined three electrodes configuration adapted in this research is recommended for other different applications in mineral and structural exploration.

