


 nueva página del texto (beta)
 Inglés (pdf)
 Artículo en XML
 Referencias del artículo
 Enviar artículo por email
 Citado por SciELO
  Similares en
SciELO
Similares en
SciELO 
 Permalink
Introduction
Groundwater is the main source of drinking water in arid and semiarid areas, and hence its vulnerability assessment management helps to delineate areas that are more susceptible to contamination (Ghazavi et al., 2010; Ighbal et al., 2014). The groundwater dynamics reflects the response of the groundwater system to external factors such as groundwater consumption, water storage, climate condition, and other human activities (Minville et al., 2010; Ghazavi et al., 2011, 2012). Groundwater is vulnerable to contamination by anthropological activities and infiltration of urban and industrial wastewater can recharge aquifers and pollute those used for potable water supply (Oiste, 2014; Odukoya and Abimbola, 2010).
The nitrate pollution of groundwater caused by agricultural activity and a substantial increase in fertilizer utilization are also becoming an increasing problem. Recently, groundwater vulnerability mapping is an important key to decision making processes and improving planning in order to prevent groundwater contamination (Mahvi et al., 2005). Groundwater vulnerability means the degree of protection that the natural environment provides against the spread of pollution in groundwater and is classified as intrinsic and specific vulnerability (National Research Council, 1993). Specific vulnerability is used to define the vulnerability of groundwater to particular contaminants (Gogu and Dassargues, 2000). Intrinsic vulnerability can be defined as the ease with which a contaminant introduced into the ground surface can reach and diffuse in groundwater (Vrba and Zoporozec, 1994). Groundwater-specific vulnerability is regarded as more meaningful than intrinsic vulnerability, because some affecting factors of intrinsic vulnerability, such as soil media, net recharge or groundwater depth, have been changed due to an increasing effect of human activities. Different methods have been introduced to estimate groundwater vulnerability, that may be divided into three general categories: statistical methods, process-based simulation models, and overlay and index methods (Chenini et al., 2015). Therefore, overlay and index methods are based on combining different maps of the region. The more popular type of the overlay and index methods are DRASTIC (Aller et al., 1987), AVI (Van Stemproot et al., 1992), GOD (Foster, 1987), and IRISH (Daly and Drew, 1999). These models have been used in several places including the Iran (Saatsaz and Sulaiman, 2011), Morocco (Ettazarini, 2006), USA (Fritch et al., 2000; Shukla et al., 2000), and China (Wen et al., 2008; Huan et al., 2012). In arid and semiarid regions, irrigation is always changing due to many factors: high evapotranspiration, low rainfall, groundwater quality, structural, and soil condition. In most arid countries, increasing populations and high living standards causes excessive water demands used in urban and industry’s needs. Water used in irrigation has also been an important water demand. In arid and semiarid regions over exploitation of groundwater induced alarming declines in water levels (Edoulati et al., 2013). One of the most important issues in this regard is that, remediation of contaminated aquifers is expensive.
To recognize the need to an efficient method to protect groundwater resources from contamination, scientists and managers develop aquifer vulnerability techniques for predicting which areas are the most vulnerable (Mueller et al., 2012; Chenini et al., 2015). During the past years the assessment of groundwater vulnerability to pollution has been subject of intensive research and a variety of methods have been developed. To evaluate aquifer vulnerability, the GIS and remote sensing tools are combined to various methods: standard DRASTIC, GOD, SINTACS and SI, also used to evaluate aquifer vulnerability to pollution. A comparative study of the vulnerability maps was performed in order to choose the best method (Teixeira et al., 2015; Chenini et al., 2015). Because of expansion of agricultural activities, of excessive use of chemical fertilizers, and of location of industrial and municipal wastewater of Hamadan, it is possible for this aquifer to be polluted. The aim of the present study is to assess the aquifer vulnerability of Hamadan - Bahar plain and to recognize the sensitive areas against pollution. Recognizing the vulnerability of groundwater will help to manage their quality and protect groundwater resources. The possibility of pollutants reaching and releasing into the groundwater after contaminating the ground, is called the aquifer vulnerability. In this study aquifer vulnerability assessment is to identify areas prone to pollution that were modeled via the DRASTIC, GOD, SINTACS and SI models, and the Maps generated for each parameter were classified and combined based on the models.
Materials and Methods
In this study, the vulnerability rating used is the SI, SINTACS, GOD, and DRASTIC (Aller et al., 1987). Before starting detailed data collection, some general information pertaining to the socioeconomic, physical characteristics and demographic, settlement patterns and water supply schemes of the communities under study were gathered. This information has been used as a base for planning the field data collection and determining the selection of the sample population (Tadesse et al., 2013). The parameters used in these models are: Topography (T) that to the slope percent of the land surface which was determined directly from the topographic maps of Hamadan area (scale 1:50.000). Soil Media (S) index obtained by digitizing the existing soil maps, with 1:50.000 scale were required from Hamadan Research and Education Center for Agriculture and Natural Resources and cover the entire region. The Water Table Fluctuations method (WTF) was used to calculate Net Recharges (R) parameter. One of the major impacts of the integrated watershed management program was on improving groundwater recharge and its availability (Pathak et al., 2013). It estimates groundwater recharge as the product of specific yield and the annual rate of water table rise added to the total groundwater draft ended by the equivalent permeability, which is found from well logs (Sophocleous, 1991). One of the most important parameters used in these models is the water depth (D) index. This index represents the depth from the land surface to the first groundwater aquifer. It determines the thickness of material through which infiltrating water must move before reaching the aquifer-saturated zone (Witczak et al., 2004). Consequently, the depth of the groundwater impacts on the interaction degree between the percolating contaminant and subsurface materials and, therefore, on the degree and extent of physical and chemical attenuation and degradation processes, the depth groundwater distribution was established by subtracting the groundwater level, measured in 35 wells in Hamadan - Bahar aquifer, from the topographic elevation in the corresponding cell location (Rahman, 2008). Hydraulic Conductivity (C), is defined as the ability of aquifer materials to transmit water which, controls the rate at which groundwater will flow under a given hydraulic gradient. The rate, at which the groundwater flows, also controls the rate at which it enters the aquifer. Figure 1 shows the Flowchart of methodology for groundwater pollution vulnerability analysis.

Study Area
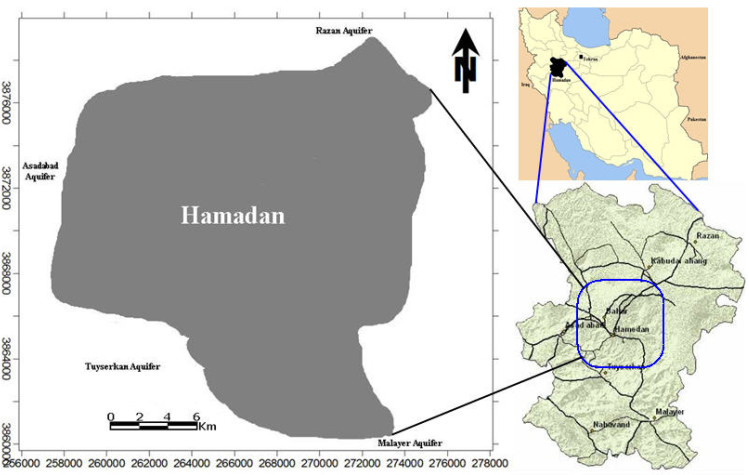
The study area is situated in the Hamadan province and partially in the Central province of northwest Iran, covering an area from latitude 34° N to 35° and from longitude 48°E to 49°30’E (Figure 2). The highest elevation, 3.580 meters, occurs at the Kuh-e Alvand south of Hamadan. The lowest elevations, slightly less than 1.500 meters, occur along the water courses on the western margin of the sheet. The survey area was flown in blocks of constant barometric altitude of 7.000 feet IN METERS, 8.000 feet IN METERS, and 9.500 feet IN METERS with higher portions of the area drape flown, and at a terrain clearance of 1.500 feet in the northeast corner of the quadrangle. Traverses were flown with 7.5 km spacing at headings of 45°/225° for all the blocks (Akhavan et al., 2011). The lines were flown with a 40 km spacing perpendicular to the traverses. Refer to the map for exact flight path locations. Numbers on the flight path refer to either line numbers or fiducial (data point) numbers. The most prominent geologic feature is the belt of metamorphic and igneous rocks which trends northwest-southeast. This belt consists largely of Hamadan phyllites with well-developed hornfels near the margins of post-Cretaceous granodiorite intrusions. An area of more mafic igneous material occurs northwest of Hamadan. Paleozoic marbles and Cretaceous crushed limestone and igneous bodies occur in the Zagros thrust belt in the southwestern corner of the sheet. Cretaceous limestone and Oligo-Miocene marbles and limestone’s occupy the northeastern and southeastern portions of the sheet. Faulting in this area trends northwest-southeast except for the Mesozoic sedimentary zone east of Hamadan where there is a north-northeast to south-southwest trend (Akhavan et al., 2011).
Methodological analysis
The Hamadan - Bahar alluvial aquifer is an important water resource used for irrigation, therefore the aquifer vulnerability to pollution by generic pollutants has been studied by applying the following methods.
A raster map was made from interpolation of the well data using the GIS software for each indicator. To obtain the vulnerability indexes the corresponding weight and rating according to the formula of each method was given to each indicator. All indicators in different models were mapped (Philes, 2004). The slope map was obtained from the digital elevation model and the maps of soils were scanned and then processed from the Soil Map. Each indicator was classified on certain vulnerability classes with values from the DEM. The distribution of each indicator was mapped using the Kriging interpolation technique. After data classification for each indicator, a spatial mapping in Raster format by interpolation of these indicators was necessary. All the maps were projected in “WGS 1984 UTM Zone 39 N, datum Carthage”. At ArcGIS software maps are classified by “symbology” and then cut with the tool “Extract by Mask”; then they will be recorded in Raster “Tiff” format. The maps are then superposed through “ArcScene,” and the final product of vulnerability has been deducted by the “Raster calculator” tool, using the formulas already defined previously and multiplying the classified indicators by their equivalent weight.
For DRASTIC method, inherent in each hydrogeological setting are the physical characteristics that affect the groundwater pollution potential. After the factors such as transmissivity, temperature, aquifer chemistry, gaseous phase transport, tortuosity and some others have been evaluated, the most important factors that control the groundwater pollution potential have been determined to be Net Recharge, Soil Type, Depth to Water, Topography, Aquifer Material, impact of the Unsaturated Zone and Aquifer Media of the Hydraulic Conductivity, in short DRASTIC. In the following, a numerical ranking system to assess groundwater pollution potential in hydrogeological setting has been devised (Aller et al., 1987). It assigns a note between 1 and 10 and a weight between 1 and 5 for each used parameter. DRASTIC models use Eq. (1).
where, DI: is the vulnerability index based on the DRASTIC model; C: hydraulic Conductivity; I: Unsaturated zone; T: Topography; S: Soil Media; A Aquifer Material; R: Net Recharge and D: Depth to Water.
The GOD method is an empirical method for the assessment of aquifer pollution vulnerability developed in Great Britain; this method uses three indicators: Overlying lithology, Depth to groundwater and Groundwater occurrence. Values from 0 to 1 can be assigned to the indicators (Foster, 1987). For GOD models used Eq. (2).
Where, C i : Aquifer type; C a : Saturated zone and C p : Depth.
The acronym SINTACS stands for seven indicators included in the method: Net recharge, Depth to water, Vadose zone, Slope, Hydraulic Conductivity, Aquifer media and Soil media. The SINTACS method was established for hydrogeological, climatic and impacts settings, typical of the Mediterranean countries. In the same way that DRASTIC method, SINTACS assigns notes and weights for each of these indicators (Civita and De Maio, 2004) using Eq. (3).
where I v is the vulnerability index based on the SINTACS model; S : Slope; C : Conductivity; A : Hydrogeological aquifer characteristics; T : Soil type; N : Vadose zone; I : Net recharge and S : Depth to water.
Specific vulnerability is the term used to define the vulnerability of groundwater to a particular contaminant or group of contaminants. SI method is a vulnerability method for evaluating the specific vertical vulnerability to pollution originated by agricultural activities mainly by nitrates (Ribeiro, 2000). SI assigns notes and weight for each of these indicators in the following way. For SI models Eq. (4) was used.
Where: D : Depth to water; R : Net recharge; A : Lithology; T : Topography and OS : Soil Occupation.


Discussion
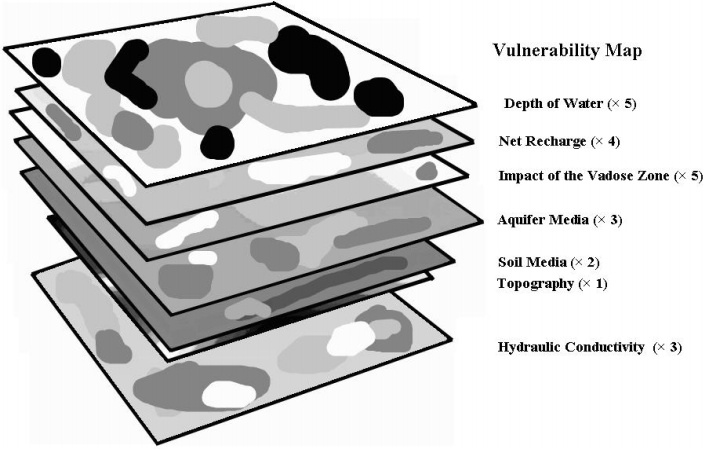
Groundwater contamination risk mapping was carried out by overlay of layers representing the different indicators in the parametric models. Theoretically an overlay was necessary for each indicator. However some indicators are frequently closely associated. In some areas, topography and soil are intimately related, also in other areas, the vadose zone and aquifer media are the same. Values for hydraulic conductivity was frequently extrapolated from only a few points of reference and simply estimated from aquifer media. The data used to generate the Vulnerability Index Map is produced at a variety of scales. Through a function specific to the GIS software the overlay function, the various maps for each index models are combined through the map calculator function from the spatial analyst extension resulting in the vulnerability map of groundwater. After mapping all the indicators, the vulnerability maps were obtained by overlaying the individual maps and calculating the indices on a grid map (Figure 7). The Vulnerability Index for each grid cell was calculated as the weighted sum of the indicators according to equation 4. Finally, the areas on the final map are labeled with the appropriate hydrogeologic setting. The vulnerability indexes for all models are calculated and the final vulnerability map was subdivided into classes related to vulnerability degrees according to the classification of Engel et al. (1996).
The comparison between DRASTIC, SINTACS, SI and GOD methods shows that the closest results are those from the method SINTACS and SI, modified versions of the DRASTIC method adapted to climate prevailing in the study area. The DRASTIC vulnerability map, provides, in turn, more detailed results widely different from other methods (Figure 8). The results showed that the maximum contamination potential in the Hamadan-Bahar plain groundwater was observed in the south, west and northeast borders of the plain. Also there were areas with very low and low potential in the center, north and east of the plain. Both techniques prospected the vulnerability potential in Hamadan - Bahar plain with the same accuracy. This region is an area of high agricultural activity with an intense use of chemical fertilizers. The DRASTIC map resulting from overlaying the seven thematic maps shows four classes, as indicated in Figure 8. The highest class of Vulnerability Index (VI: □ 200) covers 7.1% of the total surface in the central part of the study area (Table 1). This condition is due to the high aquifer permeability coming from the vadose zone sediments nature.
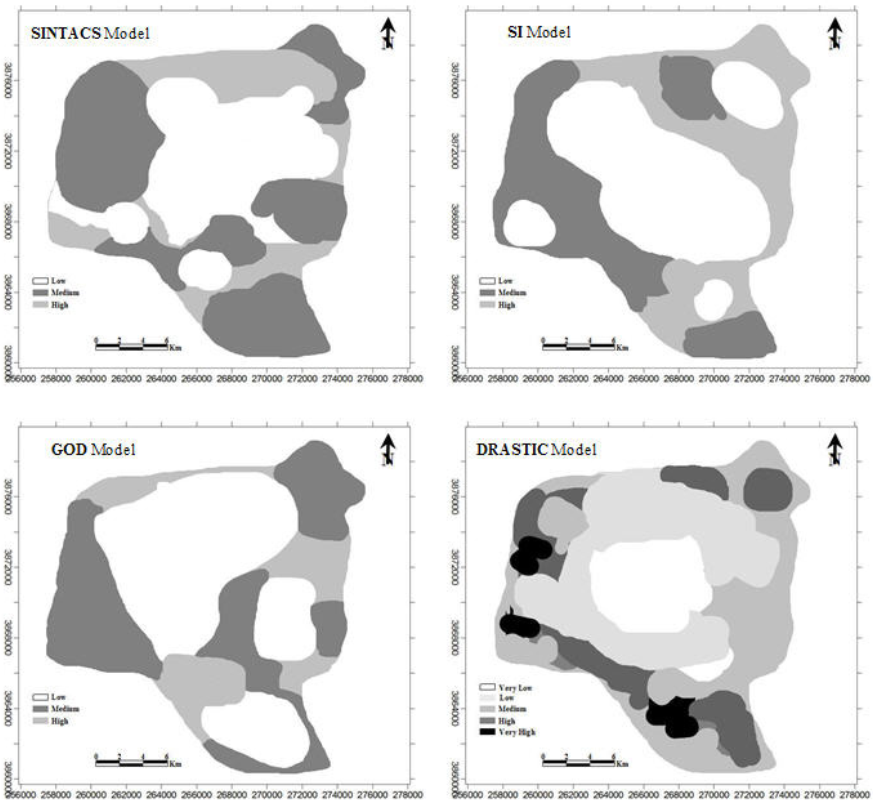
Table 1 Evaluation criteria of the degree of vulnerability in DRASTIC model.
| Vulnerability | Vulnerability Index | Area | |
|---|---|---|---|
| (Km2) | (%) | ||
| Very Low | 1 - 60 | 70.56 | 14.7 |
| Low | 61- 120 | 180.48 | 33.6 |
| Medium | 121- 160 | 121.92 | 29.4 |
| High | 161- 200 | 72.96 | 15.2 |
| Very High | >200 | 34.08 | 7.1 |
The aquifer combination was of quaternary alluvium and sandstones, medium recharge, shallow groundwater and medium hydraulic conductivity. This results in a low capacity to attenuate the contaminants. Also, very low vulnerability, which is represented by 14.7% of the total Hamadan surface, are essentially due to the deep groundwater, the vadose zone sediments and the low permeability, added to the low hydraulic conductivity. As well as the low recharge rate, we assume that these are the same conditions in the case of low vulnerability, with less degree of impact for these indicators. The moderate vulnerability represents 29.4% of the study area. Vulnerability pattern is mainly dictated by the variation of the permeability and the vadose zone (Aranyossy, 1991). The recharge and the depth of groundwater are two indicators having an influence on vulnerability degrees to pollution. The application of SI, susceptibility index method indicates the high vulnerable zones to be contaminated by pollutants (Figure 8). The most vulnerable areas have an indicator between 85 and 100. Zones which have indicator value less than 45 are the less vulnerable (Table 2).
Table 2 Evaluation criteria of the degree of vulnerability in SI, GOD and SINTACS models.
| Vulnerability | SI model | GOD model | SINTACS model | |||
|---|---|---|---|---|---|---|
| Area | Area | Area | ||||
| (Km2) | (%) | (km2) | (%) | (km2) | (%) | |
| Low | 173.5 | 36.14 | 217.54 | 45.32 | 168.9 | 35.22 |
| Medium | 94.3 | 19.65 | 120.58 | 25.12 | 214.3 | 44.62 |
| High | 212.2 | 44.21 | 141.88 | 29.56 | 96.8 | 20.16 |
The use of the SI Model SINTACS indicates the very high vulnerable zones to be contaminated by pollutants (Figure 8). The most vulnerable areas have an index between 187 and 210. Zones which have index values less than 106 are the less vulnerable (Table 2). The GOD Model application indicates the very high vulnerable zones to be contaminated by pollutants (Figure 8). The most vulnerable areas have an index between 0.5 and 0.7 (Table 2). Zones which have index value between 0.1 and 0.3 are the less vulnerable. A statistical comparison among the vulnerability maps generated by each method has been carried out. Figure 8 shows the difference of classification between the used methods of vulnerabilities. This comparison shows a certain similarity between the results obtained using the SINTACS and SI methods (Rahman, 2008).
Also, the DRASTIC map classification shows different results. We see much more of a class at the DRASTIC method, this method is thus more suitable to use in our case. So, in conclusion a specific vulnerability study using the modified DRASTIC method, especially in nitrate, was more recommended for this type of environment. It helps to protect the most vulnerable areas and to guide investors to take decisions.
Models Validation
Validation refers to some independent procedure that can verify the results of the vulnerability analysis. Verification of vulnerability assessments can be done in many different ways. The most common approach, particularly for verification of assessments done with overlay and index methods, is to compare the vulnerability map with the actual occurrence of some common pollutant in groundwater. Typical pollutants used are nitrate and pesticides (Javadi et al., 2001 2011 in the reference list CHECK). Nitrate concentration was selected as the primary contamination parameter to validate models in the present study. According to the results, a significant correlation was observed between measured nitrate and pollution potential evaluated by DRASTIC, but no significant correlation was observed with other models. This value is for the DRASTIC model P<0.01. The correlation coefficient for other models was P<0.05, which indicates more accuracy with the DRASTIC model in this study area. Figure 9 shows the distribution map of nitrate parameter in the study area.

Comparative analysis between DRASTIC results and nitrate levels has been used in several studies (Assaf and Saadeh, 2009). Javadi et al. (2011) modified the DRASTIC model using nitrate measurements. They showed that the correlation coefficient between DRASTIC index and nitrate concentration was 68 % in the modified model that was substantially higher than 23 % obtained for the original model. Huan et al. (2012) indicated that mapping of groundwater vulnerability to nitrate can be applied for sensible groundwater resource management and land-use planning.
DRASTIC, GOD and AVI models were compared in an alluvial aquifer of Florina basin in Greece using a linear regression analysis (Kazakis and Voudouris, 2011). To obtain a comparable value, a quantitative comparison of vulnerability methods was involved. The results of this study indicate that the GOD method has a stronger correlation with the other two methods, and the three models produced comparable vulnerability maps. Ighbal et al. (2014) compared a GIS-based fuzzy pattern recognition model with a standard DRASTIC model in Ranchi district, Jharkhand, India. The results of this study indicated that GIS-based fuzzy pattern recognition model had better performance than the standard DRASTIC model. Polemio et al. (2009) indicate that the GOD method is useful for mapping large areas with high vulnerability contrasts, whereas DRASTIC are useful for any type of aquifer. Correlation coefficient between DRASTIC index and nitrate concentration was 68 % compared with 28 % for GOD index.
Conclusions
The databases which are behind all layers can anytime be updated. Also, the use of GIS facilitates the rapid visualization of some elements in the map by selecting them from the attribute table. The vulnerability maps, contamination data and groundwater quality can be used in view of a rapid and correct evaluation of pollution risk. By using this technology, the information will be used in an efficient manner. The models application showed that Hamadan - Bahar groundwater was characterized by low to high vulnerability degrees. The results of all methods showed that the maximum contamination potential in the Hamadan - Bahar plain groundwater was observed in the south, west and northeast borders of the plain. According to the sensitivity analysis the depth to water table was the most effective parameter on the vulnerability potential. There were areas with very low and low potential in the center, north and east of the plain. Both techniques prospected the vulnerability potential in Hamadan - Bahar plain with the same accuracy. Waters are easily accompanied by various geochemical elements coming from toxic pesticides and their extensive use in farmland, and wastewater. So, in high vulnerability areas, we shouldn’t allow additional high risk activities in order to obtain economic advantage and to reduce environmental pollution hazard.

