


 nueva página del texto (beta)
 Inglés (pdf)
 Artículo en XML
 Referencias del artículo
 Enviar artículo por email
 Citado por SciELO
  Similares en
SciELO
Similares en
SciELO 
 Permalink
Introduction
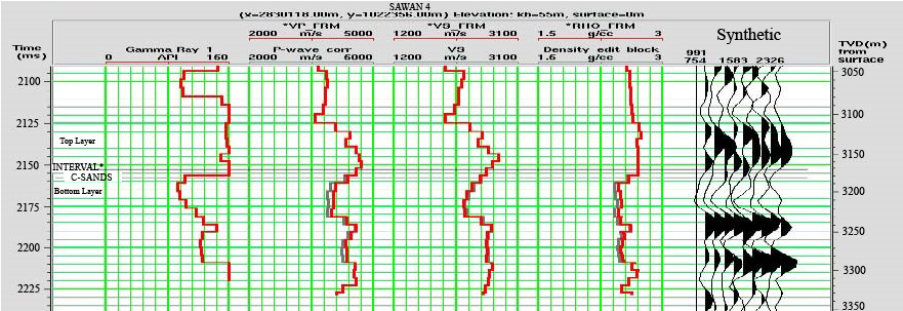
The study area of Sawan gas field is located at the slop area of Thar Platform, Middle Indus Basin and extends between 24º and 28º N latitude and from 66º E longitude to the eastern boundary of Pakistan (Zaigham and Mallick, 2000). Sawan field is one of the major naturally gas producing area from Cretaceous Aged Lower Goru Formation. The sands bearing sequences of Lower Goru are potential reservoirs and consist of alternating sand-shale layers (Afzal et al., 2009). A, B, C and D intervals are the lithostratigraphic units of the Lower Goru Formation (Figure 1). The sand of C interval is dominantly acting as a potential reservoir in the Sawan area (Ahmad et al., 2004).
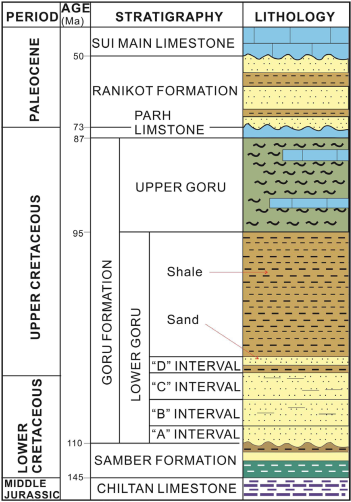
Figure 1 Generalized stratigraphic column showing alternating sand-shale distribution in A, B, C and D intervals of Lower Goru Formation (modified after Krois et al., 1998).
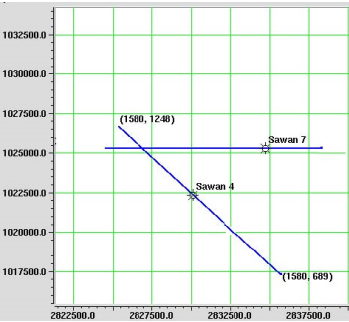
Hydrocarbon production causes variation in reservoir parameters like fluid type, fluid saturation, pressure, temperature and viscosity which in turn changes the seismic properties of reservoir (Lumley, 2001). Sediment saturation and porosity affect the bulk modulus, shear modulus and density of the host rock, therefore uncertainty in one parameter may affect accuracy to estimate the other parameters. After years of production, prediction of porosity and water saturation trends ease to evaluate remaining hydrocarbon potential within the reservoir. To delineate the hydrocarbon potentials of reservoirs, amplitude versus offset (AVO) method was developed (Ostrander, 1984). AVO method was initially used for synthetic models generation and their comparison to common offset stacks generated from real data. Smith and Gidlow (1987) developed the methodology to identify fluid content in reservoir through anomalies on seismic data. Afterward, the cross plot method of intercept versus gradient was developed with several alternative approaches for fluid anomalies identification (Verm and Hilterman, 1995; Castagna et al., 1998; Hedlin, 2000; Hilterman, 2001). On the assumption of isotropic and linearly elastic earth model, the seismic response of a sediment can be completely characterized by three parameters i.e. bulk modulus, shear modulus, and bulk density, therefore, rock physics models are often used to link seismic data to reservoir properties (Bachrach, 2006), more specifically for the amplitude versus offset (AVO) modeling. In this study, the effect of porosity and water saturation variation through AVO modeling and analysis was examined in the context of Biot-Gassmann theory (Gassmann, 1951; Biot, 1962). The availability of substantial geological & geophysical data including 2D/3D Seismic CDP gathers, complete log suites of Sawan-4 and Sawan-7 wells, allowed to perform AVO modeling and analysis over these two selected wells including the seismic lines passing there on (Figure 2).
Methodolgy
The objective of this study was to predict the reservoir properties (porosity and water saturation) using seismic and petrophysical data, before drilling future production wells for optimum exploitation of Sawan natural gas resources. There are several techniques to relate fluid content and porosity to the seismic data but AVO modeling of Sawan wells and AVO analysis of seismic line passing from these wells were adopted to visualize the amplitude response of porosity and water saturation of C sands reservoir of the field. The models were carried out using Hampson-Russell’s software. For AVO modelling, petrophysical results of Sawan-4 and Sawan-7 wells were utilized in rock physics templates (Gassmann fluid substitution Model) as input data. Seismic response of porosity and water saturation was expressed in terms of amplitude; therefore, synthetic AVO modeling has been generated by using Zoeppritz (1919) equation as a function of porosity and water saturation. AVO analysis has been done over 2D seismic lines connecting Sawan-4 and Sawan-7 wells. The fluid substitution modeling was conducted using Gassmann equation and this modelled seismic response was tied with AVO analysis results of 2D lines (Figure 2).
AVO modelling (Fluid substitution modelling)
The rock physics and elasticity theories were utilized for porosity and water saturation estimation. According to Biot-Gassmann theory, the bulk modulus of a reservoir rock can be computed from the porosity and the bulk moduli of the saturated solid, the pore fluid and the dry rock. As the pore fluids do not transmit shear, the shear modulus is unaffected by saturation.
A saturated reservoir rock with porous media consists of solid and fluid phases, the solid porous rock matrix is considered as dry rock. The bulk modulus for dry rock can be calculated through Biot empirical relation or Gassmann’s backward can be employed. Once the dry rock bulk modulus is computed, the velocities of a reservoir rock can be obtained for all possible pore fluids using rock physics modelling. Moreover, the results of the petrophysical log analysis, the volume percentages for Quartz, Clay, Chlorite etc. are taken to compute the density, bulk and shear moduli of the rock matrix, so these three elastic parameters are sufficient to completely characterize seismic response of a reservoir. The fluid moduli for gas and water were calculated at the reservoir temperature and pressure of 170 ºC and 320 bar respectively. The synthetic offset dependent data was calculated with 25 Hz Ricker wavelet to get seismic response of modelled AVO data and the fluid replacement was carried out using the real density and velocity logs, known (log evaluation) lithology and log values for different porosity and saturation. The effects of replacing gas with water for Sawan-7 are shown in Figure 3.
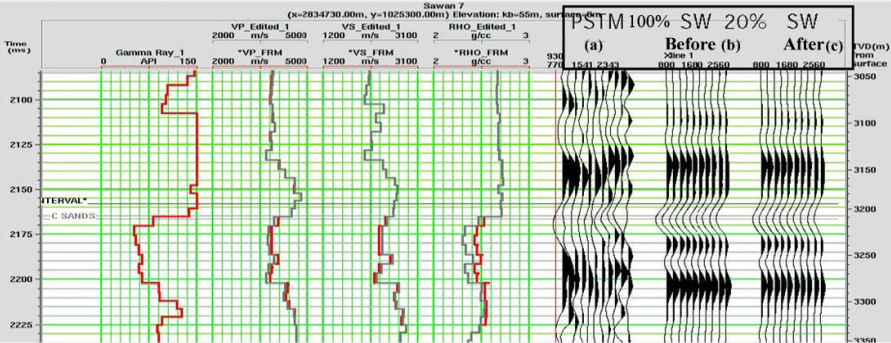
Figure 3 Sawan-7 logs and synthetic gathers before and after fluid replacement modeling. Original logs are shown in grey and modelled logs are shown in red. (a) The offset gathers show the Pre-Stack Time Migration (PSTM) gather, (b) Offset gathers from original logs, (c) Offset gathers from modelled logs.
The velocity and the density logs are shown in grey for the original logs and in red for the modelled water saturation of 100%. The biggest change is evident for the density log: the increase in water saturation results in a significant increase in density, a smaller increase is seen in P-wave velocity. The S-wave velocity decreases slightly. The leftmost gathers displayed in Figure 3 are the Pre-Stack Time Migration (PSTM) gather after offset balancing and then gathers modelled from the velocity and density logs. The offset gathers are modelled using the Zoeppritz equation from the original (middle) and the modelled logs (rightmost gather).
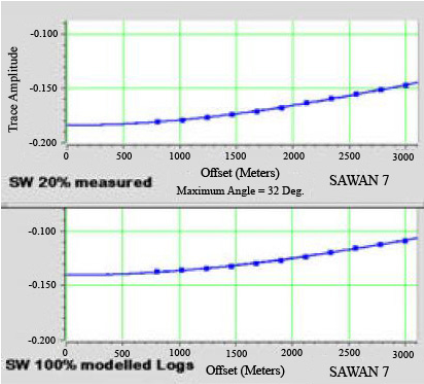
The visual comparison indicates a different amplitude level, but no significant change in AVO behavior. Using the gradient analysis tool on the synthetic gathers, it is quite obvious that the decrease in amplitude with offset is quite low in comparison to the change in zero incidence reflectivity (Figure 4). The decrease of amplitude with offset is almost identical between the original and the modeled full water saturation.
The same modelling procedure was repeated for Sawan-4 data. Using the well logs and the petrophysical results the water saturation is changed to 100%. The results are shown in Figure 5. The log input quality check (QC) panels display the Gamma Ray, P and S wave sonic, density log, a synthetic seismogram and the porosity and water saturation from the petrophysical analysis. A change in porosity is visible between the upper and the lower sand at Sawan-4. This manifests itself as an increase of the amplitude of the intra reservoir peak in the synthetic. The effects of the fluid replacement are less pronounced for Sawan-4 as the difference in water saturation from the original to the modelled log is lower than at Sawan-7. The change in the density log is significantly lower.
Water saturation and porosity variation modelling
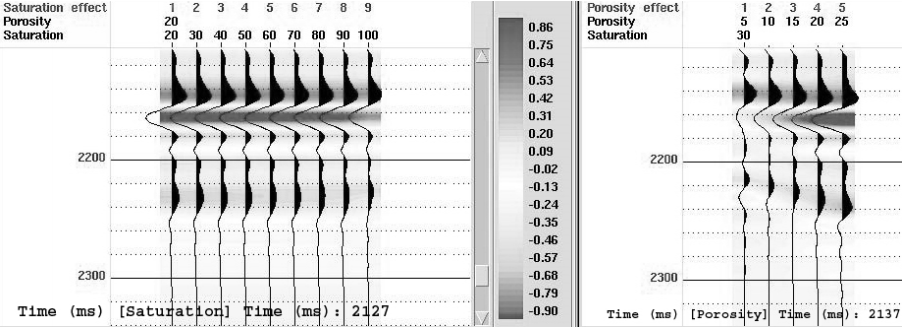
A strong variation is seen in Ro reflectivity with changing gas saturation in the synthetic offset gathers that are computed from the Sawan-7 measured, respectively modeled logs (Figure 5). The availability of good data on the lithology from the petrophysical analysis allowed to model changes of both porosity and saturation for the Sawan reservoir in order to see the effects on synthetic seismic. For Sawan-7, two parameter variation modelling porosity range 5-25% with 5% increment and water saturation range 10-100% with 10% increment occur. The result is a modelled Vp and Vs velocity and a density logs for every parameter combination. Elastic forward modelling allows computing synthetic seismograms from these logs.
Figures 6 and 7 show the change in amplitude for near and far offset for varying gas saturation and porosity keeping one of the parameters constant. In order to compare near and far offset trace amplitudes and the computed AVO gradient, the amplitudes were normalized to Sawan-7 response and the change in top reservoir amplitude for changes in water saturation and porosity occurred. The nominal offset for this trace is 200 m. The left panel shows the effect of changing the water saturation from 20% to 100% (at 20% porosity). The decrease in amplitude with increasing saturation is not discernible with this color and amplitude code. A significant amplitude change is visible for the change in porosity in the right panel. The computed amplitude for top reservoir ranges from 0.01 at 5% to 0.9 at 25% porosity. A similar behavior is visible in the modelled 3000 m offset traces. The amplitudes for top reservoir are lower for far offsets as already shown in Figure 4. A slight decrease in amplitude occurs for increasing saturation. The difference to the near offset change is negligible, but the change is more visible at lower amplitude levels due to more significant change in the color levels.

Figures 8 to 10 show the modelled range of saturations and porosities. Figure 8 emphasizes the results discussed earlier: amplitudes change rapidly with porosity but insignificantly with saturation. A similar picture is visible for the far offset data in Figure 9. There are a lower number of amplitude classes, but almost identical gradients. The increase of amplitude with decreasing water saturation is slightly higher for higher porosities. The effect is not large enough to be recognized in the gathers with the noise level seen in the Sawan dataset.
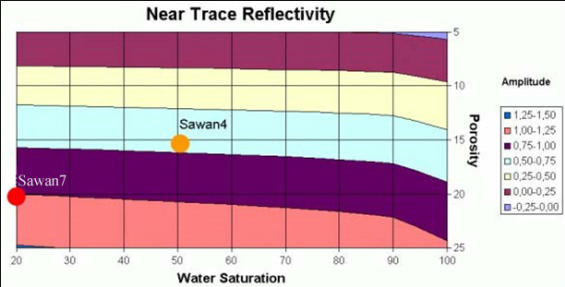
Figure 8 Near trace normalized amplitude slice. The porosity/saturation encountered in Sawan-7 is marked by a red dot and Sawan-4 by an orange dot.
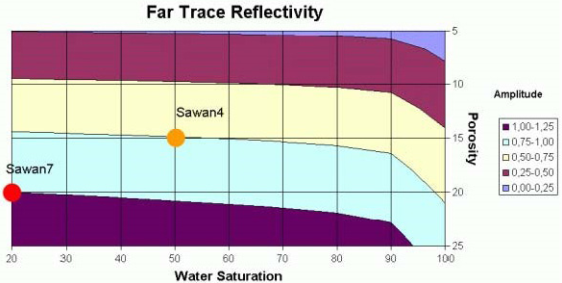
Figure 9 Far trace normalized amplitude slice. The porosity/saturation encountered in Sawan-7 is marked by a red dot and Sawan-4 by an orange dot.
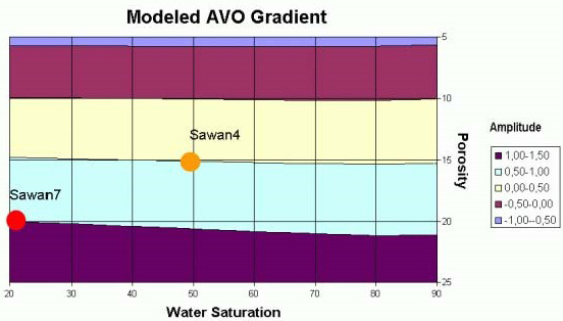
Figure 10 Normalized computed AVO gradient. The porosity/saturation encountered in Sawan-7 is marked by a red dot and Sawan-4 by an orange dot.
As the PSTM gathers demonstrate a similar decrease in amplitude between Sawan-7 and Sawan-4, confidence in the modelling result is shown. Using the near and far trace modelling result, the AVO gradient was computed for every porosity/saturation combination. Figure 9 shows the amplitude slice for the near offset. Modelled near trace amplitude reservoir, properties decrease by 25% from Sawan-7 to Sawan-4. The computed AVO response was normalized again; the value for Sawan-7 was set to 1.
The computed AVO gradient changes significantly with porosity. The change with water saturation, recognizable for porosities of 20% and larger, diminishes with decreasing porosity. To summarize the modelling result: on both the amplitude and the calculated AVO the amplitude effect of porosity changes are many times larger than the saturation effect. The small decrease in AVO gradient visible when water saturation increases at 20% porosity, diminishes to no change in AVO gradient at 5% porosity.
AVO analysis
There are several methods to check the AVO behavior but in the present study, two methods on the gathers extracted along the 2D lines passing through the wells Sawan-4 and Sawan-7 are discussed. Several steps are taken to increase the signal/noise ratio for the AVO analysis. After the correction for residual move out macro gathers are created, by adding three adjacent traces. To preserve the offset information, this addition was performed in the offset domain. To overcome the expected problem is the creation of artificial AVO by analyzing traces with an erroneous change of amplitudes with offset ???. The comparison of the offset scaling computed within the AVO software and the correction applied in the processing sequence, showed a more stable compensation achieved in the processing. Figure 11 shows the gathers near Sawan-7 from the east-west (E-W) extracted 2D line. The uppermost panel depicts the raw gathers. The middle picture is taken after the residual normal move out (RNMO) correction and the trace mix. A significant increase in signal to noise ratio was achieved by adding, without sacrificing much of lateral resolution. The lowermost panel shows the gathers with RNMO correction, trace mix and residual offset scaling applied. The comparison shows the increase of S/N ratio with each processing step from top to bottom of Figure 11.
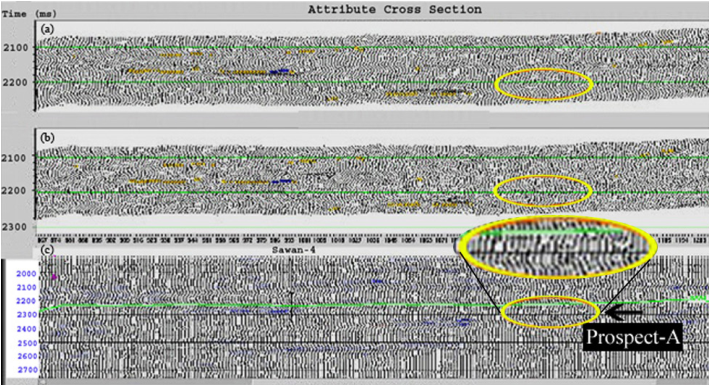
Figure 11 AVOattributes of E-W line connecting Sawan-7. (a) The zero incidence reflectivity (R0) intercept data, (b) The AVO gradient section, (c) A composite plot with prospect-A shown by arrow.
Figure 11 shows the AVO attributes for the E-W line connecting prospect A to Sawan-7 (yellow ovals referred as prospect A). The topmost panel shows the zero incidence reflectivity (Ro) intercept data, the middle panel displays the AVO gradient section and the lowermost panel is a composite plot: Trace data shows the intercept Ro and color data shows the product of intercept times gradient (Ro x GA). The top C-sand horizon shown on the composite plot is used to define the window for cross plotting. Figure 12 is a confirmation of the results already described by Figure 11. The blue color of very good reservoir is just seen at the edge of the Sawan-4 anomaly, whereas the location does not show anomalous behavior at all.

AVO gradient analysis
The gradient analysis tool shows variation with offset in amplitude values extracted at a certain time sample of the gather as connected points. The smooth curves are the regression lines fitted using a linear (dashed) or robust (solid line) fitting algorithm. The correlation coefficients are shown for both methods of regression computation. The analyses are displayed for Sawan-4, Sawan-7 and around the location of selected 2D seismic lines. The results display the amplitude values extracted at the trough (for the top reservoir) in blue and the amplitudes of the next peak in red color.
As amplitude outliers are excluded from the final regression in the robust algorithm, differences between the solutions are visible. The amplitude at zero offset is largest at the Sawan-7 location (Figure 13). The slightly higher decrease of amplitude with offset shows the seismic expression of the best reservoir of the analyzed wells. The extrapolated zero offset value in the Sawan-7 gather is just below -3000. The amplitude value used for the Sawan-4 analysis found -2100 for the gather (Figure 14). This is in the range expected from the water saturation and porosity variation modeling that predicted a decrease by 40%. The correlation coefficient for the robust regression is 0.76, slightly lower than the Sawan-7 location with 0.85. Amplitude decrease with offset is slightly less than at Sawan-7.
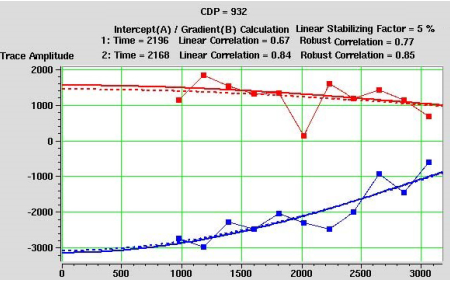
Figure 13 Sawan-7 AVO analysis at 2168 ms. The extracted amplitude values at the trough are shown in blue and at peak are shown in red respectively. The extrapolated zero offset amplitude value is just below -3000.
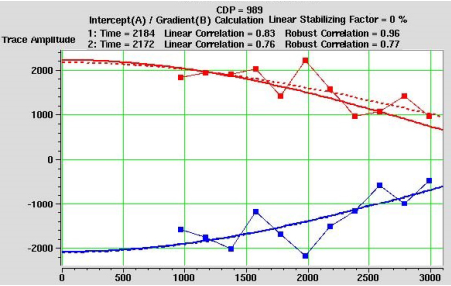
Figure 14 Sawan-4 AVO analysis at 2172 ms. The extracted amplitude values at the trough are shown in blue and at peak are shown in red respectively. The extrapolated zero offset amplitude value is about -2100.
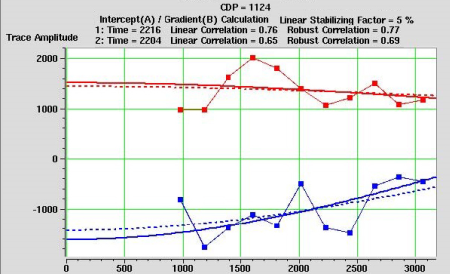
AVO analysis was performed at common depth point (CDP) 1124 of the east-west arbitrary line at 2204 ms (Figure 15). The correlation coefficient, 0.69 for the robust solution, is just a little lower than at Sawan-4. The extrapolated zero offset amplitude is -1600. For a proposed water saturation between 50% and 70%, this amplitude would plot at a porosity of 12% in the near offset reflectivity plot in Figure 8. These single CDP analyses are used to define the robust curve fit to calculate sections of the AVO attributes used for cross plotting, namely Ro, the zero incidence reflectivity and GA, the AVO gradient from the gathers of the selected lines.
AVO cross plotting
Cross plotting of Ro, the zero incidence amplitude with GA, the AVO gradient, allows to classify the anomalies. The modeling focused to search a class IV AVO anomaly. The analysis is carried out in a window (-100 to + 200 ms) defined by the top C-Sand pick. As the seismic data was loaded in 2D mode, the analysis was done separately for each of the extracted lines.
The intercept versus gradient of the E-W line is displayed in Figure 16. The blue polygon delineates the values for the C-sand in the vicinity of Sawan-7. Data points within the polygons defined in the cross plot are highlighted with the colors. It is obvious that the good sand with anomalous Ro and gradient behavior is present only in the vicinity of Sawan-7. At this location only patch of sand behaving similar to the one found at Sawan-4. This indicates that the reservoir quality to be expected at this location will be in the range of the reservoir quality of Sawan-4 at the maximum. It is not expected to reach the sand quality of Sawan-7. The offset from the shale trend depicted by the solid red line indicates Class IV behavior of C-sand. The offset from the shale trend is quite small. Usually, zones need to define when once areas in the cross plot are picked and remembered within the system and could be used for the analysis of multiple lines. These defined zones can be shown in the respective seismic or attribute section.
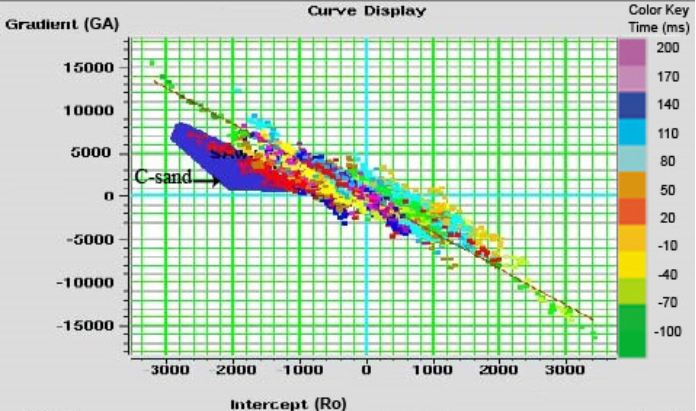
Figure 16 The gradient (GA) versus intercept (R0) at the E-W line AVO cross plot. The time-window cross plot generated from a (-100 to + 200 ms) window around the top C-sand pick. The C-sand values are defined within blue polygon and the solid red line across data points indicates its Class IV behavior.
Conclusions
The availability of dynamic data and improved understanding of statics of the Sawan field reservoir allowed performing AVO modelling and analysis to quantitatively predict the reservoir properties (porosity and water saturation) before drilling future production wells for optimum exploitation of Sawan natural gas resources. The fluid replacement/porosity modelling shows that Ro amplitudes change rapidly with porosity but insignificantly with saturation. A similar picture is visible for far offset reflectivity data. Amplitudes do not change a lot with water saturation. The increase of amplitude with increasing porosity is much more significant. This leads to the conclusion that AVO analyses are prone to find porous sands rather than gas saturated sands. The same can be said for elastic impedance inversion. Anomalies will point out high porosity zones rather than high gas saturation zones. The AVO gradient analyses on single gathers for Sawan-7 and Sawan-4 area show good separation in the Ro reflection amplitudes but a very similar AVO gradient. Ro was strongest for Sawan-7 and weakest for prospect A. From the analysis it can be judged that the sand quality at prospect A is the same or worse than the sand at Sawan-4 location.

