


 text new page (beta)
 English (pdf)
 Article in xml format
 Article references
 Send this article by e-mail
 Cited by SciELO
  Similars in
SciELO
Similars in
SciELO 
 Permalink
Introduction
In multi-disciplinary research ambits, chemical composition of the geological deposits (e.g. sediment, soil and rock) has a variety of applications. Abundance and mobility of different inorganic elements provide useful information about the source of volcanic products (Roy et al., 2012; Arce et al., 2015), identification of provenance and tectonic settings of sedimentary basin (McLennan, 1989; Armstrong-Altrin et al., 2012; Nagarajan et al., 2014; Zhang et al., 2016), estimation of diagenesis, chemical weathering, physico-chemical conditions of depositional environment (Nesbitt and Young, 1982; Cox et al., 1995; Fedo et al., 1995; ElShafeiy et al., 2016), and evaluation of the degree of contamination by anthropogenic activity (Kibria et al., 2016; Retama et al., 2016). Inductively coupled plasma mass spectrometry (ICP-MS), scanning electron microscopy (SEM), atomic absorption spectrometry (AAS) and X-ray fluorescence (XRF) spectrometry are some of the techniques that are used to obtain geochemical data. However, XRF spectrometry is relatively economic and quicker compared to all other earlier mentioned techniques and hence it is one of the commonly used methods in geosciences.
In XRF spectrometry, the primary X-rays interact with a sample and generate secondary X-rays (fluorescence) depending upon chemical composition of the geological material. Intensity of this fluorescence is used to determine concentration of different elements present in the sample (Lozano-Santacruz and Bernal, 2005). Presently, XRF spectrometers can measure wavelength or energy of the reflected X-rays and hence they can be grouped as wavelength dispersive XRF (WD-XRF) and energy dispersive XRF (EDXRF). The conventional or traditional XRF spectrometers (generally WD-XRF) can measure concentrations of a large number of major and minor elements in fused discs and trace elements in pressed pellets. They do not allow recovery of the analyzed samples. However, the portable XRF spectrometers (generally ED-XRF) measure concentration of a limited number of elements in relatively less time. They require smaller amounts of sample and apply simpler preparation techniques. Hence, the samples can be completely recovered for other geochemical and mineralogical analyses.
Over the last couple of decades, several studies were focused on stratigraphic variation of elemental concentrations in sedimentary deposits in order to reconstruct the paleoenvironmental conditions of a location or region (Cheshire et al., 2005; Metcalfe et al., 2010; Roy et al., 2013; Lozano-García et al., 2015; Noble et al., 2016) and also to evaluate the anthropogenic influences in different environments (Ruiz-Fernández et al., 2007; Ontiveros-Cuadras et al., 2014). The temporal variations in elemental contents provide information about varying precipitation/evaporation ratio, strength of aeolian activity, and rate of contaminant inflow. All such research is carried out with sediments recovered through cores and hence the sample size is relatively small. Thus, it is required to reuse the same sample for multiple chemical analyses preferably with application of nondestructive methodologies.
In the present study, we evaluate the data quality of twelve different commonly used elements (Si, Ti, Al, Fe, Mn, Mg, Ca, K, P, Rb, Sr and Zr) in sedimentary research by calculating precision and accuracy of the data generated using a portable ED-XRF (Niton FXL 950). Elemental concentrations were measured in 36 samples of a core collected from the Santiaguillo Basin (state of Durango, Mexico) by two different XRF spectrometers (portable and conventional) that apply two different methodologies (non-destructive and destructive). The main objective is to estimate the difference between data obtained in the portable ED-XRF and conventional WD-XRF using samples of variable matrix (i.e. grain size, texture, carbonate and organic matter content) from the Santiaguillo Basin as a case study.
Study site and sample
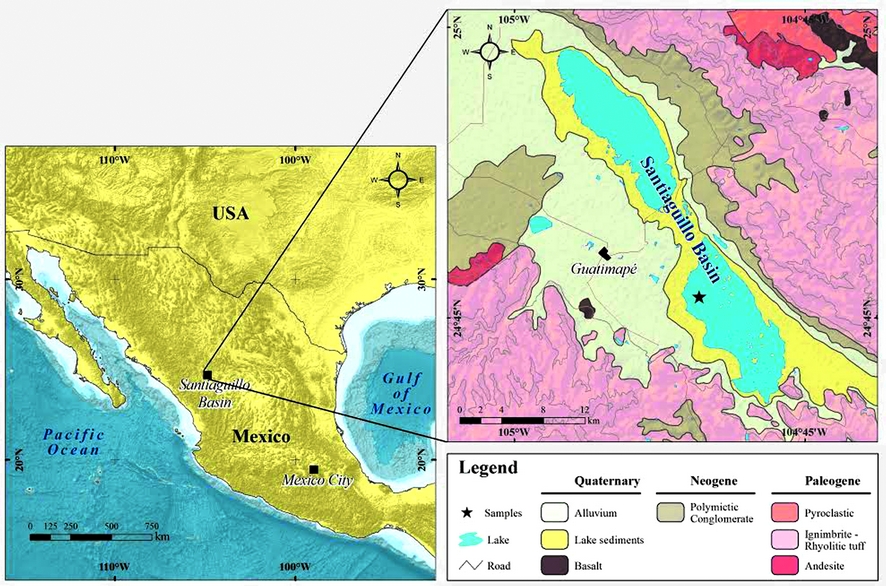
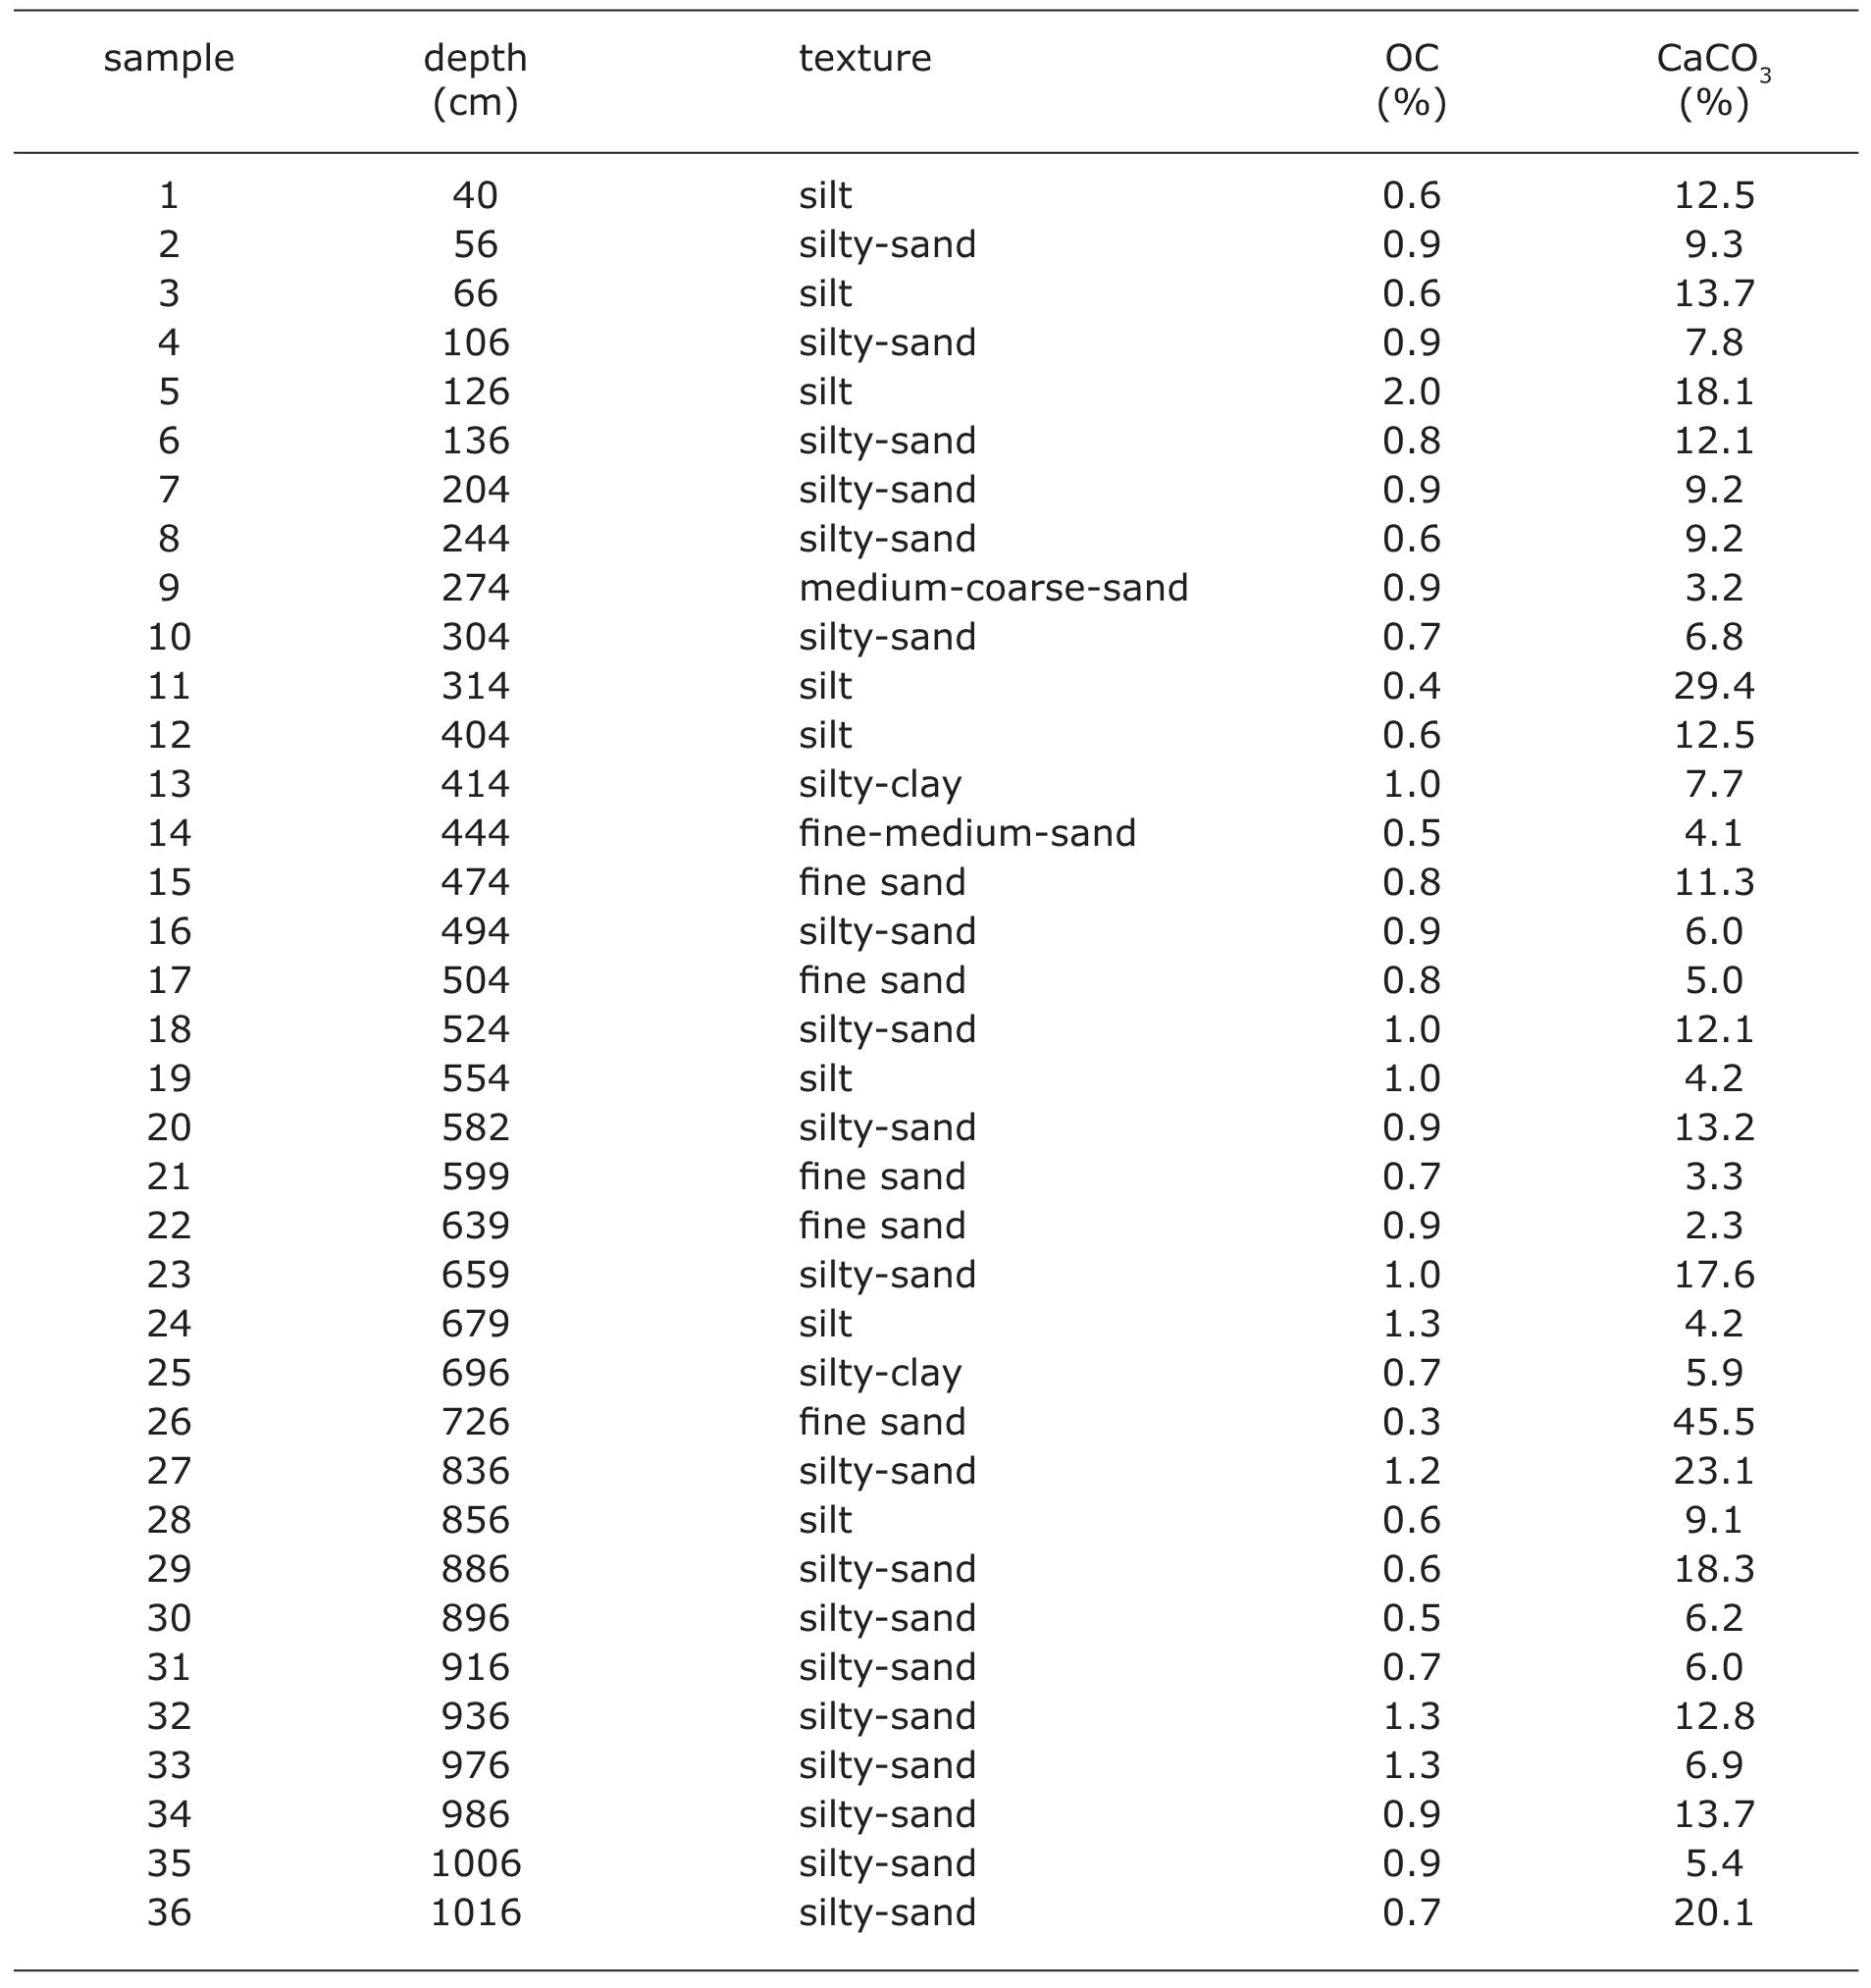
The Santiaguillo Basin (24° 44’ N, 104° 48’ W, 1960 m asl) is located at foothills of the Sierra Madre Occidental Mountains in the state of Durango. It is present at a distance of ~800 km northwest of Mexico City (Figure 1). Catchment of this basin mainly comprises igneous rocks. Both ignimbrite and rhyolite outcrops are present in the surrounding ~2500-3000 m high mountains (Nieto Samaniego et al., 2012). Outcrops of andesite and basalt are exposed to the east and west of the basin, respectively. Additionally, the eastern catchment also hosts smaller outcrops of metamorphic and sedimentary rocks (Munguía-Rojas et al., 1998, not seen in Figure 1). Erosion of all the above-mentioned rocks provides sediments to the basin. A total of 36 different samples were selected from a 10.26 m long previously studied sediment core from this basin. Different grain size (i.e. siltyclay, silt, silty-sand, fine-sand, fine-mediumsand and medium-coarse-sand), 0.3-2.0% of organic carbon (OC) and 2.3- 45.5% of calcite (CaCO3) characterize the variable matrix of the samples (Table 1, Quiroz-Jiménez et al., 2017)
Methodology
Samples were oven dried at 50°C, homogenized and grounded with an agate pestle till a texture similar to clay was achieved. Concentrations of 12 different elements (Si, Ti, Al, Fe, Mn, Mg, Ca, K, P, Rb, Sr and Zr) were measured in two different XRF spectrometers (i.e. portable Niton FXL 950 and conventional Siemens SRS 3000) following different sample preparation techniques. Three different geological reference materials (SRM-2702, SdAR-M2 and SRM2709a) were measured only in the portable Niton FXL 950 XRF spectrometer.
Conventional Siemens SRS 3000 XRF
SRS 3000 is a WD-XRF with X-ray tube made of Rh. Analysis of major and minor elements like Si, Ti, Al, Fe, Mn, Mg, Ca, K and P was carried out using a destructive sample preparation method. It involved mixing 0.8 g dry and powder sediments with 7.2 g of (1:1) LiBO2 and Li2B4O7 mixture and this mixture was fused in a Pt/Au (95:5) alloy crisol as per Lozano-Santacruz et al. (1995). Concentrations of trace elements like Rb, Sr and Zr were measured after preparing pressed pellets from the mixture of 4 g of powder sediment and binder following the instructions of Lozano-Santacruz et al. (1995) and Verma et al. (1996). The loss on ignition was estimated by a gravimetric method after heating 1 g of sample up to 950 °C in porcelain crucible for 1 hour. The measured major elements have precision of <10% (Lozano and Bernal, 2005).
Portable Niton FXL 950 XRF
Niton FXL 950 is an ED-XRF with a 50 kV X-ray tube made of Ag and a Geometrically Optimized Large area Drift Detector (GOLDD). Analysis of elemental concentration was carried out using a non-destructive sample preparation method. Approximately ~5 g dry and powdered sediment was placed in a plastic capsule and it was covered using 4 μm thick polypropylene X-ray film. Samples were analyzed in three different modes (designed for soil sample and metal enriched mining samples) of the equipment and each mode has different filters (i.e. soil mode: main, high and low range filters; mining Cu/Zn mode: main, high, low and light range filters; mining Ta/ Hf: main, high, low and light range filters). We measured each sample for 60 seconds in each filter of the three different modes. Principal difference between the modes is sensibility to different range of elements. For example, the soil mode does not detect lighter elements like Si, Al, Mg and P. However, the mining modes (Cu/Zn and Ta/Hf) can measure all the 12 elements including the lighter elements.
Both the precision and accuracy of the measured elements were determined after measuring elemental concentrations in three different reference materials (SRM-2702, SdAR-M2 and SRM-2709a) in seven repetitions, in all the modes of Niton FXL 950. National Institute of Standards and Technology (NIST) created the reference material SRM-2702 by using inorganic marine sediments and it does not present concentrations of Si, Fe and Zr (NIST, 2016). The United Sates Geological Survey (USGS) created SdAR-M2 using metal rich soil (IAG, 2015) and NIST designed SRM2709a as a reference material for soil, sediment and other geological samples of similar matrix (NIST, 2009).
Results and Discussion
Precision (%RSD)
Precision was obtained from Relative Standard Deviation (%RSD) of each element measured in three different reference materials (SRM2702, SdAR-M2 and SRM-2709a) in three different modes of Niton FXL 950. It was calculated using the formula %RSD=100×(s/X), where s is the standard deviation and X is the mean concentration of each element in seven repetitions. Soil mode did not measure concentrations of Si, Al, Mg, and P, whereas both the mining modes (mining Cu/Zn and mining Ta/Hf) analyzed concentration of all the 12 different elements (Table 2). Independent of matrix of the reference materials, Mg (%RSD=12-35.2) and P (%RSD=2.4-4.3) were the less precise elements in both the mining modes. Ca (%RSD=0.3-1.4) showed variable values of precision in mining Cu/Zn mode and both Ca (%RSD=0.2-1.9) and Al (%RSD=1.0- 2.3) had variable precision in mining Ta/Hf mode. All the other elements had precision of ≤1.1 in the three different modes of analyses.
Soil mode: Fe (%RSD≤0.3) and K (%RSD≤0.4) were the most precise elements, whereas Mn (%RSD=1.4-1.8) was comparatively less precise. All other elements (Ti, Ca, K, Rb, Sr, Zr) had %RSD≤1.0.
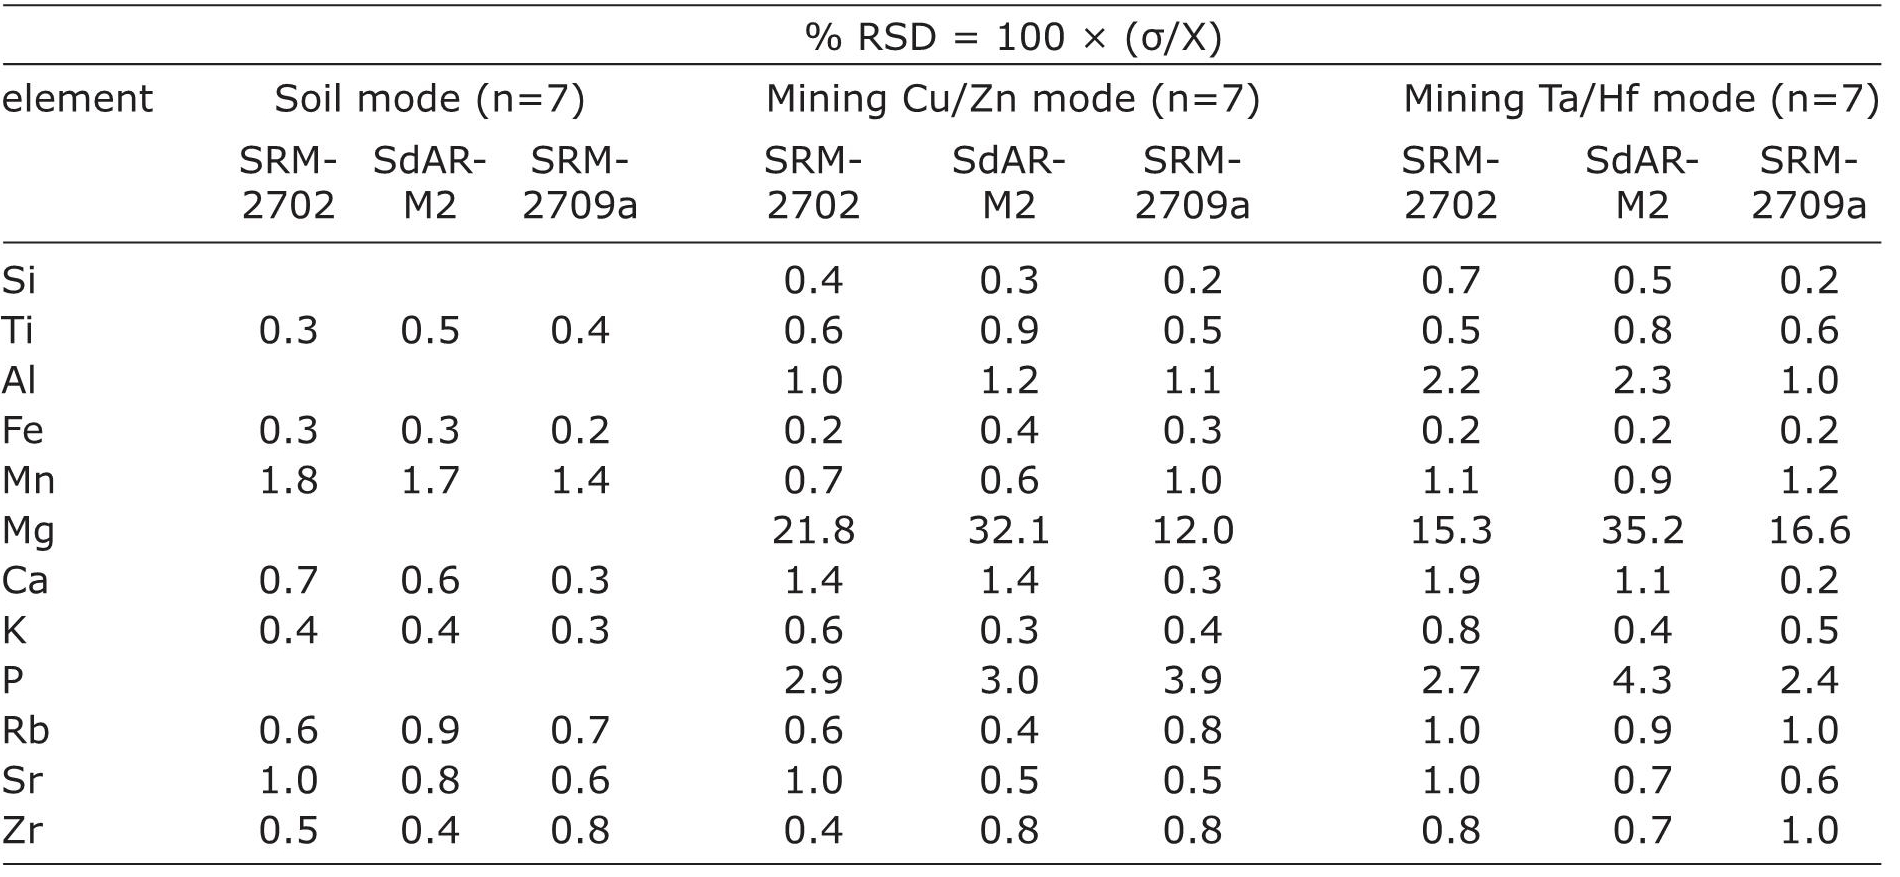
Table 2 Precision of elements calculated for three different modes of Niton FXL 950. It was estimated from Relative Standard Deviation (%RSD) of elemental concentrations measured in three different reference materials.
Mining Cu/Zn mode: Si and Fe (%RSD≤0.4) were the most precise elements and Mg was the least precise element (%RSD>12). Compared to Ti, Al, Mn, Ca, K, Rb, Sr and Zr (%RSD≤1.4), P (%RSD>2.9) exhibited less precision.
Mining Ta/Hf mode: In general, precisions calculated in this mode were comparable to precision calculated for mining Cu/Zn mode. Fe (%RSD=0.2) was the most precise element and Mg (%RSD>15.3) was the less precise. P showed a precision of 2.4 and all other elements had precision of <1.9. Al showed relatively lower precision in this mode (%RSD=1.0-2.3) compared to the mining Cu/ Zn mode (%RSD=1.0-1.2).
Accuracy (%ACC)
Accuracy of elements in three different modes of Niton FXL 950 was obtained by calculating %ACC=(X - Xstd / Xstd) × 100, where X is the mean concentration of an element measured in seven repetitions of a geological reference material and Xstd is the certified concentration of that element. Table 3 presents certified values of elemental concentration in 3 different reference materials and accuracy of 12 different elements calculated for three different modes. The positive values indicate overestimation of an element with respect to the certified value and negative values represent underestimation of an element compared to the certified value.
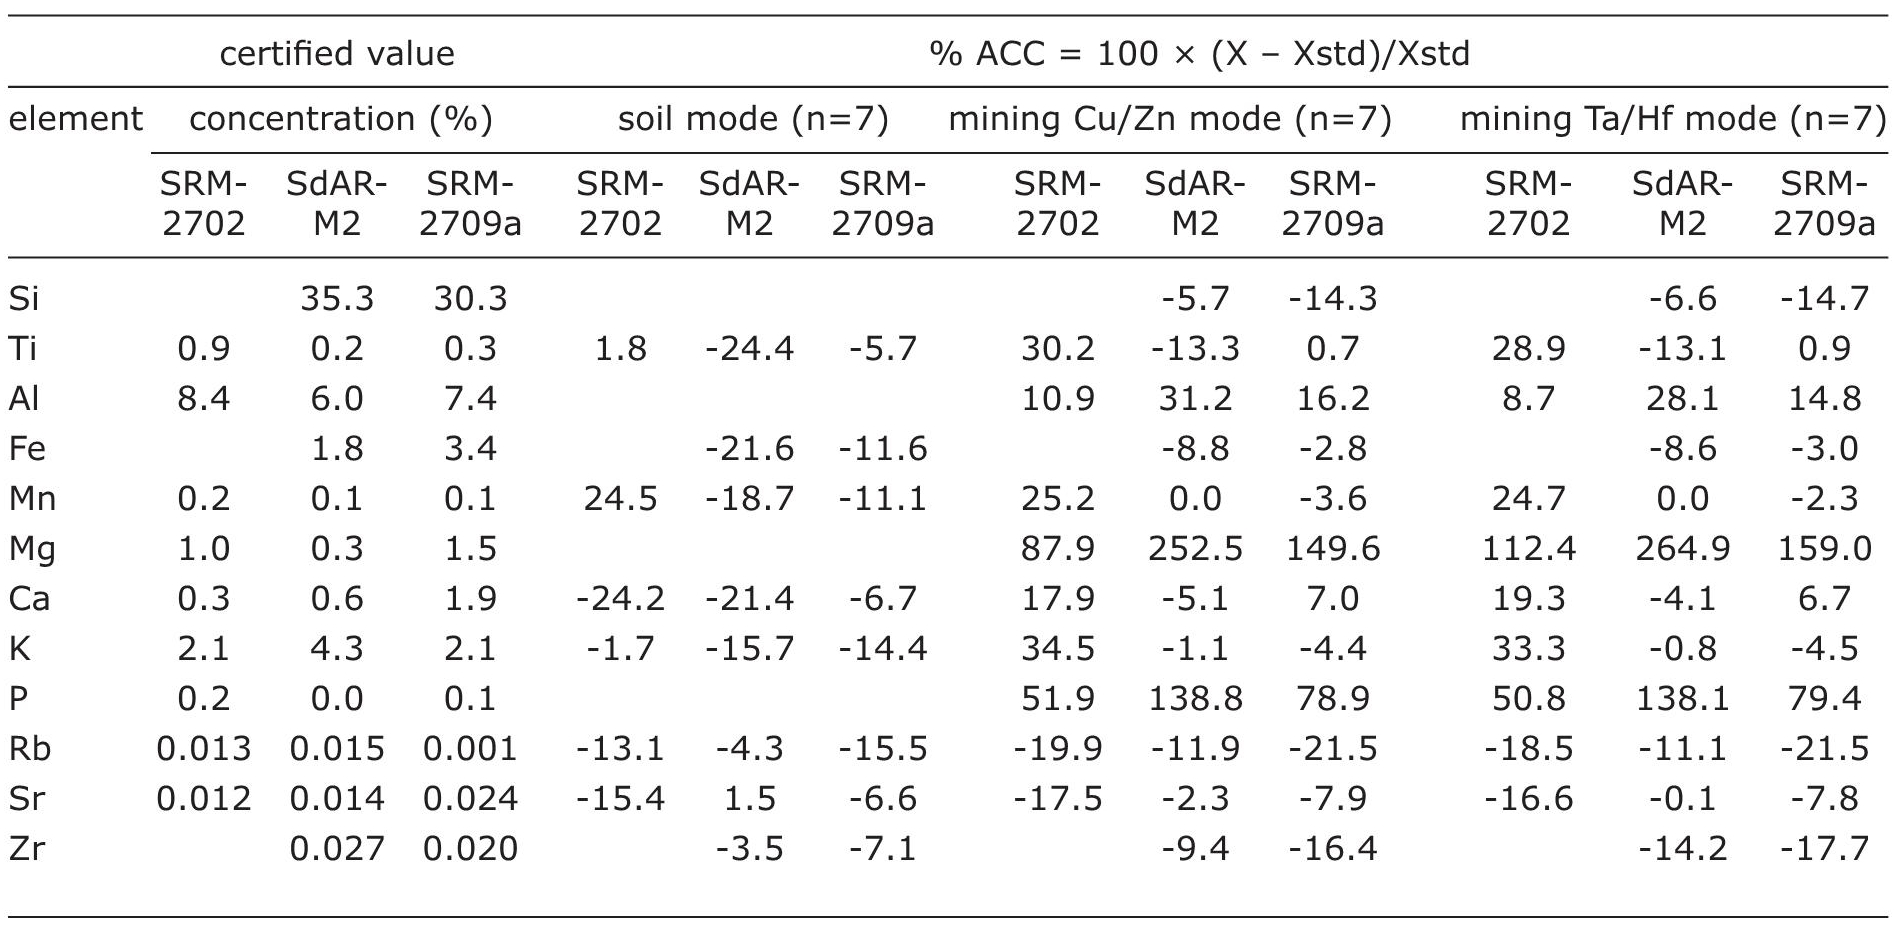
Table 3 Accuracy of elements calculated for three different modes of Niton FXL 950. Mean of the measured values and certified value of three different geological reference materials are used for the accuracy (%ACC) calculation.
Depending upon the geological reference materials, each element showed different values of accuracy even though the analysis was carried out in the same mode. Mg (%ACC up to 252.5) and P (%ACC up to 264.9) showed the highest error in both the mining modes and soil mode did analyze both the elements. Similarly, both the mining modes reported the exact concentration of Mn as reported in the literature (%ACC=0) for the reference material SdAR-M2.
Soil mode: Ti (%ACC=1.8-24.4), K (%ACC=1.7-15.7), Ca (%ACC=6.7-24.2), Rb (%ACC=4.3-15.5) and Sr (%ACC=1.5-15.4) showed variable accuracy. Depending upon the geological reference material, both Ti (%ACC=24.4; SdAR-M2) and Mn (%ACC=24.5; SRM-2702) were the least accurate elements. Ti and K were the more accurate elements (%ACC <10) in reference material SRM-2702, Rb, Sr and Zr were accurately measured in SdAR-M2 and Ti, Ca, Sr and Zr were the more accurate elements measured in SRM-2709a.
Mining Cu/Zn mode: Both Mg (%ACC=87.9- 252.5) and P (%ACC=51.9-138.8) were the least accurate elements. Ti (%ACC=0.7-30.2), Mn (%ACC=0-25.2), Ca (%ACC=5.1-17.9) and Sr (%ACC=2.3-17.5) showed variable accuracy. Si, Fe, Mn, Ca, K, Sr and Zr were accurately measured in SdAR-M2 and Ti, Fe, Mn, Ca, K and Sr were the more accurate elements measured in SRM-2709a. All these elements exhibited %ACC<10.
Mining Ta/Hf mode: Both Mg (%ACC=112.4- 264.9) and P (%ACC=50.8-138.1) were the least accurate elements. Ti (%ACC=0.9-28.8), Al (%ACC=8.7-28.1), Mn (%ACC=0-24.7) and Sr (%ACC=0.1-16.6) showed variable accuracy. Al was the most accurate element (%ACC < 10) measured in reference material SRM-2702, Si, Fe, Mn, Ca, K, and Sr were measured with less error in SdAR-M2 and Ti, Fe, Mn, Ca, K and Sr were the more accurate elements measured in SRM-2709a.
Comparison of portable FRX vs. conventional XRF
Elemental concentrations of sediments collected from the Santiaguillo Basin were measured as a case study and the results obtained both in the portable as well as conventional XRF were compared in order to evaluate the matrix effect (Figures 2 and 3). Samples were powdered and homogenized in order to remove the texture influence. However, different abundances of organic carbon (OC: 0.3-2.0%) and calcite (CaCO3: 2.3-45.5%) suggest matrix of the sediment samples remained variable even after grinding and homogenizing the bulk samples.
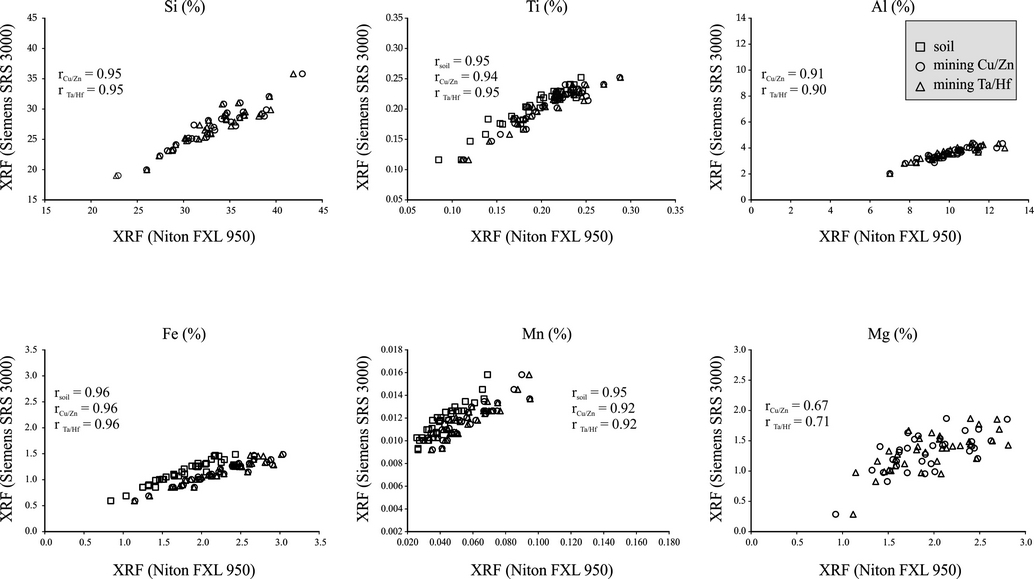
Figure 2 Comparison of concentrations of Si, Ti, Al, Fe, Mn and Mg measured in three different modes of portable (Niton FXL 950) and conventional (Siemens SRS 3000) XRF spectrometers.
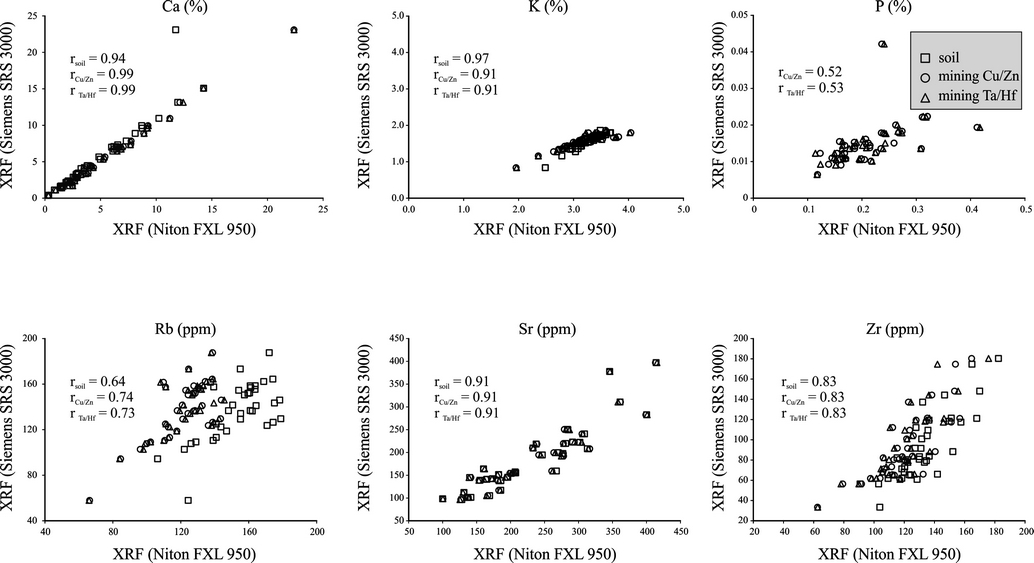
Figure 3 Comparison of concentrations of Ca, K, P, Rb, Sr and Zr measured in three different modes of portable (Niton FXL 950) and conventional (Siemens SRS 3000) XRF spectrometers.
Evaluation of the data obtained with Niton FXL 950 XRF indicates precision of 12) (Table 2). We did not observe significant influences of either the measuring modes of spectrometer or matrix of the sample on precision. Independent of the mode or matrix, the precision remained homogeneous. For example, Ti had precision of 0.3-0.6 and Ca of 0.7-1.9 in reference material SRM-2702 in all the three different modes. Similarly, Ti (0.3-0.5) and Ca (0.3-0.7) exhibited homogenous precision for all the geological reference materials with different matrix in soil mode. However, the measuring modes as well as matrix influenced the accuracy. Ti had an accuracy of 1.8-30.2 in the reference material SRM-2702 in all the three different modes. Concentration of Ca was underestimated in one mode and overestimated in another mode for the same reference material (Table 3).
Accuracies of Ti (0.7-30.2) and P (51.9-138.8) remained heterogeneous for the different geological reference materials with distinct matrices in the mining Cu/Zn mode.
Except for Mg, P and Rb, all other elements exhibited positive and stronger correlation coefficients between concentrations measured using both the XRF spectrometers. Si, Ti, Al, Fe, Mn, Ca, K and Sr (r≥0.9) had relatively higher correlations compared to Zr (r=0.8) (Figures 2 and 3). Correlation coefficients of Mg, P, and Rb remained ≤0.7. In sediments from the Santiaguillo Basin, concentrations of Mg (0.29-1.87 %), P (0.01-0.04 %) and Rb (18-188 ppm) were relatively lower compared to many other elements (e.g. Si and Ca). Lower abundances of Mg, P and Rb might have caused the lower correlations. However, some elements with lower concentrations showed higher correlations. For example, concentrations of Ti and Ca were 0.1% and 0.4% in some samples and both of them exhibited higher correlations. Similarly, Mn (0.01-0.02%) exhibited better correlation compared to P (0.01-004%) even though both had comparable concentrations. Thus, we rule out the influence of abundance on different correlation coefficients exhibited by the elements. The non-linearity of X-ray intensity with concentration of an element is associated with both absorption and enhancement related to the matrix effect (Birks and Harris, 1962; Mitchell and Kellam, 1968). Based on the characteristics of matrix (lighter, heavy and neutral), X-ray intensity of an element can increase, decrease or remain neutral (Mitchell and Kellam, 1968). Birks and Harris (1962) studied Fe and Cr in a chromiteolivine mineral system and observed that X-ray intensity of Fe decreased as absorption coefficient of Cr increased in a matrix with more Cr compared to Fe.
We estimated the difference between results obtained using both the XRF spectrometers by calculating %change=(XFXL-XSRS3000 / XSRS3000) ×100, where XFXL is elemental concentration in the portable XRF and XSRS3000 is concentration of the same element measured in conventional XRF (Table 4). The portable Niton FXL950 XRF overestimated concentrations of some elements and underestimated concentrations of others compared to the conventional XRF. Positive values represent overestimation of an element in portable XRF (in %) and negative values suggest underestimation of an element (in %) compared to the results of conventional XRF. Irrespective of the sample matrix, estimation of the %change was similar for each element in both the mining modes. Estimated difference for the soil mode was distinct compared to both the mining modes. For example, Ti was underestimated in the soil mode and overestimated in both the mining modes. Similarly, Rb was overestimated in soil mode and underestimated in both the mining modes. Fe and Zr were overestimated in all the three modes of analysis. However, the soil mode overestimated Fe to a lesser degree and Zr to a higher degree compared to results obtained in both the mining modes.
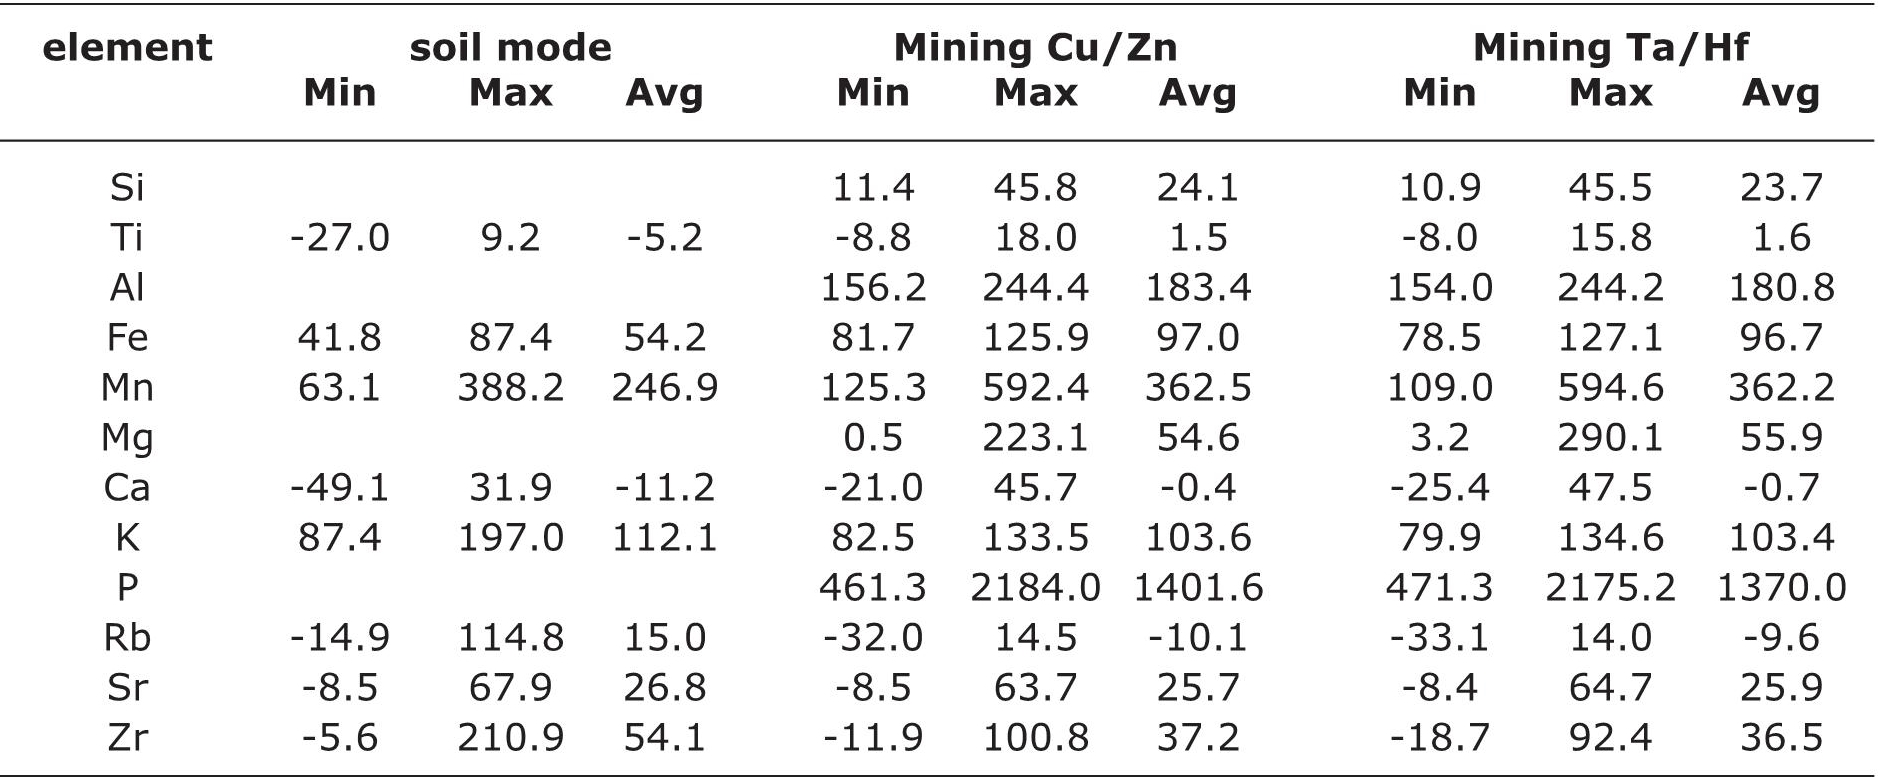
Table 4 Estimation of degree of difference (%change) of elemental concentrations of 36 samples from the Santiaguillo Basin measured in portable Niton FXL 950 XRF compared to conventional XRF (Min=minimum, Max=maximum and avg= average).
Estimated difference for the soil mode was distinct compared to both the mining modes. For example, Ti was underestimated in the soil mode and overestimated in both the mining modes. Similarly, Rb was overestimated in soil mode and underestimated in both the mining modes. Fe and Zr were overestimated in all the three modes of analysis. However, the soil mode overestimated Fe to a lesser degree and Zr to a higher degree compared to results obtained in both the mining modes.
Soil mode: Average values suggest underestimation of Ti (%change=5.2) and Ca (%change=11.2) and overestimation of Mn (%change=246.9) and K (%change=112.1). Concentrations of Fe, Rb, Sr and Zr were overestimated with %Change between 15 and 54.2.
Mining Cu/Zn: Except for Rb, all other elements were overestimated. Both Ti (%change=1.5) and Ca (%change=0.4) showed the least differences and P (%change=1401.6) exhibited the highest difference. Concentrations of Al, Mn and K (%change=103.6-362.5) were more overestimated compared to Si, Mn, Sr and Zr (%change=24.1-54.6).
Mining Ta/Hf: Differences calculated for this mode is similar to the %change estimated for all the elements in the mining Cu/Zn mode (Table 4). Concentrations of Ti and Ca measured in both the mining modes of the portable XRF were almost similar to concentrations obtained in the conventional XRF. Similarly, the concentration of P obtained in portable XRF was overestimated by almost 14 times with respect to the conventional XRF.
We generated linear regression equation for each element after comparing results obtained in both spectrometers and corrected only the concentrations of elements (Si, Ti, Al, Fe, Mn, Ca, K, Sr and Zr) with stronger correlations (r>0.8). Concentrations of elements (Mg, P and Rb) with lower correlations (r≤0.7) were not rectified.
Conclusions
Concentrations of twelve different commonly used elements (Si, Ti, Al, Fe, Mn, Mg, Ca, K, P, Rb, Sr and Zr) in sedimentary research were measured in sediments from the Santiaguillo Basin (state of Durango, Mexico) with variable matrix using a portable ED-XRF (Niton FXL 950) and non-destructive sample preparation technique. This study suggests that concentrations of Si, Ti, Al, Fe, Mn, Ca, K, Sr and Zr can be quickly and economically analyzed in a portable Niton FXL 950 XRF spectrometer and subsequently corrected. Additionally, the use of non-destructive sample preparation technique can be useful to reuse the same sample for multiple other chemical analyses. The main conclusions of our research are:
Except for Mg and P, all other elements had precisions of <2.3. Precision remained homogeneous independently of the measuring mode or matrix. Among the less precise elements, P (%RSD=2.4-4.3) showed better precision compared to Mg (%RSD=12-35.2).
Accuracy was influenced by both the measuring mode as well as matrix. For example, accuracies for Ti (%ACC=0.7-30.2) and P (%ACC=51.9-138.8) were heterogeneous for different geological reference materials with distinct matrices in the mining Cu/Zn mode.
In sediments of the Santiaguillo Basin with variable matrix, concentrations of Mg, P, and Rb measured in the portable XRF exhibited relatively lower correlations for (r≤0.7) with the results obtained in a conventional XRF. Si, Ti, Al, Fe, Mn, Ca, K and Sr showed higher (r≥0.9) correlation coefficients compared to Zr (r=0.8). We rule out the influence of abundance on lower correlation coefficients of some elements. However, the variable matrix of sediments might have caused the lower correlations for Mg, P and Rb.
Elements were either underestimated or overestimated in the portable XRF and we used the linear regression equations to reduce difference between results obtained in both the spectrometers. Elements (Si, Ti, Al, Fe, Mn, Ca, K, Sr and Zr) with stronger and positive correlations were rectified. However, concentrations of Mg, P and Rb with lower correlations suffered from the matrix effect and hence were not corrected.

