


 nueva página del texto (beta)
 Inglés (pdf)
 Artículo en XML
 Referencias del artículo
 Enviar artículo por email
 Citado por SciELO
  Similares en
SciELO
Similares en
SciELO 
 Permalink
Introduction
The Trans-Mexican Volcanic Belt (TMVB) is an east-west trending calc-alkaline volcanic arc related to the subduction of oceanic Rivera and Cocos plates below Mexico along the Middle America trench. The belt is traversed by networks of faults that are nearly parallel and orthogonal to its axis (e.g., Pasquaré et al., 1987; Johnson and Harrison, 1990; Suter et al., 2001). Seismicity in the TMVB is relatively low, and the seismic networks in the region are sparse. As a consequence, source parameters of earthquakes that occur in the TMVB, including their depths and focal mechanisms, are known for only a handful of earthquakes. The occurrence of large earthquakes in the TMVB is well documented. Acambay earthquake of 1912 (MS7.0), which occurred in the central part of TMVB (Urbina and Camacho, 1913), about 100 km WNW of Mexico City, is one example. Jalapa earthquake of 1920 (Mw6.4), near the eastern end of the TMVB, caused many deaths related to a triggered landslide and was damaging to the city (Camacho and Flores, 1922). Suárez et al. (1994) report a large earthquake in 1568 (M~7) in/near Guadalajara in the western part of the TMVB which caused severe damage to the city. A relatively large earthquake occurred on 11 February, 1875 destroying the town of San Cristóbal de la Barranca located about 40 km NNW of Guadalajara (García Acosta and Suárez Reynoso, 1996). Clearly, cities and towns in the Mexican Altiplano are exposed to seismic hazard from earthquakes in the TMVB. A reliable estimation of this hazard, however, will only be possible by performing detailed studies of all well-recorded TMVB earthquakes; fortunately, the reported number of such events is increasing due to improvement in the seismic instrumentation of the region and quick deployment of digital portable seismographs in the field. As examples, recent well-studied earthquake sequences in the TMVB are cited, which occurred in Zacoalco, Jalisco (Pacheco et al., 1999), Sanfandila, Querétaro (Zúñiga et al., 2003), and Morelia, Michoacán (Singh et al., 2012).
In December 2015 and May 2016 an earthquake sequence occurred NNW of Guadalajara. The source region of the sequence is located to the north of the broad triple rift junction formed by NW-SE trending Tepic-Zacoalco, N-S trending Colima, and E-W trending Chapala rifts (Figure 1). The rifts of Tepic-Zacoalco and Colima are forming the northern and eastern boundaries of the Jalisco block which is separating from the North America plate. Active rifting is occurring along these boundaries (e.g., Barrier et al., 1990; Allan et al., 1991; Michaud et al.,1994; Moore et al., 1994). The seismic sequence was recorded in the city by two accelerographs at an epicentral distance of about 20 km. The largest earthquake in the sequence (Mw4.8) occurred on 11 May, 2016, and was strongly felt in the city but caused no damage (R. Meli, personal communication, 2016). This event was also extensively recorded by the broadband seismographic network of the National Seismological Service (SSN). In this paper the source characteristics of some of the larger events of the sequence are studied and the attenuation parameter, Q, along centralwest TMVB is estimated. Taking advantage of the recordings at the two accelerographic stations, an estimation of ground motions from scenario earthquakes of Mw5.5 and 6.0 in the source region of the sequence are performed. The results should be useful in seismic hazard estimation of Guadalajara from normal-faulting crustal earthquakes in the region.

Figure1. a) Tectonic setting of the region. Gray area: Trans-Mexican Volcanic Belt. Rectangles: broadband stations in the belt which recorded 11 May, 2016 (Mw4.8) earthquake. Enlarged map of the area in the black rectangle is shown in b). b) Tectonic setting of west-central Mexico showing the Jalisco block and the rift-rift-rift triple point junction. Triangles: active volcanoes. Squares: accelerographic (GDLC and GDLP) and broadband (AAIG and ANIG) stations in the region. Stars correspond with the approximate epicenters for large historical earthquakes reported in the region. An enlarged view of the rectangular area, the region of interest, is shown on the right. c) Shaded relief map of the area around Guadalajara; its metropolitan area is enclosed within the black contour. Locations of seismic sequences of Zacoalco (1) and Guadalajara (2) are shown by their common focal mechanisms. Modified from Pacheco et al. (1999). Star corresponds with the approximate epicenter for the 1568 earthquake.
Location, focal mechanism, and magnitude
As mentioned before, the sequence began on 15 December, 2015 with an earthquake of magnitude Mw4.1 located ~ 20 km NW of Guadalajara. SSN reported three more events in the next 40 hours. The activity resumed on 11 May, 2016 with a Mw4.8 earthquake, the largest event of the sequence. SSN reported 29 other events in the next 18 days. The closest SSN station which recorded these events was more than 100 km away and the P waves at the SSN stations were highly emergent. The sequence was also recorded by two accelerographs located on the campus of Universidad Panamericana (station GDLP) and Colegio Cervantes (station GDLC) (Figures 1 and 2). These stations are operated by Instituto de Ingeniería, UNAM. Recordings at these stations are made in continuous mode at 100 samples/s. Due to the noise level at these stations (especially at GDLC), very high during traffic hours at frequencies above about 8 Hz, data are useful for M ≥ 3.0 events only. However, a few earthquakes of smaller magnitudes also produced useful recordings when they occurred late at night or early in the morning. In total there were eight well-recorded events at these stations. These events, along with PGA, PGV, and PGD values, are listed in Table 1. We note that many historical monuments of the city, including the cathedral, are located only ~ 2 km eastward of the station GDLC (Figure 2). Hence, it is likely that the ground motions near these monuments were similar to those recorded at the station GDLC.
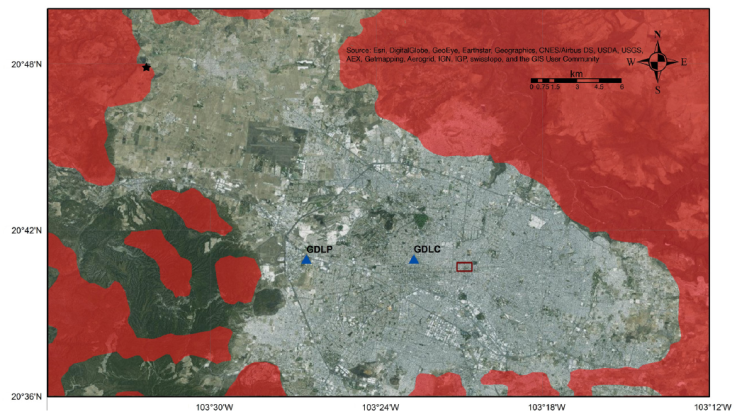
Figure 2 Map of Guadalajara and vicinity. Star: the epicenter of 11 May, 2016 (Mw4.8) earthquake. Triangles: accelerographic stations (GDLP and GDLC). Rectangle: area of famous monuments of the city. The red shaded area corresponds with presence of igneous intrusive rocks.
Table 1 PGA, PGV, and PGD of well-recorded events at two near-source stations (R ~ 20 km) during the December 2015 and May 2016 Guadalajara earthquake sequence.

1GDLP: Guadalajara, Universidad Panamericana.
2GDLC: Guadalajara, Colegio Cervantes.
Figure 3 shows displacement seismograms at the station GDLP of six of the eight earthquakes listed in Table 1. The traces begin 0.5 s before the P-wave arrival. The vertical dotted lines in the top three frames indicate arrival of P and S waves. (S-P) time of the events which occurred during December 2015 is 2.5 s. The remarkable similarity of the waveforms and nearly the same (S-P) times of these events suggest nearly the same location and focal mechanism of these events. The bottom three frames correspond to the activity in May 2016. The largest shock of the sequence (11 May, 2016, Mw4.8) appears somewhat complex but still with (S-P) time of 2.5 s. Although the waveform of 15 May, 2016 event (bottom, second frame) differs somewhat from the others (probably reflecting its greater depth as reflected in the impulsive P wave), its (S-P) time is still about 2.5 s. The (S-P) time of the smallest event shown in the figure (bottom, third frame) is 0.1 s less than the others, suggesting its location ~1 km closer to the station than others.

Figure 3 Displacement seismograms at the station GDLP of six of the larger earthquakes of the sequence which had clear signal at the station. Traces begin 0.5 s before P-wave arrival. Vertical dotted lines in the top three frames indicate the arrival of P and S waves, respectively. (S-P) time for these events, which occurred in December 2015, is 2.5 s. The remarkable similarity of the waveforms and nearly the same (S-P) times of these events suggest nearly the same location and focal mechanism of these events. The bottom three frames correspond to the activity in May 2016. The largest shock of this sequence appears complex but still with (S-P) of 2.5 s. Although the waveform of 15 May, 2016 event (second bottom frame) differs from others (probably reflecting its larger depth; note the impulsive P waves), its (S-P) time is still about 2.5 s. (S-P) time of the smallest event shown in the figure (bottom third frame) is 0.1 s less than the others, suggesting that it was located about 1 km closer to the station than others.
The largest event of the sequence (11 May, 2016; 22:35) was located using P and S phases at the two local accelerographic stations and many broadband stations of SSN (distance > 100 km). Because of its size, this was the best-recorded event. Even so, the first motions could be read only at a handful of stations. The seismograms were converted to Seisan format (Havskov and Ottemöller, 1999) and the earthquake was located using the algorithm of Lienart and Havskov (1995) yielding the epicenter at 20.798 ºN, 103.539 ºW, with a poorly constrained depth of 8 km. Given the similarity of (S-P) times and the waveforms (Figure 3), we conclude that the earthquakes in Table 1 (and most of the events during the entire sequence) were tightly clustered, probably within a volume of 1 to 2 km radius.
The fault parameters of the 11 May, earthquake were determined by performing regional moment tensor (RMT) inversion using an algorithm implemented by A. Iglesias at the Servicio Sismológico Nacional (SSN, Mexican National Seismogical Service). The method is described in some detail in UNAM Seismology Group (2010). System chooses appropriate broadband stations according to reported magnitude. Records from stations relatively close to the epicenter are discarded to avoid finite fault effects, and stations far from the epicenter are discarded to ensure good signal to noise ratio. Records of selected stations are integrated to obtain displacements and are band-pass filtered using frequencies that depend on magnitude criteria. This procedure tries to use low frequencies (where displacement spectrum is flat), avoiding high frequencies at which the structure is poorly known. Selected seismograms are inverted using a time domain scheme implemented by Dreger (2003). Computation time is dramatically reduced using a set of stored Green functions, which are computed at nodes of a grid of distances vs. depths and using an average S-wave velocity model. For Mexico, the SSN uses a model reported by Campillo et al. (1996).
The regional centroid moment tensor solution of the 11 May, earthquake reported by the SSN yields the following fault parameters: strike φ = 21º, dip δ = 49º, strike λ = -86º, and M0 = 1.8x10¹⁶ Nm (Mw4.77). An inversion using a different combination of broadband stations φ = 2º, δ = 49º, λ = -123º, with M0 = 9.9x10¹⁵ Nm (Mw4.60). As illustrated in Figure 4, both of these mechanisms are consistent with the first motion data; both show a nearly horizontal tensional axis trending ~ 110º. The figure also shows displacement traces of the earthquake at the station GDLP along with infinite space synthetics (Singh et al., 2000) corresponding to the two mechanisms. In these synthetics the effect of the free surface is approximately taken into account by multiplying infinite-space synthetics by two. The first solution above ( φ= 21º, δ= 49º, λ= -86º) provides a better fit to the observed S pulse and is our preferred focal mechanism. We note that the mechanisms in Figure 4 differ from those reported 60 km to the south in the Zacoalco graben during the seismic sequence of 1997, which involved a NESW extension, consistent with the orientation of the rift (Pacheco et al., 1999).

Figure 4 (Top) Focal mechanism of 11 May, 2016 earthquake. Two regional CMT solutions, using a different combination of broadband stations, are shown. First motions agree with both solutions. (Bottom) Displacement traces at station GDLP and infinite space synthetics corresponding to the two regional CMT solutions.
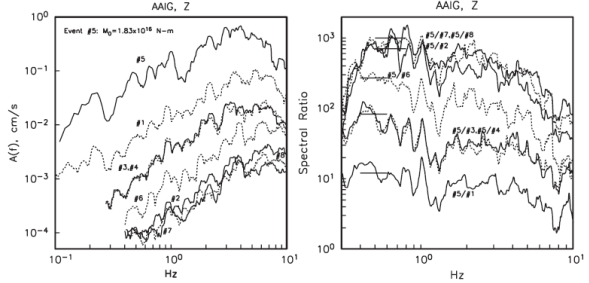
Figure 5 (Left) Fourier acceleration spectra (Z-component) of eight earthquakes at station AAIG (Figure 1). (Right) Spectral ratios of May 11, 2016 event (Mw4.8) with respect to the other seven events. As the seismic moment of 11 May, 2016 is known (M0 = 1.83x10¹⁶ Nm), the ratios at low frequencies yield an estimate the moment (hence Mw) of the other seven events (Table 1).
To estimate the magnitudes of smaller events of the sequence listed in Table 1, Fourier acceleration spectra of the Z-component at the broadband station AAIG in Aguascalientes (Figure 1) was computed. All events listed in Table 1 were well recorded at this station. The spectra and the spectral ratios of 11 May, 20016 earthquake with respect to each of the other seven events are illustrated in Figures 5a and 5b, respectively. Taking the seismic moment of the 11 May earthquake as 1.8x10¹⁶ Nm, we estimated moments (hence Mw) of other events from the level of spectral ratios at low frequencies. Table 1 lists Mw of all events. If we take M0 = 9.9x10¹⁵ Nm for the 11 May earthquake, as obtained from the second regional CMT solution, then Mw of all events will be 0.18 unit less.
Q along the Central-West TMVB
Attenuation parameter, Q, in the central and eastern TMVB has been studied by several authors. As discussed by Singh et al. (2007), the reported estimates of Q are inconsistent among the studies (see Figure 6). To our knowledge, no estimation of Q is available for the central-west segment of the TMVB.

Figure 6 Q-1( f ) of central-west TMVB estimated in this study (dots) and in other segments of TMVB reported in previous works. For comparison, Q-1 of Lg waves in the forearc region is also shown. Modified from Singh et al. (2007).
The earthquake of 11 May, 2016 was recorded by eight broadband seismographs in the TMVB, extending from Ahuacatlán, near Ceboruco volcano (station ANIG) in the west and to Popocatepetl volcano (station PPIG) in the east, covering a distance range of about 650 km (Figure 1a). We use this dataset, along with the accelerograms in Guadalajara, to obtain a preliminary estimate of an average Q for the central-west TMVB. Note that we have included data from station AAIG in the analysis even though the wave path is not entirely through the TMVB. A procedure which has been used before in similar studies was used (e.g., Singh et al., 1982; Ordaz and Singh, 1992; García et al., 2004). Here the method is briefly described.
The Fourier acceleration spectral amplitude, A(ƒ, R), of the intense part of the ground motion of an event at distance R, considering the far-field point-source approximation, can be written as

where,
 2
2
In equations above, Ṁ0 (ƒ) is the moment rate spectrum so that Ṁ0 ( ƒ )→M0 (the seismic moment) as ƒ → 0, R = hypocentral distance, Rθf = average radiation pattern (0.55), F = free surface amplification (2.0), P takes into account the partitioning of energy in the two horizontal components (1 / √2 ), b = shearwave velocity at the source (taken here as 3.5 km/s), r = density in the focal region (assumed 2.85 g/cm3), and Q( ƒ ) = quality factor, which includes both anelastic absorption and scattering. The attenuation in the nearsurface layer and the finite bandwidth of the observed spectrum imposed by the sampling rate are accounted by the parameter k (Singh et al., 1982; Anderson and Hough, 1984) and/ or the Butterworth filter, B( f ). Following Boore (1983), we take B( ƒ ) = (1.0 + (ƒ / ƒm)8)-0.5. We will assume that κ is independent of R. Site (ƒ) in Equation (1) is the local site effect. We take the geometrical spreading term, B( R ), in Equation (1) as 1 / R for R≤ 100 km and 1 / (100R)0.5 for R> 100 km. Taking logarithm of Equation (1) yields:

The terms in the first square bracket on the right-hand side depend on f but are independent of distance R. Equation (3) was solved in the least squares sense to obtain Q-1( ƒ) and the quantity in the first square bracket at each frequency. Isolating the source acceleration spectrum, ƒ2 Ṁ0 ( ƒ ) would require knowledge of Site ( ƒ ), k , and fm. Here the only interest is Q-1. Figure 6 shows Q-1 as a function of f. A least squares fit to the data in the frequency range 1 - 8 Hz yields Q( ƒ ) = 141ƒ 0.63. The figure also shows Q-1( ƒ ) for the TMVB reported in previous studies and that obtained by Ordaz and Singh (1992) for interplate earthquakes in the forearc region of Mexico. As expected, a stronger attenuation (low Q) is, generally, observed in the TMVB than in the forearc region. However, as mentioned earlier, there is a large variation in the reported Q-1( ƒ ) in the TMVB. This may partly reflect smaller scale variation in the attenuation. Unfortunately, there are large differences in the reported Q-1( ƒ ) for the same region also (see, e.g., the values reported for the central or the eastern MVB in Figure 6). Thus, the variability in the reported Q-1( ƒ ) is partly also due to the difference in the data set as well as the methodology used in the analysis.
Ground motion in Guadalajara during larger, postulated earthquakes
Observed PGA, PGV, and PGD at GDLP and GDLC during the Guadalajara sequence are plotted as a function of Mw in Figure 7. It is clearly of practical interest to estimate these ground motion parameters for postulated larger earthquakes which may occur in the same source region. Here the motions from Mw ≤ 6.0 events are estimated. The occurrence of a Mw5.5-6.0 earthquake in the same source region as the sequence or within R~20 km from the center of Guadalajara certainly does not seem farfetched. The San Cristóbal de la Barranca town, which suffered destruction (García Acosta and Suárez Reynoso, 1996) during the 11 February, 1875 earthquake is ~ 30 km NNE of the source region present sequence. The region is seismically active with potential for large earthquakes; thus it is relevant to estimate plausible ground motions during the scenario earthquakes. In this paper, two techniques were used, one based on random vibration theory (RVT) and the other exploiting summation of empirical Green’s functions (EGFs).

Figure 7 Observed, horizontal PGA, PGV, and PGD at stations GDLP and GDLC, located in Guadalajara (R~20 km), as a function of Mw. The curve shows prediction from RVT (see text). Circles indicate synthesized peak motions for postulated earthquakes of Mw5.5 and 6.0 using recordings of 15 December, 2015 (M4.1) as empirical Green’s functions.
Estimation based on RVT
If the Fourier’s acceleration amplitude spectrum A( ƒ, R) and duration of the intense ground motion at a site can be estimated, then the peak ground motion parameters can be obtained through the application of RVT (see Boore, 2003 for an extensive review of the method). Here, A( ƒ, R) was estimated using Equation (1). We assume that the sources follow Brune ω-2 model, i.e.,

where M0 is the seismic moment, and fc is the corner frequency which is related to the source radius, α, by fc = 2.34 β/ 2 πa (Brune, 1970). The radius, in turn, is related to stress drop, Δσ , by Δσ = (7/16)(M0/α3). We further assume that Δσ is constant and equals 100 bar. As estimated above, we take Q( f ) = 141ƒ 0.63. An inspection of spectra at stations GDLP and GDLC suggest fm = 18 Hz. The high-frequency fall off of the observed spectra additionally requires k = 0.01 s. The spectrum was first computed using the parameters above and Equation (1) but neglecting the site amplification term, i.e., assuming Site( f ) = 1. The ratio of observed to the computed spectrum yields an estimate of Site( f ). The process is illustrated in figures 8a and 8b which show median and plus/minus one standard deviation curves of the observed horizontal spectra at stations GDLP and GDLC for 15 December, 2015 (Mw4.1) and 11 May, 2016 (Mw4.8) earthquakes, respectively. The figures also show the computed spectrum assuming Site ( ƒ ) =1. The ratio of the observed median spectrum to the computed spectrum, Site( ƒ ), is shown in Figure 8c for the two events, along with the median Site( f ). We use the median Site( ƒ ) in Equation (1) to estimate median A(ƒ,R) at stations GDLP and GDLC. A critical parameter needed in the application of RVT is the duration of intense part of the ground motion, Ts, which was taken as Ts = 1/fc+ 0.05R + C, where R is in km. We take C = 3.0 based on an earlier analysis of an earthquake sequence in Morelia (Singh et al., 2012). we note that C = 0 in the relation proposed by Herrmann (1985). The predicted PGA, PGV, and PGD curves as a function Mw are shown in Figure 7. The dashed curves in the figure correspond to twice and half the predicted RVT curve. These curves bracket most of the observed data. From RVT simulation, the expected PGA, PGV, and PGD at the accelerographic stations from a Mw6.0 earthquake in the source region of the sequence with Δσ = 100 bar are 195 cm/s2, 10 cm/s, and 3 cm, respectively. The computations with Δσ = 30 bar and 300 bar were repeated. The estimated values fall between the dashed curves in Figure 7. Assuming 30 to 300 bar as the likely range for the stress drop, then the dashed curves in Figure 7 provide the range of the expected peak values.

Figure 8 (a) Median and plus/minus one standard deviation of observed Fourier acceleration spectra (horizontal components) at stations GDLP and GDLC during the 11 May, 2016 (Mw4.8) earthquake. Also shown are corresponding theoretical spectra assuming ω -2 Brune source model with Δ σ = 100 bar, Q( f ) = 141f 0.63, f max = 18 Hz, and k= 0.01 s and ignoring the site effect. (b) Same as (a) but for the 15 December, 2015 (Mw4.1) earthquake. An estimation of median site effect at stations GDLP and GDLC is obtained from the ratio of observed to theoretical spectra. (c) Estimated site effects during 15 December, 2015 and 11 May, 2016 earthquakes. The continuous curve shows the median site effect.
Estimation based on random summation of empirical Green’s function
The recordings of a smaller earthquake can be used as empirical Green’s functions (EGFs) to synthesize expected ground motions during a postulated larger earthquake in the same source region. Here we use the recorded motion at the station GDLP during the 15 December, 2015 earthquake (Mw4.1) as the EGF. We follow method proposed by Ordaz et al. (1995) which assumes that far-field and point-source approximations are valid. The summation scheme obeys the ω 2-source scaling law at all frequencies and produces realistic time histories. The method requires specification of only the seismic moments and the stress drops of the EGF and the target events. Here we assume the same stress drop, Δσ , for the EGF and target events and take it as 100 bar. Figure 7 shows synthesized peak ground motions on NS and EW components (average of 30 simulations) for the postulated Mw 5.5 and 6.0 earthquakes. The peak values follow the trend of the recorded data and are in agreement, within a factor of two, with the RVT predictions. Simulated motions assuming Δσ of 30 and 300 bar are, generally, lower and higher by about 20 to 40%, respectively.
The EGF recordings and sample simulated time histories corresponding Mw5.5 and 6.0 earthquakes are displayed in Figure 9. The simulated traces appear realistic. They provide an estimate of expected ground motions in the center of Guadalajara during these scenario earthquakes.

Figure 9 (Top frames) Acceleration, velocity, and displacement traces at station GDLP during the 15 December, 2015 earthquake used as EGFs. (Middle frames) Synthesized motions for a postulated Mw5.5 earthquake. (Bottom frames) Synthesized motions for a postulated Mw6.0 earthquake. Stress drops of the EGF and target events have been taken as 100 bar. Sample time histories are one realization of the synthesis.
Discussion and Conclusions
The similarity of waveforms and constant (SP) time of 2.5 s at the accelerographic station GDLP for all well-recorded eight events of the earthquake sequence suggest that the activity was confined to a small volume, probably about 1 to 2 km in radius, and the focal mechanisms were nearly the same. The focal mechanism of the largest earthquake of the sequence (11 May, 2016; Mw4.8) reveals normal-faulting on a NNE-SSW oriented fault, with a nearly horizontal T axis trending ~ 110º. This mechanism is not consistent with the NE-SW direction of motion measured on fault strike by Barrier et al. (1990) ~ 35 km WNW of Guadalajara.
The sequence occurred in a region where Sierra Madre Occidental volcanic province abuts the TMVB. About 80 km north of Guadalajara, near the town of Teul, large NNE trending 22 - 27 Ma old normal faults have been mapped (Moore et al., 1994). -N-S trending normal faults (age < 10 Ma) are found about 50 km north of Guadalajara near the town of San Cristóbal. According to Moore et al. (1994) the trend of these faults suggests a reactivation of older Basin and Range structures. It is possible that the present earthquake sequence occurred on one these reactivated structures.
From an analysis of the recordings of the largest event of the sequence, we obtain an estimate of the attenuation parameter, Q, in the central-west TMVB as Q = 141ƒ 0.63. We note that this estimate is preliminary, as it is based on only one event. However, given the uncertainty in the regression, the trend is not expected to change appreciably if, and when, more data are available and are included in a similar analysis. Previous estimations of Q in the TMVB have been limited to the central and eastern segments. They differ significantly among the studies. The present Q estimate is somewhat higher than those reported in the central TMVB for paths crossing the Valley of Mexico. The Q reported here is an average over a 650 km-long path; it may be much lower for short paths crossing active volcanoes. Almost all Q estimates for the TMVB are smaller than that in the forearc region of Mexico. Lower Q (higher attenuation of seismic waves) in the TMVB may be attributed to heating and partial melting of crustal material, presence of fluids, and enhanced scattering from heterogeneities and fractures resulting from active tectonics of the volcanic belt.
Damage caused by large historical earthquakes of 1568 and 1875 are a testimony to the seismic hazard faced by Guadalajara. The causative faults of these events, however, are not known and the magnitudes are uncertain. There is also infrequent seismic activity at a small-magnitude level in the city. Ordoñez (1912) reported a swarm-like local seismic activity. Whether the activity in the city is diffused or confined to some structures is unknown. As a result of these uncertainties, scenario earthquakes for the city are difficult to postulate. Clearly, a dense seismic network is needed in and around the metropolitan area of Guadalajara which has a population of about 4.5 million. Such a network, along with paleoseismic studies, may go a long way in identifying active faults in the region and, hence, in realistic estimation of seismic hazard. In this study, we have taken advantage of the strong motion recordings in Guadalajara during the recent seismic sequence and have estimated ground motions from Mw ≤ 6 scenario earthquakes in the same source region. The ground motion estimates obtained from RVT and EGF techniques are in reasonable agreement with each other. These are some of the likely scenario earthquakes. The parameters used in the simulation were obtained from the strong-motion recordings. They could also be useful in the simulation of motions from other postulated scenario earthquakes.

