


 nueva página del texto (beta)
 Inglés (pdf)
 Artículo en XML
 Referencias del artículo
 Enviar artículo por email
 Citado por SciELO
  Similares en
SciELO
Similares en
SciELO 
 Permalink
Introduction
The Gulf of California, Mexico, is a complex tectonic zone where the peninsula of Baja California is separating from the continent. This active zone has generated moderate earthquakes which have affected cities on both sides of the gulf. In 2012, an M6.0 earthquake affected the city of Los Mochis, where damages in the regional hospital were reported. Last earthquake occurred on September, 2015 (MW6.7).
Social and economic effects resulting from earthquakes can be reduced through seismic risk analysis. The elaboration of good quality hazard maps is required. To do this, studies of source characteristics and wave propagation are essential. Attenuation is an important factor to such studies.
Attenuation of seismic waves has been widely studied in different regions around the world since Aki and Chouet (1975) and Sato (1977) introduced their theories on coda waves attenuation (Q). Different tectonic regions around the world (e.g., volcanic, active, stable) have been characterized by their Q-1 values (Pulli, 1984; Jin et al., 1985; Wiggins-Grandison and Havskov, 2004, among others). In Mexico there are attenuation studies mostly for the south and southeastern for the subduction zones of the Rivera and Cocos plates (Castro and Munguía, 1993; Ordaz and Singh 1992; Domínguez et al., 2003, among others) and for the northwestern zone of Mexico for the Gulf of California region (Domínguez et al., 1997; Castro et al., 2008).
In the present study, Sato’s formulation (Sato, 1977) was used to estimate Qc at the central zone of the Gulf of California.
Data from 6 stations of the NARS-Baja network (Network of Autonomously Recording Seismographs of Baja California) installed by Utrecht University, CALTECH and CICESE (Centro de Investigación Científica y Educación Superior de Ensenada Baja California, México) during 2002 were used. This region was chosen due to its implication in terms of civil protection for the cities on both sides of the Gulf. The correlation of the results with the morphology and tectonics of the region is also presented.
Tectonic Setting and Seismicity
The Gulf of California forms an obliquedivergent boundary between the Pacific and North America plates. Relative motion between the peninsula of Baja California and North America plate in the southern gulf is about 46 mm/yr (Plattner et al., 2007). It consists of a system of linked transform faults and short spreading centers forming basins (Lonsdale, 1989). Deformation accommodates in oblique faults to the north and transform faults to the south (Fenby and Gastil, 1991; Nagy and Stock, 2000). Northern basins are shallower than those to the center and southern basins (Curray et al., 1982; Lonsdale, 1989; Persaud et al., 2003).
In the north zone of the Gulf, an incipient spreading center begins in the Wagner basin (Persaud et al., 2003) developed from Cerro Prieto and Wagner transform faults, and ending in the south with the East Pacific Rise which corresponds to the northern limit of the Rivera plate.
Lonsdale (1989) suggested the presence of a transitional crust at the Guaymas basin in the middle sector of the Gulf of California. In this location, there is a high rate of sedimentation, which promoted the development of a basin containing sills and altered sediments.
Most of the seismicity is distributed in the NW-SE direction along the axis of the Gulf of California, following a linear trend that, from north to south, steps southward near the main basins (Wagner, Delfin, Guaymas, Carmen, Farallon, Pescadero, and Alarcon) and spreading centers. Seismicity in the northern zone has low magnitude (Castro et al., 2007) but increases to the south reaching magnitudes of M>6 such as the 2010 and 2015 earthquakes that occurred near (south) parallel 25º N, or the 1992 earthquake (M7.0), which is the greater earthquake ever recorded in this zone (Pacheco and Sykes, 1992).
Only good quality data (high signal/noise ratio) was used from five years recording which included 4 moderate events (M>5) and their aftershocks (Figure 1).

Method
Sato’s (1977) formulation was used to estimate Qc through measurements of the amplitude decay of coda waves with time. The model assumes a source embedded in an infinite medium populated by a random distribution of scatterers in an infinite volume and crosssectional area σ. The density of energy in terms of root mean square (rms) amplitude, scattered by the inhomogeneities on the surface of an ellipsoid whose foci are the source, and the receiver can be expressed as
 1
1
where A is the rms amplitude of the coda wave, Ω ( w ) is the total energy radiated by the source within a frequency band, r is the distance between the source and the receiver, K(α) = 1/α ln[( α +1)/( α −1)] and α = t / t s , t is the elapsed time of the coda wave, ts is the elapsed time of the S wave, both measured from the earthquake origin time. L = 1/Nσ is the mean free path.
Usually (1) is expressed as the linear function
 2
2
where the quality factor Q can be obtained from the slope of the linear fit of the logarithm of the observed amplitude (root mean square amplitude) of the coda wave vs t for the frequency ƒ.
Data
Records from the three components of six stations of NARS were used (Trampert et al., 2003). Each station consists of a 3-channel, broad band STS-2 sensor (velocity) connected to a 24 bit resolution recorder. 20 samples per second are recorded. For this reason the analysis was restricted to frequencies below 10 Hz.
Records from 2003 to 2007 were available. From this database only events recorded by at least four stations, presenting no saturation, showing high signal/noise ratio (>5) and no overlapping with other events (case of aftershocks) were selected to ensure good quality data. An example of a record is shown in Figure 2.
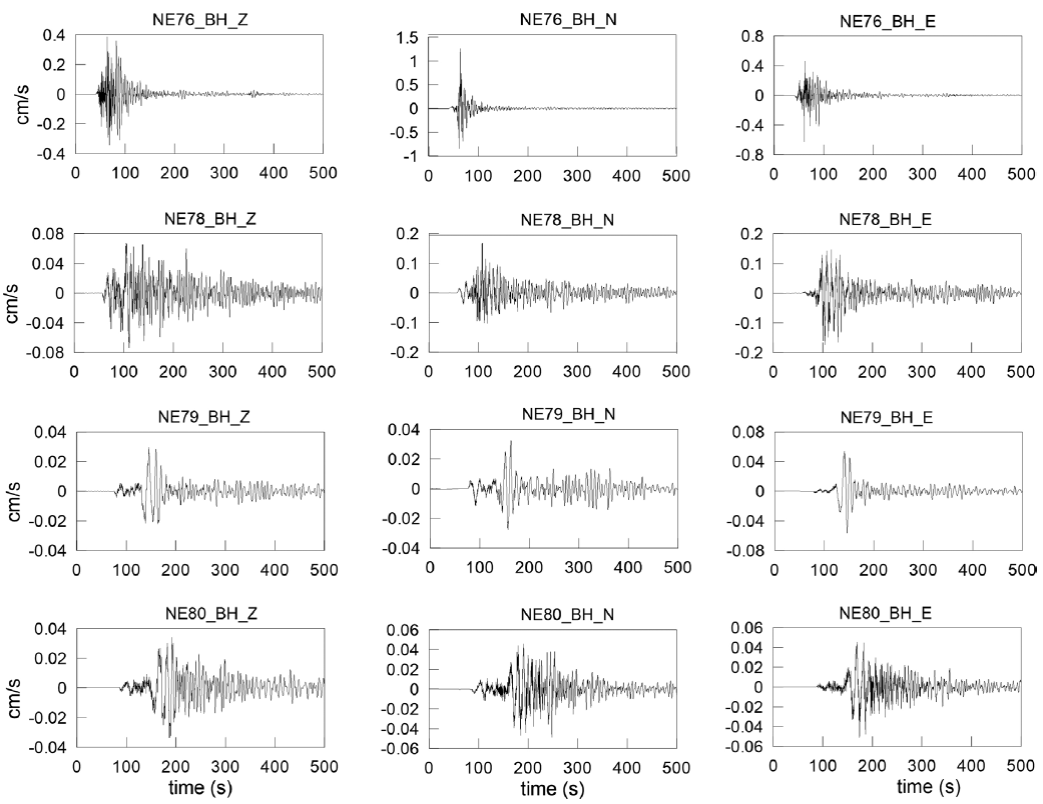
Figure 2 Example of an event used for Qc calculation. Records correspond to the 2003/03/12 earthquake (Mw6.3).
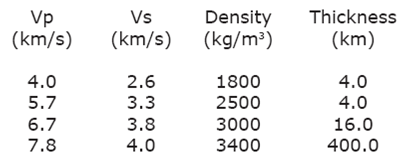
Processing began with locating events. Hypocenter (Lienert et al., 1986; Lienert and Havskov, 1995) which is included in SEISAN code (Ottemöller et al., 2013) was used. The one-dimensional velocity model used by Rebollar et al. (2001) shown in table 1, was also used. From all the located events, we selected only those which were in the area of interest, between parallels and N. 50 events filled these criteria and those mentioned above, and were used for Qc estimation. These events included four events with M>5 and their aftershocks.
Each record was bandpass-filtered for seven frequencies between 1 and 7 Hz with an eightpole Butterworth filter and bandwidths of twothirds of the center frequency
rms amplitudes were determined for sliding windows of 2 seconds width and 1 second advance. Assuming that noise is not correla- ted with signal, the seismogram can be considered as a linear superposition of noise and signal. Corrected amplitudes (Ac) were calculated using
where AN is the maximum amplitude (rms) of the noise and AT is the actual amplitude (rms) of the seismic record. For each band, rms amplitudes of a representative window of noise before the P arrival and corrected rms amplitudes were calculated according to (3).
Ac versus t was plotted and fitted a straight line by a least squares method to calculate the slope from which was obtained. The lower bound of the time window started always after twice the S-wave travel time. The upper bound was usually given by the change of the trend of A(t). The time windows selected in this way were between 20 and 65 s in all cases. Figure 3 shows an example of this procedure. The unfiltered seismogram is shown at the top, below it, the rms amplitudes from the bandpass filtered windows, and the fitted line for the selected time window. Qc estimated values for each frequency are also shown.

Results
Qc average was obtained at each station for central frequencies 1 to 7 Hz. Figure 4(up) shows the values for the six stations and a comparison of the Qc values estimated for the different stations, from December, 1997, to May, 1998, (down). Vertical bars indicate standard deviation in Qc estimation (±1s).
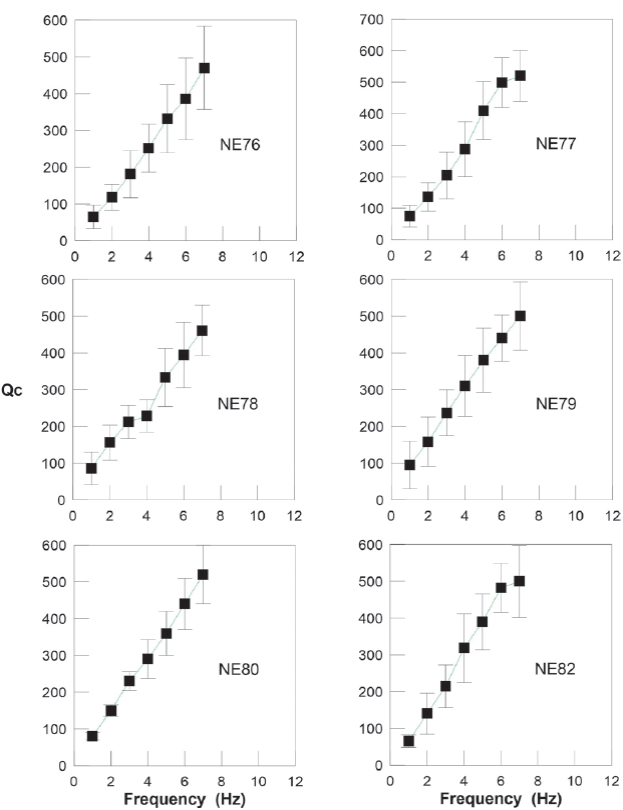
Figure 4 Coda Qc values obtained for different stations. Vertical bars indicate standard deviation in Qc estimation.
Some observations can be drawn from this figure. Within the bounds of the variation, it can be seen that Qc values at each frequency are similar between stations and the general trend is the same for all of them. Assuming a power law of the form Qc (ƒ) = Q O ƒ a, we averaged Qc values and obtained a value of QO = 82±3 and a frequency-dependence α value of 1.05±0.03 in the frequency range from 1 to 7 Hz.
Lapse time used to evaluate Qc and epicentral distance are related to the size of the sampled region. For a source in a homogeneous half-space with random scatters, scattered energy arriving at time t in the coda comes from scatterers lying on an ellipsoidal shell, which surface projection is defined by
 4
4
where r is the source-station distance, v is the wave velocity (averaged S-wave velocity of the model of Table 2), and x and y are the surface coordinates (Pulli, 1984).
Ellipses for each source-station pair were plotted and an envelope was drawn. Two subregions could be defined; the first one with stations to the south of the epicenters (NE78 and NE79) and the second one with the other stations including the most northern station (NE80, Figure 5) since the region between NE80 and the cloud of epicenters to have similar characteristics were considered. Attenuationfrequency dependency function for the north subregion was of (85±3) ƒ 1.03±0.03 and of (75±3) ƒ 1.07±0.03 for the south subregion. Q for the closest stations to the epicenters cloud (NE76, NE77 and NE82, distances between 40 a 200 km) were also estimated in order to see if there was a significant difference for this smaller region,obtaining (83±3) ƒ 1.16±0.03. A higher value of the frequency-dependence α which could be expected as this zone correspond to events occurrence, and can be considered as the most heterogeneous zone.

Discussion and Conclusions
In this study an estimation of averaged value of parameter coda attenuation (Qc (ƒ)) was obtained for the center and south of the Gulf of California, Mexico.
The obtained relation, shows that attenuation is highly dependent on frequency which is in agreement with the high tectonic activity of the Gulf.
A slightly higher attenuation in the south subregion was observed. Oceanic crust is reported to be thinner in this region (López Pineda, 2007). Lonsdale (1989) suggested the presence of a transitional crust at the Guaymas basin in the middle sector of the Gulf of California. In this location, there is a high rate of sedimentation, which promoted the development of a basin containing sills and altered sediments. The greater earthquakes occur in central to south Gulf of California (M>6). We can thus infer that the southern region is more fractured than the northern one, explaining the observed difference in attenuation.
For a small zone of 1.5x1.5 degrees located inland (northeastern Sonora state) within the north subregion (region of the 1887, Mw 7.5 earthquake rupture zone which included the Otates, Teras and Pitáycachi faults), Castro et al. (2008) found an S-wave attenuationfrequency dependent function Qs = 83.8 ƒ 0.9. Very similar values to those obtained in the present study. They suggested scattering to be an important mechanism controlling the decay of spectral amplitudes. The higher frequency dependence in the present case could be reflecting the paths that approach the boundary between the North America and Pacific plates where higher heterogeneity is to be expected, the thickness of the crust is thinner, and new ocean floor is being created.
To the north from the Gulf of California, some attenuation studies have been performed: Reyes et al. (1982) obtained Qc = 250, independent of frequency between 5 and 12 Hz using aftershocks of the 1980 Victoria earthquake, using spectral ratios. Another study of attenuation was made at Imperial fault region by Singh et al. (1982); they used a spectral approach to estimate attenuation of SH waves and obtained a linear functional relation of Qs = 20 ƒ 1.0 in the frequency range from 3 to 25 Hz. Dominguez et al. (1997), found Qc = 111.5 ƒ 0.41 between 6 and 24 Hz for a small area (less than 10 km) around the Cerro Prieto Geothermal field. More recently, Vidales et al. (2014) studied attenuation of the same region of this study but restricting their source-station paths up to 220 km. They found Qs = 176 ƒ 0.6 for distances up to 120 km and Qs = 48 ƒ 0.37 for 120-220 km. Similar values to those obtained by Ortega and Quintanar (2011) for the southern zone of the Gulf of California (Qp = 56 ƒ 0.3) which are very different from that obtained by Castro et al. (2008) of Qp = 20.8 ƒ 1.1 for the Sonora Region. Although they are different regions (Sonora is part of the basin and range province), no such differences were to be expected, specially the differences in frequency dependence (Figure 6).


