


 nueva página del texto (beta)
 Inglés (pdf)
 Artículo en XML
 Referencias del artículo
 Enviar artículo por email
 Citado por SciELO
  Similares en
SciELO
Similares en
SciELO 
 Permalink
Introduction
The Michoacán-Guerrero portion of the Mexico subduction zone has been the site of numerous large M > 7 earthquakes in the last century that have caused significant damage both inland and along the coast (Figure 1). These events generally result from shallow rever-se faulting along the Cocos-North America plate boundary and include the recent Mw 7.3 Papanoa earthquake of 18 April 2014 that caused significant damage near the epicenter and minor damage in Mexico City (UNAM Seismology Group, 2015). The Papanoa earthquake is the latest of several large M > 7 subduction events in Michoacán and western Guerrero that includes the Mw 8.0 and Mw 7.5 earthquakes of 19 and 21 September 1985 (Table 1), which resulted in unprecedented damage and loss of life in Mexico City. The 2014 Papanoa earthquake occurred southeast of the 21 September 1985 event, near the epicenters of the Mw 7.4 earthquake of 14 March 1979 and the Ms 7.5 earthquake of 22 February 1943. An Ms 7.0 earthquake on 27 March 1908 had also been considered to be located within this region (e.g., Singh et al., 1984a). However, a review of felt and damage reports suggests that it occurred southeast of Acapulco (at 16.3ºN, 98.5ºW), following the large Ms 7.8 earthquake of 26 March 1908 (UNAM Seismology Group, 2015).
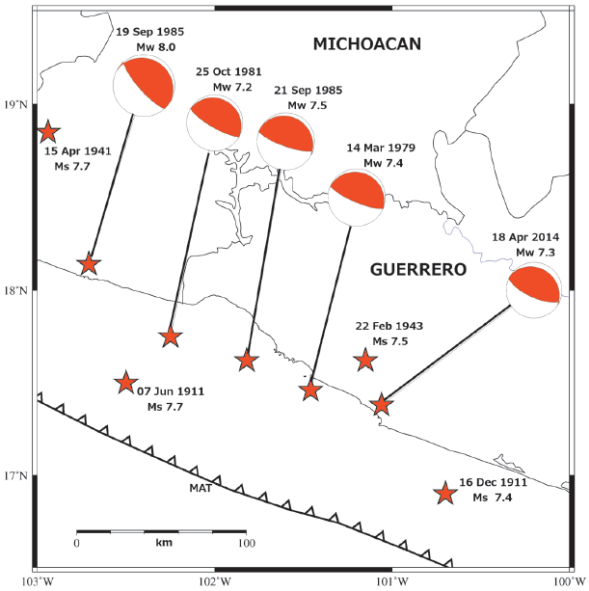
Figure 1 Epicenters (stars) of large, shallow M > 7 earthquakes in the last century along the Michoacán-Guerrero portion of the Mexico subduction zone. Source mechanisms obtained from the Global Centroid Moment Tensor Project catalog (http://www.globalcmt.org) are shown for recent events. MAT = Middle America Trench.
Aftershock areas for the 21 September 1985, the 14 March 1979, and the 22 February 1943 earthquakes appear to at least partially overlap (Figure 2), suggesting that the earthquakes may have ruptured common localized areas of the Cocos-North America plate boundary (UNAM Seismology Group, 2015). Aftershocks located by the Servicio Sismológico Nacional (SSN) in the 3 weeks following the 2014 Papanoa earthquake also extend across the aftershock areas of the 1943, 1979, and 1985 events (Figure 2). Aftershock areas of large earthquakes have generally been used to delineate the location and extent of historical seismogenic ruptures in subduction regions (e.g., Sykes, 1971; Kelleher, 1972; McCann et al., 1979; Lay et al., 1982). Such qualitative observations are useful for documenting the general earthquake history at subduction zones and evaluating the potential for large damaging events. However, they provide little detailed information on the distribution of interplate rupture during particular earthquakes or the behavior of recurring seismic events. The observed geographic overlap of aftershock areas in western Guerrero, for example, would suggest that recent coseismic rupture has been confined to the same portion of the shallow Cocos-North America plate interface, implying an average recurrence interval of ~24 years for M > 7 thrust earthquakes in the region. However, a more detailed examination of the location of primary slip areas for these events may provide valuable information on the character of large, recurrent earthquakes in the region.
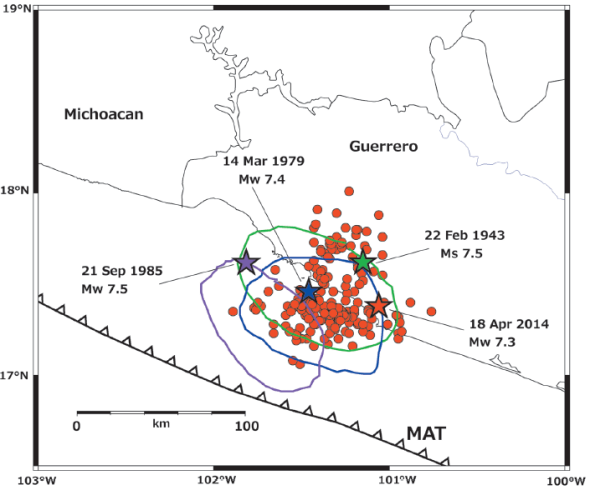
Figure 2 Epicenters (stars) and aftershock areas (ovals) of large, recent M > 7 thrust earthquakes in the Papanoa region. Aftershock areas for the September 21, 1985 (purple) and the March 14, 1979 (blue) earthquakes are from UNAM Seismology Group (1986). The aftershock area of the February 22, 1943 earthquake (green) is from Kelleher et al. (1973). Epicenters of Mw > 3 aftershocks (red) located by the Servicio Sismológico Nacional in the 3 weeks following the April 18, 2014 Papanoa mainshock are also shown.
In this study, we derive the coseismic fault slip for the 18 April 2014 Papanoa earthquake and compare with the locations of the rupture areas derived for the 14 March 1979 Petatlán and the 21 September 1985 Zihuatanejo earthquakes to examine the relationship between recurring slip zones along the shallow interplate boundary. We apply a finite-fault waveform inversion procedure to recover a coseismic slip model for the 2014 Papanoa earthquake using an extensive teleseismic, broadband dataset that includes 70 body-wave records. Our comparison of the 2014 Papanoa slip model with rupture areas previously observed for the 1979 Petatlán and 1985 Zihuatanejo earthquakes provides insight on the interaction of interplate asperities for recurring events along this portion of the Cocos-North America plate boundary.
Table 1 M ≥ 7 thrust earthquakes in the Michoacán-Guerrero portion of the Mexico subduction zone (100ºW - 103ºW).
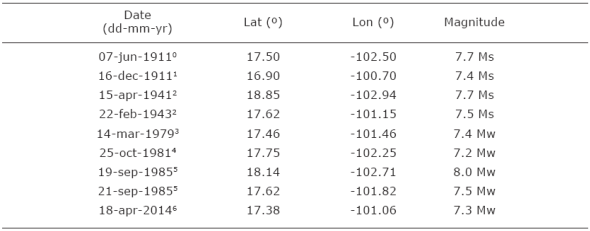
Epicentral locations from: 0, Anderson et al. (1989); 1, Singh et al. 1984a; 2, Kelleher et al. (1973); 3, Gettrust et al. (1981); 4, Havskov et al. (1983); 5, UNAM Seismology Group (1986); 6, UNAM Seismology Group (2015).
Inversion method
We use the finite-fault inversion scheme developed by Hartzell and Heaton (1983), where the observed seismic waveforms are inverted to recover the coseismic slip on a fault plane of prescribed orientation placed at a specific depth in a given crustal structure. In the finite-fault formulation, the fault dimensions are chosen to encompass the rupture area expected for the known earthquake magnitude. The fault is then divided into a given number of subfaults, and a set of point sources are distributed uniformly across each subfault. Body-wave point-source responses (Green´s functions) are calculated at each recording station using a boxcar source-time function of finite duration. Generalized ray theory (Helmberger and Harkrider, 1978) is used to calculate the Green´s functions for a layered, near-source crustal structure. These include internal reflections and mode conversions, incorporating depth-phase contributions to the body waves. In this study, we use a layered structure derived from the gradient velocity model developed by Stolte et al. (1986) for the Michoacán-Guerrero region.
Synthetic waveforms are then constructed for each subfault at all the recording sites by summing the point-source responses, taking into account the appropriate time delays for a rupture front propagating at a prescribed speed across the fault. The synthetic records constructed for each subfault are placed end-to-end to form the columns of a matrix A of subfault synthetics. The observed waveforms recorded at all the stations are also placed end-to-end to form a data vector b. Together, these form an overdetermined system of linear equations Ax=b where the elements of the solution vector x represent the slips required of each subfault to reproduce the observations. Multiple slip intervals are accommodated by adding columns to the A matrix constructed by successively lagging the subfault synthetics by the width of the boxcar source-time function. This results in a specified number of time win-dows that discretize the rise time on the fault. The inversion then recovers the slip in each subfault for each of the specified time windows, thus identifying a long rise time if required by the observations.
The inverse problem is stabilized by adding constraint equations of the form λFnx = 0 to the linear system,
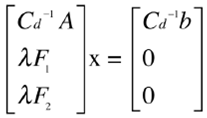
where F1 corresponds to the difference in slip between adjacent subfaults, and F2 is the identity matrix. The former imposes a smooth transition of slip from subfault to subfault, and the latter reduces the length of the x vector, effectively minimizing the total seismic moment. The value of λ controls the tradeoff between applying the constraints and fitting the observations, and Cd -1 is a data covariance matrix that normalizes each station record to its maximum amplitude.
In the teleseismic inversion problem, errors in the epicentral location of the rupture initiation point do not affect the resulting slip model since differences in location due to these errors have a minimal effect on the teleseismic Green´s functions. That is, the solution is obtained strictly from the timing of waveform contributions following the initial P-wave arrival at each of the recording sites, and teleseismic slip models derived using the methodology can be simply moved over along the fault to coincide with an epicentral location that is believed to be more accurate. Errors in the hypocenter depth, however, are more important since different depths result in synthetic waveforms with depth-phase contributions arriving at different times following the direct P arrival. Fault-depth uncertainties can generally be reduced by performing several inversions at different hypocentral depths and selecting the solution with the lowest Euclidean Norm ||Ax - b||, which provides a direct measure of the fit to the observed waveforms.
The inversion method of Hartzell and Heaton (1983) has historically been performed by iteratively incrementing the smoothing value λ until the waveform fits become visibly degraded in an effort to identify the simplest solution that satisfies the observations. However, Mendoza and Hartzell (2013) showed that the amount of stabilization to apply can be estimated directly from the inverse problem using the relation λ=90|a|avg, where |a|avg is the average of the absolute values of the elements of the coefficient matrix Cd -1A. This smoothing estimate is comparable to the value obtained using the visual iterative approach, yielding a more timely calculation of the distribution of coseismic slip. In this study, we use the Mendoza and Hartzell (2013) relation to estimate the degree of smoothing to use in the inversion of the teleseismic body waveforms, recovering the rupture model in a single step.
2014 Papanoa Slip Model
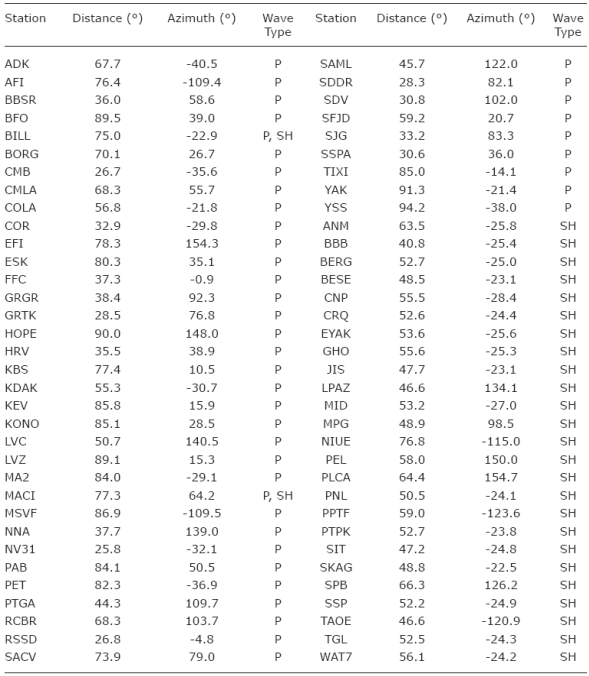
We invert the broadband, teleseismic P and SH waveforms recorded for the 2014 Papanoa earthquake by the Global Seismographic Network, obtained from the Incorporated Research Institutions for Seismology (IRIS) Data Center (http://www.iris.edu). The data include 43 vertical P-wave records from stations located 25º-95º from the earthquake epicenter and 27 SH waveforms obtained by rotating the horizontal components to their source-station azimuths for recording sites located at distances of 40º-80º (Table 2). We use the epicenter computed by the UNAM Seismology Group (2015) using local P-wave arrival times and source-station azimuths. Observed P and SH records were deconvolved to ground displacement, resampled to a time step of 0.25s, and passband-filtered between 1 and 60s. The waveforms were then windowed to 70s record lengths, and an exponential taper was applied 40s after the record start time to minimize the mapping of non-source related effects onto the fault.
The fault geometry (300º strike, 23º dip, and 95º rake) is based on the source parameters derived from a W-phase analysis of the regional broadband waveforms (UNAM Seismology Group, 2015) and is consistent with a shallow, northeast-dipping thrust along the Cocos-North America plate boundary. The fault dimensions are 100 km x 100 km, and the fault is divided into 400 5 km x 5 km subfaults. The hypocenter is 40 km from the top and 30 km from southeast edge of the fault, and a boxcar of 1s duration is used to calculate the point-source Green´s functions. A rupture velocity of 2.6 km/s is used to construct the subfault synthetics, corresponding to about 70% of the average shear-wave speed in the assumed near-source crustal structure. Ten time-windows are used in the inversion, allowing up to 10s for the rise time on the fault.
We test several nucleation depths to constrain the depth of the fault. Table 3 gives estimates of the misfit between observed and predicted waveforms for several hypocentral depths, as measured by the Euclidean norm ||Ax-b|| obtained in the inversion. The best fit is obtained for a depth of 18 km, which coincides with the focal depth computed by the SSN for the earthquake (UNAM Seismology Group, 2015). The resulting slip model (Figure 3) shows two distinct sources of large slip separated by about 10 km: a 30 km x 30 km area near the hypocenter with a peak slip of 2.2 m and a second 20 km x 35 km source to the northwest with a peak slip of 1.9 m.
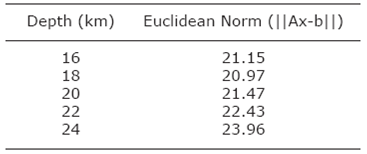
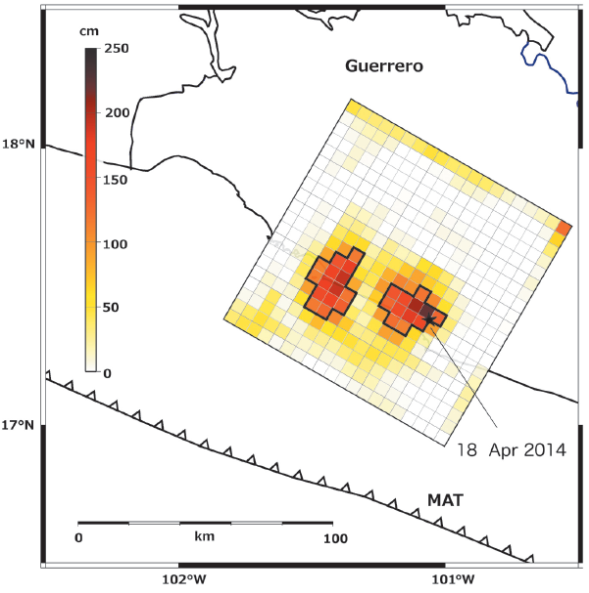
Figure 3 Coseismic slip (in cm) derived in this study for the April 18, 2014 Papanoa earthquake projected to the surface based on the location of the earthquake epicenter (star). The fault is divided into 400 5-km x 5-km subfaults and strikes at 300º with a 23º dip to the northeast. The black polygons outline subfaults with slip greater than 50 percent of the maximum slip of 2.2 m observed near the hypocenter.
The waveform fits (Figure 4) correspond to an estimated seismic moment of 1.0 x 1027 dyne-cm (Mw 7.3). A rise time of 2-4s is estimated for both zones of maximum slip. Five 1s time windows would therefore be sufficient to recover the teleseismic source model. An inversion of the P and SH data recorded for the Papanoa earthquake using five, instead of ten, time windows yields a fault-slip distribution that is practically identical to that shown in Figure 3.
The UNAM Seismology Group (2015) obtained a similar slip model for the 2014 Papanoa earthquake from an inversion of the teleseismic body waves, the recorded surface waves, and geodetic measurements from two near-source sites. Their slip model also shows two areas of coseismic slip separated by 10 km along the fault, one near the hypocenter with a peak slip of about 2 m and a second source with a peak slip of about 1.7 m located updip and to the northwest. They obtain a seismic moment of 8.3 x 1026 dyne-cm from the body- and surface-wave records (UNAM Seismology Group, 2015).

Figure 4 a) P and b) SH waveform fits between observed (solid) and theoretical (dotted) records for the 2014 Papanoa source model shown in Figure 3. Observed peak amplitudes (in microns) are shown to the right for each station. Waveform fits correspond to a seismic moment of 1.0 x 1027 dyne-cm.
Other interplate ruptures in western Guerrero
As mentioned earlier, the 2014 Papanoa earthquake is located near the site of several M > 7 earthquakes that occurred on 22 February 1943, 14 March 1979, and 21 September 1985. The earthquake of 1943 occurred before the modern instrumental era, and there is not enough information to allow a detailed study of its rupture extent or slip distribution. Modeling of analog P waveforms recorded at European seismograph stations, however, indicate significant differences between the event and the earthquakes of 1979 and 1985 (Singh et al., 1984b; Singh and Mortera, 1991). Source time functions calculated for the 1943 earthquake at stations DBN (DeBilt, Holland) and STU (Stuttgart, Germany) are more complex, showing the contribution of 4 to 6 subevents (Singh and Mortera, 1991). This is in contrast to the 1979 and 1985 recordings, which indicate a simpler rupture process (Singh and Mortera, 1991).
For the March 1979 Petatlán and the September 1985 Zihuatanejo earthquakes, Mendoza (1993; 1995) derived the extended source properties using the finite-fault methodology utilized in this study, although the procedure was slightly different. For the 1979 Petatlán earthquake, Mendoza (1995) applied the multiple time-window approach using five time windows of 1s duration, allowing up to 5s for the rise time on the fault. The slip model shows a large 70 km x 70 km rupture area with a small source (70-cm peak) near the hypocenter and a larger source (1.2-m peak) about 10 km to the southeast (Figure 5a). The source model was obtained from the inversion of 19 digital and analog teleseismic P waveforms that include long-period, broadband, and short-period records (Mendoza, 1995). For the 1985 Zihuatanejo earthquake, Mendoza (1993) used a single 1s triangular source time function to parameterize the fault, invoking a fixed rupture velocity and a short 1s rise time that may not be long enough for an event of this size.
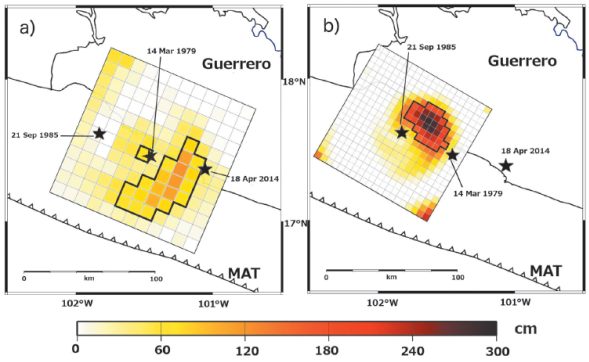
Figure 5 Distribution of coseismic slip for a) the March 14, 1979 Petatlán and (b) the September 21, 1985 Zihuatanejo earthquakes shown projected to the surface relative to the epicenter of the 2014 Papanoa earthquake. The 1979 slip model was obtained by Mendoza (1995) using 144 10-km x 10-km subfaults and has a peak slip of 1.2 m. The slip model of the 1985 Zihuatanejo earthquake was derived in this study using 400 5-km by 5-km subfaults and has a peak slip of 2.9 m. Black polygons outline subfaults with slip greater than 50 percent of the peak observed for each event.
Our goal is to conduct a consistent comparison between interplate ruptures in the region, and we analyze the teleseismic body waveforms recorded for 1985 earthquake using the multiple-time window approach to allow a comparable flexibility in the fault rise time. We inverted 13 long- and intermediate-period P waveforms and 4 intermediate-period SH records obtained from the IRIS Data Center for the event. The dataset is similar to that used by Mendoza (1993), who included 14 broadband and intermediate-period P waveforms and 5 intermediate-period SH records. In our analysis, we deconvolved the records to ground displacement and pro-cessed them in the same manner as the Papanoa data. We used a 100 x 100 km fault divided into 5 km x 5 km subfaults, keeping the same geometry (300° strike, 14° dip, 90° rake), hypocentral depth (20 km), and subfault rupture velocity (2.6 km/s) used by Mendoza (1993). We then performed the inversion using five 1s time windows to allow up to 5s for the rise time on the fault. The resulting slip model (Figure 5b) shows rupture dimensions similar to those observed by Mendoza (1993), with the majority of the slip located just southeast of the hypocenter. Our result, however, shows slip to be concentrated primarily in the downdip portion of the fault, rather than both updip and downdip of the hypocenter. A peak slip of 2.9 m is observed at a depth of about 24 km.
The slip models of the 1979 Petatlán, the 1985 Zihuatanejo, and the 2014 Papanoa earthquakes show distinct source regions where coseismic slip is concentrated along the plate interface during the rupture process. These sources are interpreted to represent asperity zones that fail coseismically, radiating the primary portion of the seismic-wave energy recorded at the far-field observation sites. The asperities are presumably surrounded by weak intervening regions of low relative slip that contribute significantly less seismic energy at the seismic stations. Together, the stronger asperities and intervening areas of low slip map the overall rupture area of the earthquake (e.g., Kanamori, 1981; Lay et al., 1982). In this respect, the entire rupture area excites the longer-period seismic-wave energy that is used to characterize the seismic moment of the earthquake.
To examine the failure of these asperities and their behavior over different earthquake cycles, we compare the principal rupture areas observed for the 1979 Petatlán, the 1985 Zihuatanejo, and the 2014 Papanoa earthquakes along the northwestern portion of the Cocos-North America plate boundary. There is an appreciable overlap between the overall slip areas of the 1979 and 2014 earthquakes, making it difficult to simply overlay the slip models along the coast. We thus plot the locations of the regions of high slip observed for each event, defined by values greater than 50 percent of the maximum and constrained by the corresponding earthquake epicenters (Figure 6). The epicenter of the 1979 Petatlán earthquake was obtained by Gettrust et al. (1981) using local P and S arrival times. For the 1985 Zihuatanejo earthquake, the epicenter was obtained by the UNAM Seismology Group (1986) using body-wave arrival times from 12 local seismic stations. The 2014 Papanoa epicentral location was recomputed by the UNAM Seismology Group (2015) using local source-station azimuths and P arrival times. These are the most accurate epicenters available to date for all three events, and our comparison provides a direct examination of the rupture locations and asperities along the plate interface. We assume that the epicenters obtained using local data represent the rupture-nucleation points used to invert the teleseismic records. Large subduction earthquakes, however, sometimes exhibit low-amplitude, emergent beginnings that are not well recorded at teleseismic distances. Small precursors and emergent features, for example, have been previously observed for the 1979, 1985 and 2014 earthquakes (Mendoza, 1993; 1995; UNAM Seismology Group, 2015). Detailed studies of the effect of these features on the relative location of the principal coseismic slip have yet to be undertaken, although they may help define more precisely the position of large earthquake ruptures along the plate boundary.
The high-slip zones of the three events differ in size and shape and do not occupy the same position along the plate interface (Figure 6). The areas of high slip observed for the 1979 and 1985 ruptures are located at or near the edges of the regions of high slip that were observed during the 2014 Papanoa earthquake, 30-35 years later. High slip in 1979 appears to overlap the hypocentral source of 2014 ; however, we see from Figure 5a that this 2014 source is located at the lower downdip margin of the highest slip observed in 1979. The second 2014 source of high slip to the northwest is located near, but does not coincide with, the small region of high slip observed in 1979 near the Petatlán hypocenter. This second 2014 source, in fact, appears to straddle the intervening region between the highest-slip area observed in 1979 and the principal rupture area of the 1985 Zihuatanejo earthquake to the northwest. Also, aftershocks of the 2014 Papanoa earthquake occur land-ward and seaward of the 2014 asperities and within the rupture zone of the 1979 earthquake, showing the limitations of using aftershock distributions to study the details of recurring interplate ruptures.
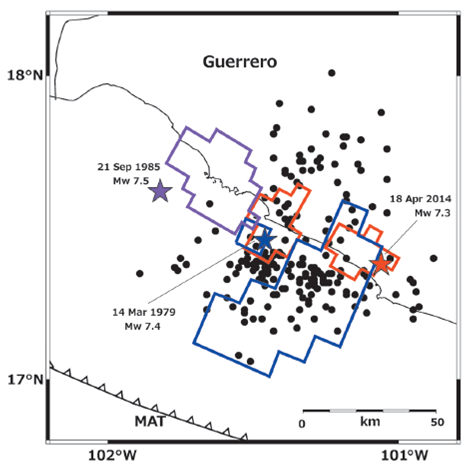
Figure 6 Regions of high slip observed for the 2014 Papanoa (red), the 1985 Zihuatanejo (purple), and the 1979 Petatlán (blue) earthquakes represented by areas of slip greater than 50 percent of the peak for each event. Also shown are the 3-week aftershocks located by the SSN following the 2014 Papanoa mainshock.
The principal areas of slip for all three events thus appear to abut, rather than coincide, suggesting that different localized portions of the plate interface were responsible for the observed seismic-wave radiation. To further examine this hypothesis, we reviewed the waveforms recorded for the 1979 Petatlán and 2014 Papanoa earthquakes at common teleseismic distances. In particular, we compared the short-period, P-wave ground-velocity records observed at stations ZOBO, MAJO and KONO for the 1979 earthquake with equivalent P waveforms recorded for the 2014 event (Figure 7). The 2014 waveforms were obtained by deconvolving the instrument response from the broadband, vertical records and applying the same 0.08-5 Hz Butterworth bandpass filter used by Mendoza (1995) to filter the 1979 short-period records at ZOBO, MAJO and KONO. The P waveforms observed at the three stations within this frequency range differ dramatically for the two earthquakes, indicating distinctly different rupture characteristics.
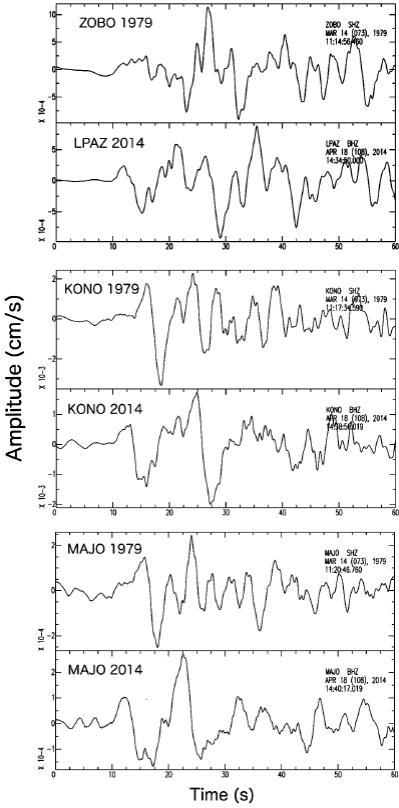
Figure 7 Comparison between the short-period, P-wave ground-velocity records observed for the 1979 Petatlan earthquake and the equivalent P waveforms recorded for the 2014 Papanoa earthquake at stations ZOBO (top frame), KONO (middle frame) and MAJO (bottom frame). The 2014 waveforms shown were obtained by removing the instrument response from the broadband, vertical records at LPAZ, KONO and MAJO and then applying the same 0.08-5 Hz Butterworth bandpass filter used on the 1979 records. The LPAZ station location is very similar to the ZOBO site.
Conclusions and discussion
We have conducted a single-step finite-fault inversion of the high-quality, digital, teleseismic broadband body waves recorded for the Mw 7.3 Papanoa, Mexico earthquake of 18 April 2014 to recover a detailed rupture model for the event. We inverted 43 P-wave and 27 SH records to derive a coseismic slip model characterized by two principal sources of similar extent (700-900 km2 area) and slip amplitude (~2-m peak). The sources are interpreted to represent asperity areas along the shallow Cocos-North America plate boundary that contribute the primary portion of the body-wave energy recorded at the teleseismic stations. A comparison of these 2014 asperities with principal slip sources identified for two previous M > 7 thrust earthquakes indicates that the asperities of the three events do not coincide, despite the similarities and proximity in aftershock area locations.
The two previous events are the Mw 7.4 Petatlán earthquake of 14 March 1979 and the Mw 7.5 Zihuatanejo earthquake of 21 September 1985. The slip model of the 1979 Petatlán earthquake was previously obtained by Mendoza (1995) from an inversion of teleseismic P waves using a multiple time-window parameterization similar to that used to analyze the 2014 Papanoa earthquake. Mendoza (1993) also derived a slip model for the 1985 Zihuatanejo earthquake from the teleseismic P waves, although the analysis did not allow for a variable rise time. To assure a more consistent comparison, we analyzed the digital teleseismic P and SH waves recorded for the 1985 Zihuatanejo earthquake using the same multiple time-window approach used to study the 1979 and 2014 earthquakes. The slip models of the three events allow a consistent examination of the asperity locations along this portion of the Mexico subduction zone.
The abutting nature of the principal slip zones implies that the same asperity areas did not fail from one earthquake to another. This conclusion is supported by the dissimilar character of the short-period teleseismic waveforms observed for the 1979 and 2014 earthquakes. The source time functions calculated at European stations by Singh et al. (1984b) and Singh and Mortera (1991) also suggest differences in the rupture process between the February 1943 earthquake and the more recent 1979 and 1985 events. Singh and Mortera (1991), for example, noted that the different results obtained for the 1943 and 1979 earthquakes could be due to differences in the rupture characteristics of the earthquakes within the same interplate area. The adjoining rather than coincident behavior of the asperity zones would be at odds with the idea that the rupture process in the Petatlán region repeats every 35 years, as might be inferred from the observed overlap in aftershock areas in 1943, 1979, and 2014. Instead, it would indicate that we have yet to observe a repeat of similar large M > 7 earthquakes along the western Guerrero portion of the Mexico subduction zone. Thus, if we additionally consider the rupture models inferred for the 25 October 1981 Mw 7.2 Playa Azul and the 19 September 1985 Mw 8.0 Michoacán earthquakes (Mendoza, 1993), we see that high-slip zones for recent M > 7 earthquakes have generally been filling in the shallow-dipping contact between the Cocos and North America plates, and the question arises as to whether these asperity zones will fail again individually in the future or as an ensemble of asperities that will produce a much larger, possibly megathrust event. In this regard, perhaps the intervening regions between asperities can serve to locate poten-tial regions of high slip during future M > 7 earthquakes. Thus, if we can map the asperity zones for previous M > 7 earthquakes and identify intervening zones that could fail in future earthquakes, we may be able to identify the character of great megathrust events produced by a single simultaneous failure of all or many of the asperities along the plate boundary.
To the extent that the hypocenters of the 1979, 1985 and 2014 events are well-determined and the corresponding slip models well-resolved, the results have important implications for the rupture and re-rupture of interplate boundaries in subduction regions. Finite-fault studies and synthetic tests conducted to date indicate that broadband teleseismic data can be used to derive accurate coseismic slip models that are relatively insensitive to uncertainties in rupture velocity and fault rise time. The slip models are affected mostly by errors in the dip and depth of the fault due to greater inaccuracies in the computed Green´s functions (Mendoza et al., 2011; Mendoza and Hartzell, 2013). A more complete examination of these possible errors may provide a more quantitative assessment of the expected variations in asperity size and location along subduction margins.
Our results suggest that sequential plate-interface ruptures do not involve the failure of the same asperity zones and do not constitute characteristic earthquakes that repeat in a periodic manner from one seismic cycle to another. This may account for some of the difficulty encountered in forecasting seismic potential based on the simple tabulation of numbers of earthquakes above a certain size along subduction margins (e.g., Rong et al., 2003). Although there is a limited amount of seismic waveform data available for large M > 7 subduction earthquakes prior to the age of digital instrumental recording (since ~1980), it would be beneficial to study the extended source properties of these earlier events to examine the behavior of asperity regions over more than one earthquake cycle. Such detailed information on the episodic nature of asperity rupture would be of great value in the evaluation of the potential for large earthquake occurrence along subduction zones. The results would also have important implications for the simulation of ground motion from recurring thrust earthquakes along a plate boundary. Since the asperity zones are defined by areas of high slip, their size and distribution along the plate interface would have a significant impact on the radiation of the higher-frequency seismic-wave energy that controls the near-field and regional strong motions.

