


 nueva página del texto (beta)
 Inglés (pdf)
 Artículo en XML
 Referencias del artículo
 Enviar artículo por email
 Citado por SciELO
  Similares en
SciELO
Similares en
SciELO 
 Permalink
Introduction
Geophysical surveys were employed to update the morphological model of a mineral deposit owned by an aggregate mining company located near the city of Taubaté, Brazil. The company owns a mining title encompassing an area of 50 ha and it has recently applied for an extension of its mining title to an exploration permit for an area of 246 ha, as shown in Figure 1 (UTM SF-23). The deposit is a limestone orebody surrounded by gneiss. The company traditionally produces limestone and gneiss for aggregates. A new exploitation stage is planned for the extended exploration permit, which will be focused on the gneiss occurrence. For the planning of this new stage, it is important to know the thickness of the layer of soil above the gneiss bedrock.

Figure 1 Current mining title (rectangle in the centre) with mining manifest and new title with exploration permit (external polygon).
The purpose of this paper is to describe the application of geophysics in order to streamline data collection for updating of the morphological model in the area of the new mining title of the company to meet the time limits specified by the company. Due to the low cost and the possibility of covering broad areas in a short time, geophysical methods are an important tool in mineral research (REM). Ravindran (2010) conducted a geoelectric resistivity survey along a 14-km transect at the boundary between Kericho and Nakuru counties (India) to observe the structure beneath and its relation to groundwater occurrence. In this case, 2D electrical resistivity (ER) imaging has proved to be an excellent tool to delineate groundwater potential zones and subsurface lithology. According to Frasheri et al. (1995), the most important geophysical methods used for this purpose are electrical prospecting, gravity, magnetics, and electromagnetics.
The conventional method that is usually used by the company for this type of data collection is based on rotary drilling holes with core recovery. However, due to the deadlines set by the company, an exploration campaign using the conventional procedures would take about 60 days to complete using between three and four drilling equipment units.
To reduce the time taken by the data collection required to update the morphological modeling of the deposit, geophysical methods were introduced that made it possible to obtain reliable data on the variables of interest (including the thickness of the soil layer and the depth of the top of the bedrock). According to Bery and Saad (2012), the resistivity method can be used for measuring soil electrical properties, and the ER was tested in different soil studies. Haile and Atsbaha (2014) comments that geophysical techniques are routinely used as part of geological investigations to provide information on site parameters and to map the subsurface geology and geological structures at the site. According to Ogilvy and Bogoslovsky (1979), observation of the changes in specific electrical resistivities with time on the slopes of quarries is an effective method of assessing slope stability and predicting landslide hazards.
The work began with a test to verify the accuracy of the geophysical methods used. The test was performed in the same location as an existing exploration campaign, which validated the compliance of the results of the geophysical survey with the data from drill cores. The feasibility of using the ER and induced polarization (time domain IP) methods to identify the geological contact between soil and bedrock was confirmed in this way. The technique chosen for data collection was vertical electrical sounding (VES) with a Schlumberger array. Due to the satisfactory results, 31 VESs have been planned and carried out in the southern portion of the new mining title area. Currently many surveys are performed with the VES technique. Atzemoglou et al. (2003) reports that a survey conducted in the NW Amynteon basin, by combining the interpretation of results of 1D VES, produced 2D and 3D results in full agreement with the local geology.
Geophysical methods and techniques used
Electrical Resistivity (ER) Method
The ER method uses an artificial electrical current that is introduced into the land through two electrodes (known as A and B) with the aim of measuring the potential generated in two other electrodes (known as M and N) near the current flow (Elis, 1999). The introduction of an electrical current into the land through the electrodes A, B, M, and N results in a power difference (ΔV), thus allowing the calculation of the apparent resistivity through the equation (1):
 1
1
Thus, it is possible to identify the different layers of soil, weathered rock, and bedrock through the resistivity values obtained in field trials.
Vertical Electrical Sounding (VES) Technique
The VES technique consists of a succession of chargeability and resistivity measurements made with the same type of array and increasing separation between the emission and reception electrodes and the center of the array (allocation point test), and its orientation is kept fixed (Figure 2).
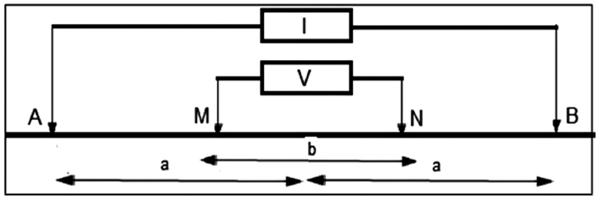
This procedure allows for the observation of apparent resistivity and chargeability values at a fixed point, at increasing depths, by increasing the separation between the current electrodes A and B. There are several electrode arrays for field trials; however, the Schlumberger array was used in this research. This array was chosen because it has a superior vertical resolution and it is able to record higher quality data (especially IP data) than other arrangements. Another important advantage over alternative arrays (such as Wenner and others) is the possibility of improving the signal to noise ratio by moving only the MN electrodes during data acquisition.
Induced Polarization (IP) Method
IP is a phenomenon stimulated by an electric current, observed as a delayed response to voltage in natural materials (Sumner, 1976). By establishing an electrical current flow through the electrodes A and B on the sur-face, a primary potential difference ΔVp is established. A (ΔVp) varies with time and acquires the shape of a curve ΔVIP = f(t). This curve connects the steady-state asymptote ΔVp with the zero asymptote after cutting the current. The method’s concept is based on the amplitude of a ΔVIP (t) value and is related to the geological material’s greater or lesser capacity to polarize, constituting, therefore, the basis of the method (Figure 3).
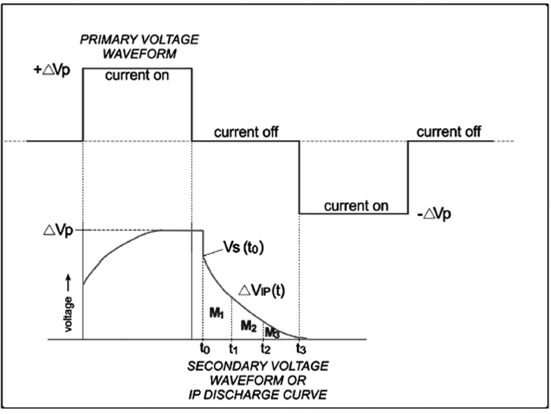
The decay curve can be studied as a whole or just sampled at some intervals of time (Telford et al., 1990).
The parameter measured in the IP (time domain) is called chargeability (M) and can be expressed in milliseconds (ms) or millivolts/ volt (mV/V):
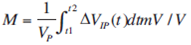 2
2
According to Orellana (1972), the explanation for the IP phenomenon is commonly attributed to two factors: electrode polarization and membrane polarization. In this particular case, what prevailed was membrane polarization occurring in rocks with a low content of metal elements. The changes in clay content in the different layers of soil and bedrock caused different IP responses and therefore assisted in the individualization of the layers of interest.
Tests Conducted
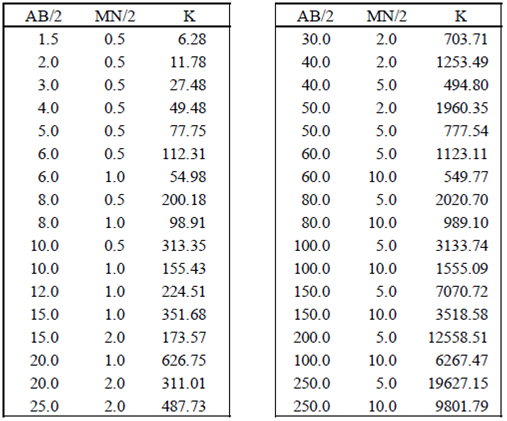
Thirty-one VESs were planned and implemented in the southern portion of the exploration permit area shown on the map in Figure 4 and Table 1. According to Sahbi et al. (1997), when electric soundings are made over an irregular terrain, topographic effects can influence the values of apparent resistivity and lead to erroneous 1D interpretation. Due to this fact, VESs were not performed in very irregular locations to avoid this unwanted effect. VESs surveys were carried out with AB spacing varying between 200 and 500 m. The AB spacing has been adjusted according to the soil thickness. The depth of investigation was between 50 and 125 m, as shown in Table 2. The fitting errors between field data and the models varied between 2.9 and 9.4%.

Figure 4 Location of the drill holes (as red dots) and the VESs (as green dots) within the area of interest.

In the area where the first test was conducted, the results showed that the layers of soil with higher porosity, higher clay content, and higher moisture content than the bedrock presented resistivity and chargeability values that allowed these materials to be differentiated. The VES tests were performed between the existing drill holes F02-F-121-02 and F06-F-99-03. These drill holes presented 27 to 30 m of soil on gneiss and/or weathered gneiss.
The VES results are shown in Figure 5 and Table 3 with a five-layer model. The fitting error was 6.9%. The first four layers characterize the topsoil and weathered gneiss soil/rock. The resistivity variations reflect the changes in porosity and moisture content that are a part of the soil’s profile. The gneiss presents higher resistivity (1207 ohm.m) from 24.3 m deep, which is quite consistent with data from the drill holes.

Table 3 VES test conducted between drill holes F02-F-121-02 and F06-F-99-03.
| Layer | r (ohm.m) | M (mV/V) | Top Depth | Interpretation |
|---|---|---|---|---|
| 1 | 852 | 3.7 | 0 | Alteration Soil |
| 2 | 1174 | 12 | 2.1 | Alteration Soil |
| 3 | 489 | 1.1 | 5.7 | Alteration Soil |
| 4 | 136 | 5.4 | 10.4 | Alteration Soil |
| 5 | 1207 | 9.8 | 24.3 | Gneiss/weathered Gneiss |
The VES surveys were performed in order to separate the soil layers from the gneiss. The soil, due to its higher porosity, higher clay content, and higher moisture content than the compact rock, tends to have lower resistivity values.
Therefore, as resistivity is a property that responds to changes in the factors described above, it was the basis of the interpretation of the VES. According to Okay et al. (2013), IP is a geophysical method that is potentially sensitive to the presence of cracks in porous rocks. In this case, the chargeability data were used on a flat surface to assist in the definition of contacts and to refine the interpretation. In general, the curves show chargeability models with a higher value for the bedrock, but since this parameter is affected by small variations in the type and amount of clay minerals, some VESs showed a small decrease in chargeability for the last layer.
Discussion of Results
Layer Interpretation
The results show that it was possible to identify the layers of interest established according to the aims of the study.
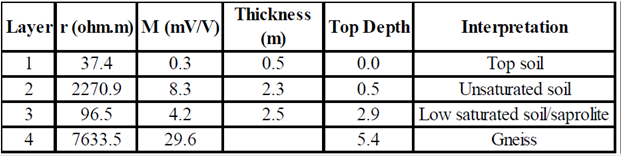
Most VESs presented models of four layers. Layers 1, 2, and 3 were interpreted respectively as topsoil (low to medium resistivity, low to medium chargeability), unsaturated alteration soil (high resistivity due to low moisture content and medium chargeability), and saprolite or alteration soil (low to medium resistivity and low chargeability). The fourth layer typically showed high resistivity values (greater than 2000 ohm.m) and higher chargeability (typically above 10 mV/V) and was interpreted as bedrock gneiss. Higher resistivity values are expected for gneiss due to the low degree of alteration and low porosity. The larger chargeability values may be related to accessory metallic minerals in the gneiss, which have not yet been processed by weathering conditions.
To illustrate these results, Figure 6 and Table 4 summarize the geo-electrical model of VES 10 with the succession of layers of soil above the bedrock gneiss.
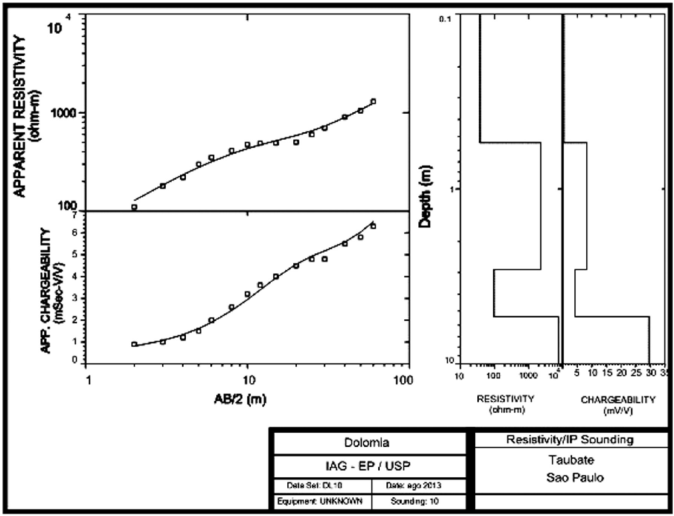
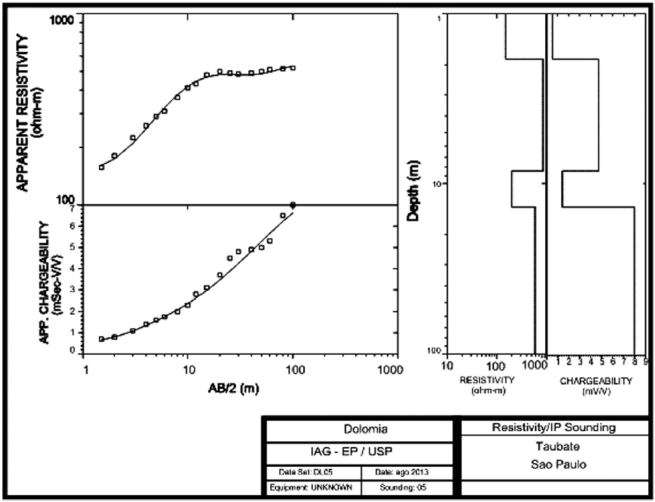
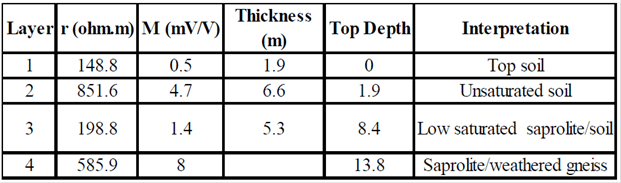
In the data concerning VESs 05, 06, 24, 27, and 28, resistivity values below 1000 ohm.m were observed for the last layer, which is interpreted as saprolite or weathered gneiss. These relatively low values suggest a rock with some degree of alteration and/or fracturing.
Figure 7 and Table 5 present the geo-electrical model for VES 05, in which the fourth layer is characterized as saprolite or weathered gneiss.
Another VES with results that clash with the other models is VES 19, where the resistivity of the layer above the layer interpreted as bedrock is relatively high (greater than 2000 ohm.m). Here it is possible that the third layer is characterized by a slightly weathered or fractured rock.
Morphological Model Update
Table 6 shows the interpreted depth of the rock top, which was used for updating the morphological model.

The interpreted data of the top of the rock layer in all VESs conducted in the area of interest were used to update the morphological model of the area.
Figure 8 shows the geological sections across the updated morphological model. Figures 9 and 10 show the geological sections AA’ and BB’ with the original model and the expanded interpretation using data from VESs.

Figure 8 Position of the geological sections across the updated morphological model.Geofísica Internacional October - December 2016 237


Conclusion
The geophysical study carried out allowed the efficient expansion of the morphological model of the deposit within the exploration permit area, taking into account the aims established:
to interpret, with adequate accuracy, the lithological units of interest (soil layer depth and the contact between soil and bedrock)
to carry out the exploration campaign in the entire area of interest within the deadlines set by the company.
The study results show that the geophysical methods proposed in this paper can be used to determine the thickness of the soil layer on the top of the bedrock and to identify the layers of interest. That is, this research has proved that geophysics can improve the level of geological knowledge for morphological modeling purposes and its application has the potential to be extended and increased within the associated activities in the mine planning cycle of a mining operation.
In practical terms, the introduction of the proposed geophysical methods and techniques allowed the gathering of information necessary for updating the morphological model, which would normally have been carried out in approximately 60 days (using between three and four drilling equipment), in 15 days, which means a 70% reduction in the work time.
It is suggested that some drill holes are carried out right next to the VESs that showed low resistivity of the gneiss to validate the interpretation of this particular lithology.
It is likely that some differences in position between the interfaces defined by geophysics and the drill holes should occur. This can be explained by the limitations of the methods and geophysical techniques in the identification of contact within highly irregular topography.

