


 nova página do texto(beta)
 Inglês (pdf)
 Artigo em XML
 Referências do artigo
 Enviar este artigo por email
 Citado por SciELO
  Similares em
SciELO
Similares em
SciELO 
 Permalink
Introduction
In the recent decades, both rapid population growth and industrial development have increased the demand of basic services such as drinking water supply. In contrast, water resources at the surface are decreasing gradually because of contamination, climatic changes and hazards. Moreover, the water resources for human consumption are continuously depleting and management of this essential resource has become a top priority in several parts of our world, particularly in semi-arid and arid regions. In addition, the vulnerability of groundwater resources to drought, over-extraction and quality deterioration must be assessed, and the natural functions of groundwater safeguarded.
According to Food and Agriculture Organization of the United Nations (FAO, 2015), the availability of water per capita per year in China decreased from 2317 m3 in 1992 to 2005 m3 in 2014, i.e. a loss of 13% in 22 years. In the same period, the water availability per habitant dropped by 28% (2115 m3 to 1526 m3) in India. In this global context, the larger cities of Mexico face similar water supply crisis.
Particularly, the aquifer system of Mexico City presents a water supply crisis. According to Leyva-Suárez (2010), the evolution of static levels measured from 1985 to 2003, show a strong dropping of the potentiometric surface, with the presence of a cone of depression of about 20 m, identified in a 6 km wide area located nearly center of the Mexico City (Figure 1).

According to the National Water Commission (CONAGUA, 2014), the water availability per person per year has decreased from 5812 m3 in 1990 to 4573 m3 in 2005. This value will continue to drop to 3430 m3 by 2030. An important part of this water (~36%) is currently exploited from underground sources. Thus, the lack of planning in water withdrawal causes the problem of groundwater overdraft leading to increasing pumping and drawdown rates inversion of the vertical hydraulic gradient, land subsidence, water quality concerns and seawater intrusion into coastal environments among others. This means that the case of Mexico City is exceptionally critical since the availability decreased 27% from 1992 to 2014. In contrast, the decline in water level was no so notorious in other countries like Germany and Japan since both these countries have reduced the availability of renewable water per capita per year by 1.3% and 3.1%, respectively in the same period (FAO, 2015).
Even if it is considered that the Basin of Mexico has a large water catchment, its inadequate management to over the centuries has limited the population to safeguard sustainable access to a good quality and quantity resource (United Nations, 2013).
This scenario has forced the authorities to search new sources of fresh water in deeper aquifers. The San Lorenzo Tezonco well, drilled in 2014, reached 2008 m depth and presently provides a flow up to 90 L/s to eastern zone of the City (Morales-Casique et al., 2014; Arce et al., 2015). However, the adverse water quality and increased costs to make it affordable to the population are some of the associated problems. With this discouraging background, increasing the knowledge of groundwater resources (new affordable sources and proper development management strategies) becomes a top priority in Mexico City.
The Ciudad Universitaria campus (CU) is located at the southern zone of Mexico City. It is the biggest campus of The National Autonomous University of Mexico (UNAM), one of the most important public universities in Mexico (Figure 2). This zone of the aquifer supplies drinking water to an approximate 150,000 population and there is no available information of the physical characteristics of this portion of the aquifer (González-Villarreal et 2008). In 2007, as a result of 4th World Water Forum held in Mexico, UNAM proposes the implementation of PUMAGUA, a program to management, use and recycling water resources within their university campí. This program has been basically focused in management of networks water distributions. However, the current state of groundwater at its principal campus has not been studied in detail. Thus, the present study is a first attempt to characterize the aquifer region at this campus zone.

Figure 2 Location of the TDEM soundings within Ciudad Universitaria campus. Purple circles depict currently abstraction wells.
Three different wells located inside the campus extract about 100-170 L/s (Figure 2). Nevertheless, a gradual drop in the water table has led to reduce the total extraction to a third part of the usual withdrawal (Rocha-Guzman, 2010). The overdraft resulted in the increasing salinity that affects both water quality and integrity of distribution pipelines. It was difficult to conduct a direct characterization of the hydrogeological units outcropping in the area as almost all the campus is covered with infrastructure (i.e. academic facilities, roads, gardens). However, a geological reconnaissance was carried out surrounding the abstraction wells. The main characterization was performed using time-domain electromagnetics (TDEM). It is a suitable geophysical technique because it does not require very large areas for data acquisition. Additionally, a pumping test was conducted in the main abstraction well in order to assess the hydraulic properties of the aquifer. Therefore, the integration of these techniques will allow inferring some important issues regarding the aquifer and its exploitation scheme in this area, to characterize geological and geophysical the local aquifer system and to contribute to a sustainable management of the same.
Geological setting
Mexico City is located within the southwestern sector of the Basin of Mexico (BM), which in turn lies between the southern boundary of the south Mesa Central and the eastern part of the Trans-Mexican Volcanic Belt (Ferrari et al., 2012), During the early Tertiary period, intense volcanic activity gave way to the Chichinautzin volcanic field called Sierra del Chichinautzin. As a result, the basin's flow pattern changed from exorheic to endorheic. It is considered as a lake plateau at 2240 m.a.s.l. and surrounded by alluvial plains and up to 5000 m high volcanic structures (Figure 1). BM is limited in the south by a trending of monogenetic volcanoes (Chichinautzin range); is bounded in the northern portion by three different ranges (Pachuca, Tezontlapan and Guadalupe); is limited in the east by the Patlachique and the Sierra Nevada ranges, and is border in the west by Monte Alto and Las Cruces ranges (Valadez-Cabrera, 2009).
Regional stratigraphy
The volcanic rocks of Las Cruces and Monte Alto ranges were mainly described by Schlaepfer (1968). They are widely distributed in the southwestern boundary of the BM, where a range of three stratovolcanoes, along with pyroclastic deposits, is oriented NNW to SSE, and divide the basins of Mexico and Río Lerma. It is covers discordantly the Middle to Late Miocene extrusive rocks and Early Pliocene volcanic units; also it is covered by Quaternary alluvial and lacustrine deposits, as well as by lava and pyroclastic flows of the Chichinautzin volcanic range. The outcropping volcanic rocks consist of lavas, conglomerates, breccias, tuffs and pyroclastic products of andesitic, dacitic and andesitic-basaltic composition. These units are also covered or interbedded with alluvial material and fluvial palaeochannels (Vázquez-Sánchez and Jaimes-Palomera, 1989).
Local geology
Before Schlaepfer (1968) described Las Cruces Formation, Bryan (1948) defined a group of pyroclastic deposits from effusive volcanic sequences of Las Cruces volcanic range deposited in water as Tarango Formation; it is mainly composed by tuffs, volcanic breccias, conglomerates, volcanic gravels of fluvial origin and layers of pumice of Pliocene age. This formation shows a very scarce fracturing and different degrees of compaction. Overlying this formation, there is a Quaternary basaltic flow erupted from the southern flank of the Xitle volcano. This lava flow is called Ciudad Universitaria Unit and is covering part of the study area as pahoehoe and pillow lavas type with a maximum thickness of 30 m.
Hydrogeology of the Basin of Mexico
The hydrogeological setting of the study area is a very complex system composed by different geologic units, which have different hydraulic properties. The fresh water aquifer within the BM setting is made up of Quaternary alluvial deposits, volcaniclastic and pyroclastic rocks and Plio-Quaternary basaltic-andesitic rocks. Groundwater depth ranges between 60-170 m, while saturated thickness might exceed 800 m in some areas (Hernández-Espriú et al., 2014), however, extraction wells are screened within the uppermost 300-400 m of this unit (Herrera et al., 1989). That also coincides with the geophysical characterization carried out by Campos-Enríquez et al., (1997) situating the maximum depth at 530 m.
Related to the deep hydrostratigraphy, Pérez-Cruz (1988) integrated results from four deep boreholes drilled by PEMEX after the M 8.1 earthquake occurred in Mexico City in 1985. The results suggest the presence of four different geological units reported from deepest to shallowest as: 1) Limestone unit (probably part of the Morelos and/or Cuautla formation), 2) Lower volcanic unit, 3) Upper volcanic unit, and 4) Lacustrine deposits. Regarding the limestone aquifer, only two boreholes reached it at 1500 m and 2100 m depth. The other two wells did not reach it despite one of them was drilled until 3200 m.
According to previous studies (Mooser et al., 1996; Pérez-Cruz, 1988; Vázquez-Sánchez and Jaimes-Palomera, 1989) the hydrogeological setting can be summarized into the following major units: (1) a confining aquitard (Quaternary alluvial, fluvial and lacustrine low-permeability deposits), (2) an upper granular aquifer (Quaternary alluvial, volcaniclastic and Plio-Quaternary andesitic-basaltic deposits), (3) a lower fractured aquifer (Miocene andesitic rocks and Oligocene basaltic and rhyolitic deposits) and (4) the cretaceous basement (folded and fractured limestones, sandstones and shales).
Despite all this available information, the local configuration of the aquifer within Ciudad Universitaria campus is barely known. In this sense, the development of this work aims to get a better insight of the aquifer in order to provide useful information to improve its management.
Methodology
Geophysical prospecting
Regarding geophysical characterization of natural resources (e.g. aquifers, hydrocarbons, mining and geothermal sources), it is known they are genetically related to water. Here, the physical property of the subsurface materials most affected by the change in water content is the electrical conductivity, so that many of the potential exploitation zones can be located by measuring this property (Meju et al., 1999; Meju, 2002; Fontes et al., 1997).
In particular, we decided use the time domain electromagnetic method (TDEM) to characterize the shallower part of the upper CU aquifer. TDEM physical principle involves the induction of a primary magnetic field through a square coil, which is abruptly interrupted in order to produce eddy currents into the subsurface. These currents will generate a secondary magnetic field, which can be detected by an appropriate receiver coil on the surface (Nabighian and Macnae, 1991).
Thus, it is possible to characterize the electrical property of the subsoil by measuring the voltage registered by the receiver coil, which varies according to the behavior of the magnetic field decay. Thus, this time dependent function can be transformed in an apparent resistivity curve that is used to estimate the resistivity distribution using appropriate inversion techniques (Nabighian, 1979).
Given the required conditions to implement this methodology (i.e. electromagnetic noise-free zones, flat terrain, metal-free areas) and the intensive anthropogenic activity within the campus, we have proposed as acquisition areas those designated for sport fields because they fulfill the space and flatness requirements.
Data acquisition was performed in two stages; the first one consisted of four electromagnetic soundings using a single loop configuration of 50x50 m by side. This survey was done during November 2011. In the second stage, performed during February 2012, two additional electromagnetic soundings were acquired using the same configuration. All measurements were performed with the pumping system off, using the transient electromagnetic survey system terraTEM by MonexGeoscope. The transmitting current reached between 5 and 6 amperes. To increase the statistical quality of estimations, measurements were taken with gains of 1, 10, 100 and 1000 (Figure 2).
Local hydrogeological characterization
A short-term, constant-rate pumping test was performed to borehole 2, called Multifamiliar well (next to the prospected area) as a complimentary technique. This well is one of the three main suppliers of drinking water to Ciudad Universitaria campus. Pumping tests are a widespread method for assessing the hydrodynamic behavior of aquifers and/or the mechanical performance of abstraction wells (Fetter, 2001).
The static (no pumped) water table was initially measured at a depth of 72.16 m. Then we start the test at a constant flow rate of 90 L/s during 2.16 hours. When the steady dynamic level was reached (83.67 m) the submersible pump was shutdown and we registered the buildup period, during 1.5 hours. The measurements were taken manually with an electric sounding, following overall recommendations reported in Brassington (2006).
On one hand, a non-parametric approach of the test was carried out in order to identify possible flow regimes, evaluating the semi-log and log-log drawdown transient response. On the other hand, the parametric approach was computed using analytical solutions of the general flow equation. The best fit between measured and calculated drawdown was achieved using the Hantush and Jacob model (Hantush and Jacob, 1955; Hantush, 1964) that considers an exact solution for non-steady flow to a partially penetrating well in an anisotropic, infinite leaky aquifer.
Data processing and modeling
TDEM data
After editing and averaging the decay curves, final apparent resistivity versus time curves were obtained for each TDEM station. Thereby, we could apply Occam's inversion for generating smooth and simplified geoelectrical models (Constable et al., 1987). In order to obtain detailed information about the different hydrogeological layers, one profile in an approximate EW direction was interpreted (Figure 3).

Five different geoelectrical layers were inferred from geoelectrical section, which are described below and summarized in Table 1:
Table 1 Geoelectrical units inferred from TDEM inversion.
| U1 | U2 | U3 | U4 | U5 | rms | |||
|---|---|---|---|---|---|---|---|---|
| T01 | ρa (Ohm.m) | 102 | 50 | 32 | 11 | 1 | 25 | 0.501 |
| Thickness (m) | 16 | 33 | 23 | 34 | 61 | ∞ | ||
| T02 | ρa (Ohm.m) | - | 35 | 18 | 4 | 2 | 20 | 0.287 |
| Thickness (m) | - | 45 | 24 | 13 | 70 | ∞ | ||
| T03 | ρa (Ohm.m) | - | 46 | 26 | 11 | 2 | 18 | 0.151 |
| Thickness (m) | - | 12 | 74 | 39 | 47 | ∞ | ||
| T06 | ρa (Ohm.m) | - | 13 | 30 | 6 | 1 | 15 | 0.410 |
| Thickness (m) | - | 34 | 32 | 10 | 62 | ∞ | ||
| T05 | ρa (Ohm.m) | 103 | 45 | 29 | 4 | 1 | 15 | 0.270 |
| Thickness (m) | 21 | 28 | 27 | 48 | 70 | ∞ | ||
| T04 | ρa (Ohm.m) | 94 | 50 | 33 | 8 | 1 | 17 | 0.314 |
| Thickness (m) | 24 | 34 | 29 | 22 | 71 | ∞ | ||
U1: This geoelectrical unit was only detected below sites T01, T05 and T04. This horizon the highest resistivities detected in the profile with values greater than 100 Ohm.m, and an average thickness of 20 m. Possibly related to Ciudad Universitaria Unit.
U2: This unit is underlying horizon U1, it has a variable thickness ranging from 12 to 45 m, with resistivities of 30 to 50 Ohm.m.
U3: This geoelectrical unit is showing a value resistivity between 25 to 32 Ohm.m, it has a variable thickness ranging from 23 to 74 m below site T03.
U4: It is the most conductive layer observed in the interpreted profile, showing resitivities lower than 10 Ohm.m. The top layer coincides with the reported water table depth so this horizon is related with the aquifer. It also shows internal variations reaching more conductive values beneath sites T01, T02, T06 and T05.
U5: At greater depths below 180 m, the unit U5 is observed having an average resistivity about 20 Ohm.m.
According to the stratigraphy reported in Pérez-Cruz (1988), the upper horizons inferred from borehole Copilco-1, the so-called Upper Volcanic Unit, are also correlated to our geoelectrical image. The shallower horizon described is a basaltic unit of 30 m thick coinciding with U1; underlying this horizon a 30 m breccia layer was observed, probably related to resistivity values observed in U2. Finally, this horizon is overlying a sequence of tuff and clayish tuff that reached 400 m depth, which could be correlated to units U3 to U5, depending on the water content, consolidation and clay content.
Pumping test data
Figure 4 shows the drawdown transient response during the pumping test. As noted in Figure 4a, the buildup period was measured up to quasi-static conditions, prior to pumping. In addition, the drawdown was drop in the order of ~ 6 m within the first 15 seconds of pumping, suggesting a well loss component, i.e. well skin or damage (not evaluated).
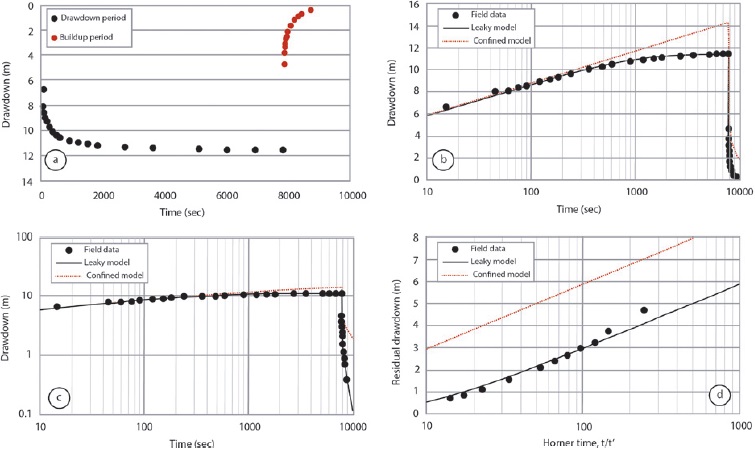
Figure 4 Drawdown transient response of the Borehole 2 (Multifamiliar) groundwater abstraction well within Ciudad Universitaria campus. (a) Drawdown and buildup periods. (b) Semi-log transient response. (c) Log-log transient response. (d) Semi-log analysis for the buildup period using Horner time. In b, c and d the continuous blue line represent the Hantush and Jacob (leaky) aquifer model and dotted red line the Theis (confined) aquifer model.
In addition, the early-time response seems to fit a straight line (Figure 4b), however, at late times (> 1000 sec), drawdown trend to stabilize. This effect suggests a constant head boundary or a leaky behavior. In order to verify this, we compare the field data with several transient models and the best fit was achieved using the Hantush and Jacob, leaky aquifer model (Hantush and Jacob, 1955; Hantush, 1964). The fitting process was optimized in both drawdown and buildup periods, based on a non-linear weighted least-squared parameter estimation, using the Gauss-Newton linearization method. With this procedure, the difference between observed and calculated drawdown (mean residual value, n = 34) is about 2.5 x 10⁻³ m. The final fit is presented in Figures 4b, c and d.
For comparison purposes, we are showing two fits: the Hantush and Jacob model and the classic Theis model (Theis, 1935) for an infinite, confined and isotropic model. As shown, the field test has a leaky aquifer behavior. Therefore, one or more low-permeability thin layers (e.g. heterogeneities within the Tarango Formation, associated to lacustrine or fine-grained sediments) located above the abstraction aquifer can be inferred from the dynamic behavior of the test, even when the geophysical prospection is not detecting this changes, due to the vertical resolution of the technique.
From the parametric approach, the leaky aquifer model allowed us to estimate the following parameters: aquifer transmissivity (T) of 480 m2/d, storage coefficient (S) of 1.3 x 10⁻³ and vertical hydraulic conductivity of the leaky layer, k', in the order of ~ 0.08, 0.4 or 0.8 m/d (rough estimation), considering hypothetical aquitard thicknesses of 1, 5 or 10 m, respectively. Note that the T estimates derive from the buildup period (Figure 4d) using the Cooper and Jacob straight line (Horner time) was computed in the order of 530 m2/d.
As far as we know, these are the first reported hydraulic parameters within the Ciudad Universitaria campus that can be used to improve groundwater management strategies in this small portion of the drinking water aquifer.
Aquifer characterization
Recently, Solano-Rojas et al. (2015) have establish the relationship between land subsidence and decreasing in groundwater levels in the Mexico City Metropolitan Area (MCMA). Their results suggest that the aquifer system is under severe stress due to the extreme groundwater extraction that far exceeds the magnitude of natural recharge. According with this study, Ciudad Universitaria campus is located within a region where the land subsidence is ranging from 5 to 26 mm/yr; which placed it in a zone with the lowest subsidence rates in the MCMA. Moreover, one of the natural recharge areas for the Basin of Mexico aquifer is located near of the study zone, which in theory helps to water table to be less affected by intensive extraction.
Within Ciudad Universitaria campus the water demand is supplied by three wells (Table 2), one of them exploited since early fifties, borehole 1. The campus is affected by the same problems as the aquifer of BM, i.e. increasing population and increasing demand of drinking water, so the extraction regimes in wells have also increased. Analyzing the water levels evolution during last ten years (Figure 5), we can establish that borehole 2 present the worst drawdown in two years, reaching a decrease of 2 m per year, while borehole 3 has a better performance to the extraction, which has declined 0.80 m per year. A linear fitting was performed to the measured levels for the three boreholes (Figure 5) showing a drawdown trending that evolves from 0.6 to 1.5 m per year, for boreholes 3 and 1, respectively.
Table 2 Boreholes in CU campus providing fresh water for 150,000 users.
| Borehole | Topographic level (m) |
Total depth (m) |
Groundwater withdrawal (L/s) |
Drop/year (m) |
|
|---|---|---|---|---|---|
| Number | Name | ||||
| 1 | Química | 2279 | 132 | 125 | 1.05 |
| 2 | Multifamiliar | 2312 | 157 | 250 | 1.80 |
| 3 | Vivero Alto | 2335 | 193 | 250 | 0.80 |
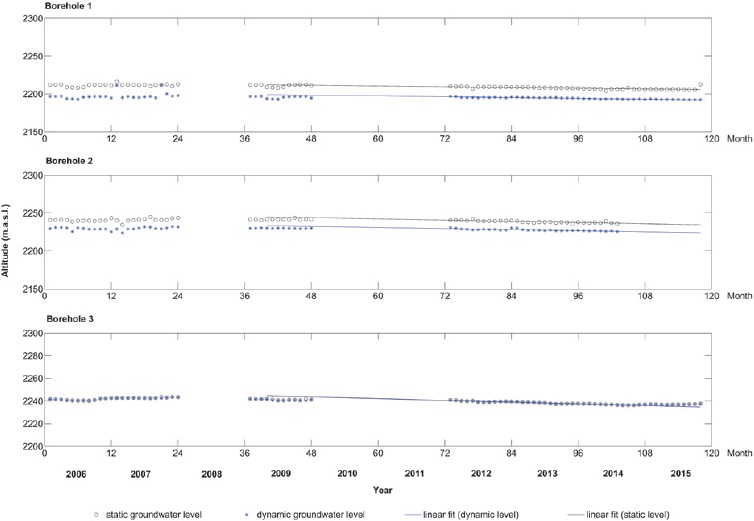
Figure 5 Evolution of the water table from 2009 to 2015 for all abstraction wells inside Ciudad Universitaria campus.
We have also analyzed two hydraulic gradients, one from borehole 1 to borehole 2 and the other one between boreholes 2 and 3. They show changes along time, i.e. about zero between boreholes 2 and 3, because the alignment between them is almost perpendicular to groundwater recharge. The obtained gradient ranges from -6.72x10⁻⁶, before 2009, to 7.23x10⁻⁵ from 2010 to nowadays. This change in the hydraulic gradient could be related to the fact that borehole 2 present the worst drawdown in recent years. The hydraulic gradient between boreholes 1 and 2 remained about 0.0259 for more than 10 years, but in 2015 reached 0.0931; this means that the aquifer is suffering more stress than before and overexploitation, moreover taking into account the alignment between boreholes 1 and 2 that is tangential to the direction of the groundwater recharge, so we could infer the potentiometric surface of the aquifer is tilting to the southeast.
Conclusions
This study characterizes electrical resistivity distribution in order to get a better insight of the hydrogeoelogical configuration of a small portion of the Mexico Basin aquifer within the Ciudad Universitaria campus. TDEM provided accurate information about the distribution of electrical resistivities in the subsurface and allow us to establish a complete hydrogeological assessment. The geoelectrical section coincides with the already reported stratigraphy of the so-called Upper Volcanic Unit (Pérez-Cruz, 1988). The shallower layer U1 corresponds to basaltic Ciudad Universitaria Unit, which shows the highest resistivity values.
Underlying this horizon we observed a layer with resistivity values about 30-50 Ohm.m that could be related to a volcanic breccia. The water table depth coincides with the presence of a conductive layer of more than 150 m thick and resistivity values below 10 Ohm.m. Finally, underlying the conductive horizon the resistivity values increase until reach a mean value of 20 Ohm.m.
If an increment on water supply is needed in the future, the geoelectrical horizon with the greatest potential for extraction is layer U4, and the water table is expected to be at 70 m depth.
Regarding aquifer characterization, the estimated drawdown for the potentiometric surface in ten years is almost of 8 m in the area of the campus. The prediction, by linear fitting, for the dropdown of water level for the three boreholes by assuming the current extraction rate for the next year is of at least 1.5 m below the current level.
The computed hydraulic gradients, between wells 1 and 2 has remained about 0.0259 for more than 10 years, but in 2015, this value reached 0.0931, denoting excessive stress on the aquifer; and between wells 2 and 3, this value fluctuates from -6.72x10⁻⁶, before 2009, to 7.23x10⁻⁵ nowadays. Thus, this change is probably related to the stress suffered by the entire BM aquifer system.
Finally, this study of a small portion of the BM aquifer can be used as a pilot model to implement improvements in the management of the entire system since this studied area could be considered as a closed hydraulic system due to the constrained interaction with the rest of the aquifer system.

