


 nova página do texto(beta)
 Inglês (pdf)
 Artigo em XML
 Referências do artigo
 Enviar este artigo por email
 Citado por SciELO
  Similares em
SciELO
Similares em
SciELO 
 Permalink
Introduction
The evaluation of amplification of seismic energy is very important because it is directly related to the damage that the structures can undergo. For this reason the analysis of the site response is an important goal in seismic hazard analysis. Site response functions are also useful to correct spectral records of ground motion generated by earthquakes, particularly for calculating accurate source parameters. The main aim of this study is to determine the site effects of the permanent stations located around the Gulf of California, Mexico and to analyze the effect of the azimuth and source magnitude of the incoming seismic energy on the site amplification. For this purpose we calculated spectral ratios between the horizontal to vertical ground-motion components (HVSR) using seismograms recorded in a wide range of azimuths. The HVSR technique was originally introduced by Nogoshi and Igarashi (1970) and was used by Nakamura (1989) to evaluate sedimentinduced amplifications from recordings of micro-tremors. Lermo and Chávez-García (1993) extended this method for S waves from earthquake records and since then the HVSR method has been used extensively to estimate site effects. More recently, Cultrera et al., (2003) observed a strong dependence of amplification with the source azimuth; they studied earthquakes within a fault zone in the Nocera, Umbra region (Central Italy) and found that in three of the stations analyzed the amplification was bigger for events with an azimuth range between 150 and 180 degrees, suggesting that the geometry and orientation of the fault zone played an important role in the site response. Another similar study was carried on by Pedersen et al. (1995) to estimate site effects in alluvial valleys of the French Alps, finding a dependence of site amplifications with azimuth and with incidence of incoming waves.
We use seismograms recorded by broadband stations located in the Gulf of California, Mexico, region from the NARS-Baja (Network of Autonomously Recording Seismographs) and the RESBAN (Red Sismológica de Banda Ancha del Golfo de California) networks, both operated by the CICESE (Centro de Investigación Científica y de Educación Superior de Ensenada, Baja California) to determine site effects and analyze the azimuth and the magnitude dependence. Figure 1 shows the region of the study, the epicenters of the earthquakes selected and the distribution of the seismic stations used.
Data
We selected 92 earthquakes recorded by the seismic stations of NARS-Baja and RESBAN networks. Most of these events are located within the Gulf of California (Figure 1) and a few of them to the west and inside the Peninsula. We analyzed records from a total of 20 stations, 15 from the NARS-Baja and five from the RESBAN networks. The NARS-Baja network operated from 2002 to 2008 and consisted of broadband stations, owned by the Utrecht University, with STS2 sensors, a global positioning system (GPS) and a 24-bit data logger (Trampert et al., 2003; Clayton et al., 2004). The RESBAN network has been in operation since 1995 and consists of 24-bit Guralp digitizers with a CMGSAM2 acquisition module, GPS for time control and CMG-40T or CMG-3ESP sensors (Castro et al., 2011). Table 1 lists the coordinates of the stations used and the geology characteristics of the sites where the stations were installed. We classified the stations in three groups according with the geological characterization of the sites. Group I corresponds to stations located on intrusive volcanic rocks with a low degree of weathering; Group II are stations located on extrusive igneous rocks with moderate weathering; Group III are stations located on poorly consolidated conglomerates or on soil.
Table 1 List of stations of NARS-Baja and RESBAN networks. Group I corresponds to stations located on intrusive volcanic rocks with a low degree of weathering; Group II are stations located on extrusive igneous rocks with moderate weathering; Group III are stations located on poorly consolidated conglomerates or soil.
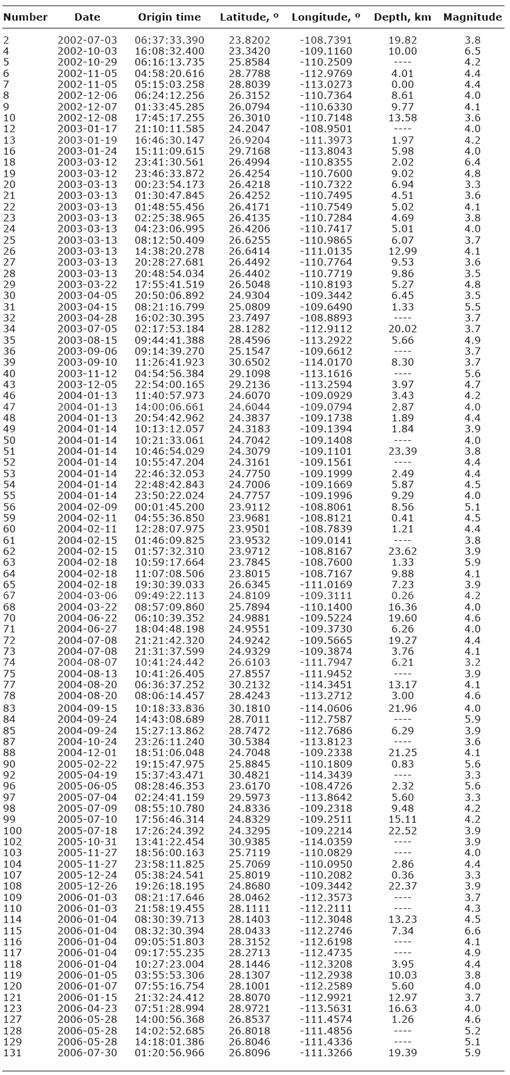
The database used consists of 92 earthquakes with magnitudes ranging between 3.2 and 6.6 and recorded between 2002 and 2006. Figure 2 shows the magnitude distribution of the events analyzed; there are a larger number of low magnitude (3.3 to 4.4) events than those with larger magnitude (M > 5.0). The RESBAN network has good detection capability and because of the wide azimuthal distribution of the stations (Figure 1), it allows the location of relatively small events. The hypocenters were relocated by Castro et al. (2011) using regional data from the networks above mentioned. They found that the epicenters have a location difference of about 43 km, for m b 3.2 to 5.0 events, respect to those reported by the Preliminary Determinations of Epicenters (PDE-National Earthquake Information Center). Events with M w 5.0 to 6.7 show a difference of 25 km on average. We use in this paper the coordinates of the events relocated by Castro et al. (2011) and listed in Table 2.
Table 2 List of events used for this analysis. The hypocentral coordinates were taken from Castro et al. (2011).
For each station we selected well recorded events having a hypocentral distance of less than 500 km. For this reason, the number of events analyzed per station is not uniform. Figure 3 shows the distribution of earthquakes per station and Figure 4, the range of epicentral distance and magnitudes of the events used in this study. The stations CHBX and NE85 were excluded from the analysis because CHBX had records only for the north and vertical components and NE85 did not have any records available for the analyzed period.
Two examples of the distribution of events per azimuth range are shown on Figure 5, for stations NE74 (upper frame) and NE76 (lower frame). We can observe that for station NE74 most events are located on the azimuth range of 91o 135o while for station NE76 most events are between 91o 135o and 316o 360o.
Method
The events selected were corrected for base line and instrument response. Then, we chose time windows containing the S wave, where most of the energy in the records is concentrated. Figure 6 shows an example of a seismogram recorded by station BAHB of event 084 (Table 2) with a magnitude of 5.9. The length of the windows selected for different stations tends to increase with epicentral distance, varying from about 2 s for local events to 85 s for regional earthquakes (Table 3). The seismograms were rotated into radial and transversal components and the Fourier amplitudes computed for the three ground-motion components. The first and last 5% of the time window were cosine tapered and the spectra smoothed using a variable frequency band, selected to preserve the energy, of ±25% of 19 predefined central frequencies between 0.16 and 10.0 Hz. The spectral amplitudes at the selected central frequency are the average amplitude within the corresponding frequency band. For instance, the amplitude at 5 Hz corresponds to the average in the 3.75-6.25 Hz band. We did not use higher frequencies because the Nyquist frequency of the records is at 10 Hz. Figure 7 shows the Fourier acceleration spectral amplitudes calculated for event 084 recorded at BAHB.
Figure 6 Seismogram for event 084, recorded at station BAHB, showing the S-wave window used to calculate the Fourier transform.
Figure 7 Sample of spectra calculated for station BAHB showing the three components for event 084. Solid line represents the radial component, dashed line, the transversal and circles, the vertical component.
We calculated spectral ratios between horizontal and vertical components of motion (radial/vertical and transversal/vertical) to obtain the site response, following the HVSR method proposed by Nakamura (1989) and extended by Lermo and Chávez-García (1993) to estimate the site amplification of the horizontal component of ground motion under the assumption that the vertical component is insensitive to site amplification. To corroborate this assumption we calculate spectral ratios between vertical components from events recorded simultaneously on a reference site and a target site. We choose station NE79 (Figure 8) as the reference site because it is localized on a solid igneous outcrop (granite). To minimize source-station path effects we selected events recorded at both stations with similar epicentral distances (with a difference of less than 52 km). Figure 9 shows the vertical component spectral ratios, using station NE79 as the reference site, obtained for stations having records with similar hipocentral distances at both target and reference sites. We observe that events with large (> 52 km) differences between source-to-target and source-to-reference distances tend to have large spectral ratios. For those stations the large target/reference ratio must be due to different attenuation effects, since the paths are not the same. Nevertheless, there are few stations (NE81, NE82 and NE83) that show site amplification on the vertical component (Figure 9) even for short differences in distance (less than 11 km). Thus, the site response estimated for those sites, based on the HVSR technique must be used with caution.
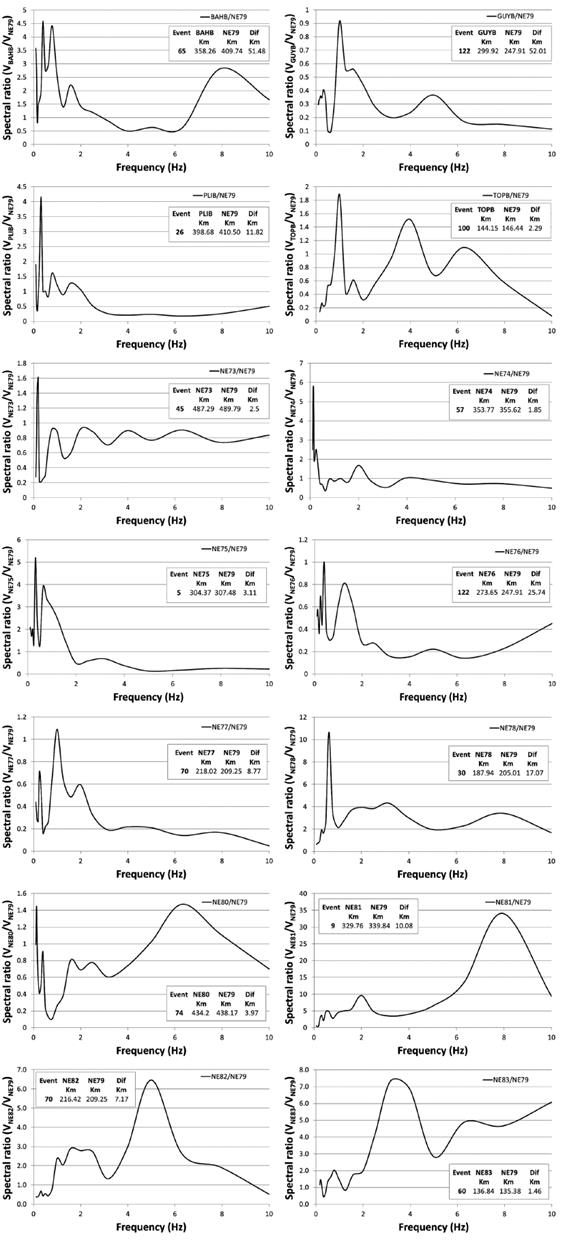
Figure 9 Vertical-component spectral ratios between the target stations and station NE79 (reference site), from events recorded simultaneously at both sites and with similar epicentral distances.
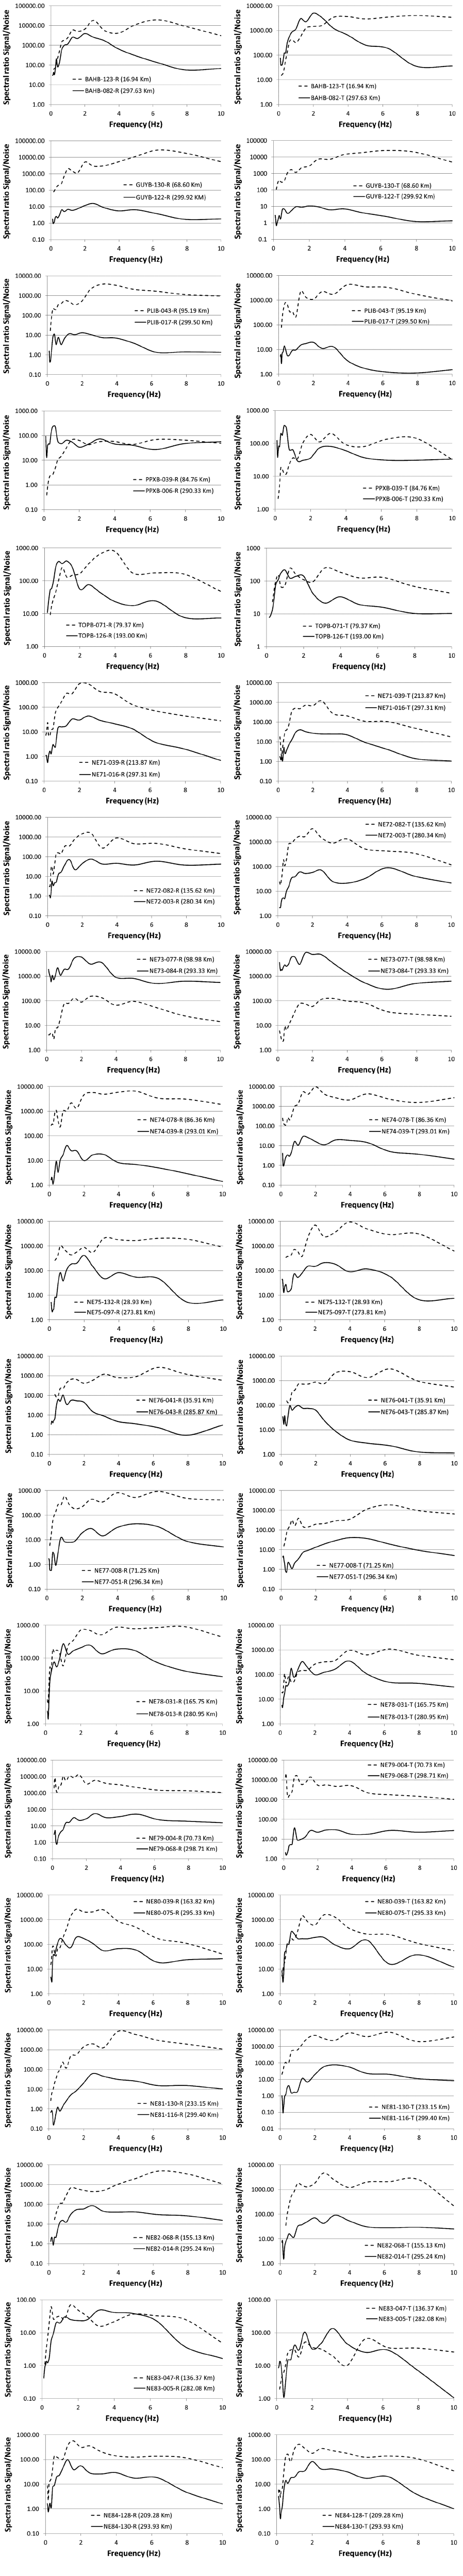
We also calculated signal to noise ratios for each station and both horizontal components (radial and transversal). We found that records with epicentral distance greater than 300 km tend to have signal/noise close to one for small to moderate earthquakes, and consequently we continue the analyses using only records with distances less than 300 km. Since all the records of station NE70 were at longer distances we did not use this site. Figure 10 shows signal to noise ratios calculated for all the sites using the closer and most distant events recorded at those stations. Station NE79, the reference site choose previously, is on solid rock and shows signal to noise ratio above one in the whole used frequency band. We found that in general, the signal to noise ratio is above 2 between 0.4 and 10 Hz for all stations.
Results
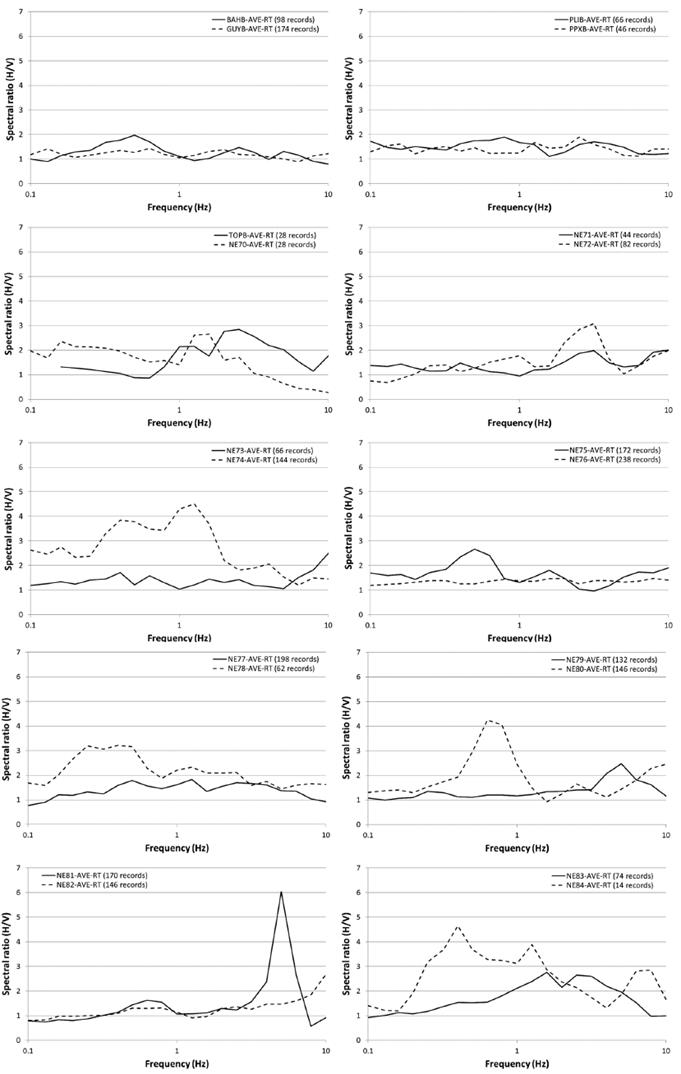
We estimated the site response of the stations of the NARS-Baja and RESBAN networks using the HVSR method. Figure 11 shows the average HVSR, for all stations, calculated using radial and transversal components. This figure shows that stations NE74, NE80, NE81 and NE84, all in group III (Table 1), present amplifications factors above 4, while stations in groups I and II have amplification factors around 3 or less. There are several stations in group III (NE70, NE72, NE78, and NE83) with smaller amplification (less than 3.2) suggesting that the soil at those sites is better consolidated. These sites also tend to have a higher fundamental frequency (2.0-5.0 Hz) than other sites in group III which have a natural resonance frequency less than 0.8 Hz. The reference site NE79 (group I) is mostly amplification free and it has a fundamental frequency close to 7.0 Hz, presenting a small amplification at that frequency (a factor of less than 2.5).
To verify these results we determined spectral ratios for two soil sites (stations NE74 and NE80) using the average site response of rock sites as reference. We can observe in Figure 12 that the amplification factors obtained for the soil sites are consistent with the previous results (Figure 9), indicating that the HVSR method provides reliable site amplifications. The peak amplifications are at the same frequencies and the shape of both functions is similar. However, the standard spectral ratio technique tends to give slightly lower amplifications because the rock sites are not completely amplification free.
Figure 12 Average spectral ratios (HVSR) calculated for soil-sites NE74 (solid line) and NE80 (dashed lines), using the average response of rock sites as reference.
We also calculated the average HVSR for different azimuth ranges, finding that four (NE74, NE78, NE80, NE81) of the 20 stations analyzed present a dependence of site amplification with the azimuth and that this dependence varies from station to station. These four stations show larger amplification factors, larger than three, than the other sites. The small amplifications observed at the other stations made it unclear whether their site response has any azimuth dependence. Figure 13 shows an example of a site (station NE74) with clear azimuthal dependence on the transversal component. In the azimuth range from 46o to 89o, corresponding to ray-paths from events located in the southern Gulf of California, the peak amplification (a factor above 8) occurs at 1.3 Hz at the transversal component and then the amplification factor decreases down to a factor of 2 for other azimuths at that frequency. Figure 14 shows the average HVSR of different azimuth ranges calculated for station NE82. This site of group II (Table 1) presents low amplifications and it seems to be invariant with azimuth. Station NE82 is one of the stations with low amplification and unclear or insignificant azimuthal dependence.
Figure 13 Average HVSR for different azimuth ranges for station NE74. Top frame displays radial component and bottom, transversal component.
Figure 14 Average HVSR of different azimuth ranges calculated for station NE82 for radial (upper frame) and transversal components (lower frame).
To evaluate if there is a persistent direction of amplification in the site response, we evaluate the amplification for rotated HVSR in the range of 20o to 180o. We selected station NE81 of group III because this station presents important site amplification at the natural resonance frequency of the site (Figure 11 and 12). Figure 15 shows average rotated HVSR of both radial and transversal components calculated using events 40 and 101 (Table 2) recorded at station NE81. We calculated the average HVSR rotating the records every 20o from 20o to 180o (e.g., Pischiutta et al., 2012). It is clear in Figure 15 that there is not a preferred average amplification direction related to angle of rotation and that the horizontal components (NS and EW) used give a single average rotated record. The dependence of the amplification with azimuth becomes evident when radial and transversal components are treated separately.
Figure 15 Average rotated HVSR components calculated using events 40 and 101 (Table 2) recorded at station NE81.
We also explore whether the site response depends on the magnitude of the earthquakes by comparing the average HVSR calculated from both horizontal components for small (M < 3.7) and larger magnitude (M=5.96.6) events (Figure 16). Since stations GUYB and PLIB (top and middle frames in Figure 16) are low-amplification sites (amplification factors below 2, Figure 11), these stations do not show magnitude dependence. For station GUYB (upper frame in Figure 16) at 0.63 Hz, the event with M=6.4 (dashed line) produced larger amplification than the other events but the amplification level is low (below a factor of 2.5). For station PLIB (middle plot in Figure 16) at 0.79 Hz, the amplification is also insignificant for the three magnitudes (M=3.7, M=5.9 and M=6.4). However, station NE74, a site with higher amplification levels (group III), up to a factor of 4.5 (Figure 11), shows an important increase of the amplification factor with increasing earthquake magnitude (bottom frame in Figure 16). For instance, at 0.4 Hz the HVSR calculated with the M=6.4 event (solid line) has higher amplification than that calculated with the M=3.3 (double line) and the M=3.2 (dotted line) events. At 1 Hz the HVSR calculated with the M=6.4 (solid line) and M=5.9 (dashed line) events have amplification factors above 8, while for the M ≤ 3.3 events the amplification factor is below 5. The HVSR calculated with the transversal component (Figure 17), where the SH waves are expected to be present, clearly shows that events with higher magnitude generate larger amplification than smaller magnitude events. At 0.4 Hz the M=6.4 event (solid line in Figure 17) generated an amplification factor of 14 while the M=3.2 (dotted line) event reached an amplification factor below eight. At 1 Hz the M=5.9 (dashed line in Figure 17) produced an amplification of 15 while the events with M ≤ 3.2 generated amplifications below 7. The amplification at 1 Hz of the M=6.4 event (solid line) is smaller than that of the M=5.9 event, suggesting that the station NE74 possibly presented a nonlinear response at 1 Hz for the M=6.4 event.
Figure 16 Average HVSR of radial/vertical and transversal/vertical components calculated using events with different magnitudes, recorded at stations GUYB (top), PLIB (middle) and NE74 (bottom).
Discussion and conclusions
We determined site response functions of 20 stations to evaluate possible azimuthdependent amplification. We found that stations NE74, NE78, NE80, NE81 and NE84, of site characterization group III, present the largest average ground motion amplification factors (above 3) (Figure 11). The frequency range where the amplification is prominent varies from 0.25 to 2.0 Hz; with the exception of station NE81 where the maximum amplification factor (around 6) occurs in the frequency range from 5.0 to 6.3 Hz. We also observed that these five sites with larger average amplification present this feature in both radial and transversal components, and show a clear dependence on the source back-azimuth. This dependence of site amplification can be explained by the likely asymmetry of the geologic characteristics under the sites, including layer thickness and velocity variations with azimuth.
Most stations are located on hard rock (group I and II in Table 1) and have low site amplification, but those with amplifications factors above 3 (sites in group III) seem to be strongly influenced by the earthquake back-azimuths. The range of frequencies and azimuths where the major site amplifications occur are different for each station. The stations that present the largest site amplifications on the transversal component are NE74, NE81 and NE83, with amplification factors above 5. NE74 (Figure 13) presents the largest amplifications for azimuths that vary from 270o to 315o (between 1 and 1.25 Hz) and for azimuths varying from 46o to 89o (between 0.5 and 2.0 Hz) for radial and transversal components, respectively. Figure 18 shows the average values of HVSR for station NE76 for different azimuths and horizontal components. Station NE76 (Figure 18) presents the largest amplifications, above 12, on the transversal component, from 270o to 315o and at frequencies from 0.79 to 3.16 Hz. This site is a clear example of the effect of the azimuth on the site response.
Figure 18 HVSR calculated for station NE76 for different azimuth ranges. Radial (upper frame) and transversal components (lower frame).
We analyzed the possible relation between average site amplification and source magnitude (average between radial and transversal components). We first determined the natural resonance frequency (fn ) of the sites, as a reference, selecting the frequency where the first peak of the average HVSR occurred (Figure 11). Then, we compared the average HVSR of the radial and transversal components, calculated from earthquakes with different magnitudes. Figure 16 shows an example for three stations: GUYB (fn = 0.63 Hz), PLIB (fn = 0.79 Hz) and NE74 (fn = 0.4 Hz). We can see from this figure that there is not a clear relation between the amplification factor and the event magnitude for the sites with low amplification (stations GUYB and PLIB). However, for site NE74 (lower plot in Figure 16), the amplification generated by the M=6.4 earthquake is larger than that produced by the lower magnitude events. In general, the softer the soil, the higher the amplification is. Attenuation studies in the Gulf of California (Vidales-Basurto et al., 2014) indicate that P waves attenuate considerably more than S waves. Thus, P waves from small magnitude earthquakes disturb the geotechnical characteristics of the soils less than moderate and large magnitude events. For the regional events that we analyzed, most of the source station distances are above 200 km and the time between the first P arrival and the first S-wave arrival is larger than 25 s. This gives time to the P wave to shake the soil-site enough to decrease the rigidity so that when the S waves arrive to the site, the shear waves find a softer soil and thus the amplification tends to increase. Thus, to explain the observed increase of site amplification with increasing magnitude, we propose that the compressional waves arriving previous to the shear waves change the geotechnical characteristics of the soils. The disturbance will depend of the shaking intensity generated by the P waves and this will increase with the magnitude of the earthquakes.
In conclusion, we find that stations of the NARS-Baja and RESBAN networks in the group site III (Table 1) present site effects with average horizontal amplifications factors above 3. We also observe that these stations show important azimuthal dependence. The natural resonance frequency and the azimuth of incoming waves that generate the largest site effects observed vary for each station.Station sites with significant amplification factors (above 3) also show increasing amplification with increasing source magnitude.

