


 nueva página del texto (beta)
 Inglés (pdf)
 Artículo en XML
 Referencias del artículo
 Enviar artículo por email
 Citado por SciELO
  Similares en
SciELO
Similares en
SciELO 
 Permalink
Introduction
Seismic activity was very intense along the Guerrero segment of the Mexican subduction zone between 1899 and 1909. During this period seven large/great earthquakes occurred on the plate interface between ~ 99 °W and 101 °W [24 Jan. 1899, Ms 7.5; 15 Apr. 1907, Ms 7.7, Mw 7.9; 26 Mar. 1908, Ms 7.6, Ww 7.5; 27 Mar. 1908, Ms 7.0, Mw 7.2; 30 Jul. 1909; Ms 7.3, Mw 7.5; 31 Jul. 1909, Ms 6.9, Mw 7.0; 16 Dec. 1911, Ms 7.6, Mw 7.6] (Figure 1) (Appendix A). Instrumental locations of these earthquakes are very poor. The damage and felt reports along the Guerrero coast of Mexico of some of these events are not extensive enough to delineate their rupture areas with confidence. The exceptions are the earthquakes of 1907 and 1909 whose rupture areas were near the towns of San Marcos (~ 99.2 °W) and Acapulco (~ 100 °W), respectively (Appendix A). Thus, there is little doubt that the plate interface near Acapulco and SE of it broke during some of the events of the 1899-1911 sequence. The damage reports also suggest, albeit less conclusively, that 1899 and 1911 earthquakes ruptured the interface NW of Acapulco between 100 °W and 101 °W.

Figure 1 (a) Tectonic setting and epicenter or estimated rupture areas of large earthquakes in and near Guerrero segment of the Mexican subduction zone. The epicenters of 1899-1911 earthquakes have large uncertainty (Appendix A). Earthquakes of 1908 fall outside the area covered by the map. Lack of large earthquakes since at least 1911 between ~100 °W - 101 °W defines the NW Guerrero seismic gap. Except for the doublet of 1962 (MS7.1, 7.1) and the earthquake of 1989 (Mw6.9), no large/great event has occurred in the segment between ~99 °W - 100 °W since 1957. This segment is designated as the SE Guerrero seismic gap. (b) Focal mechanisms of well-located earthquakes using local and regional data (adopted from Pacheco and Singh, 2010) are shown at their epicenters in red (shallow-dipping thrust), green (steeply-dipping thrust), and blue (normal fault). Epicenters and mechanisms of earthquakes in grey are taken from global CMT catalog; the locations of these events are not well determined from local and regional data. Dashed green line defines the transition between shallow-dipping interplate and steeply-dipping intraslab earthquakes. NTE: near-trench earthquakes with deficient high-frequency radiation and large centroid delay time.
The segment between ~ 99 °W and 100 °W experienced large earthquakes on 11 May 1962 (Ms 7.0, Mw 7.2), 19 May 1962 (Ms 6.7, Mw 7.2), 28 Jul. 1957 (Ms 7.5, Mw 7.7), and 25 Apr. 1989 (Mw 6.9) (Figure 1). However, no large earthquake (Mw ≥ 7.0) has occurred between 100 °W and 101 °W at least since 1911. Immediately to the NW of 101 °W, the plate interface ruptured in 22 Feb. 1943 (Ms 7.5, Mw 7.4), 14 Mar. 1979 (Mw 7.4), and 21 Sep. 1985 (Mw 7.5) (Figure 1). Based on this seismic history, the segment from ~ 99 °W to 101 °W was designated a seismic gap and was called the Guerrero seismic gap (Singh et al., 1981). The fact that the occurrence of large earthquakes is clearly documented between ~ 99 °W and 100 °W but is uncertain between ~ 100 °W and 101 °W, it is convenient to divided the gap in two segments: the NW segment extending from ~ 100 °W to 101°W, henceforth called the NW Guerrero gap, and the SE segment from 99 °W to 100 °W, henceforth denoted as the SE Guerrero gap (Ortiz et al., 2000). Since recurrence period of large earthquakes along the Mexican subduction zone is about 30 to 60 years (Singh et al., 1981), the SE Guerrero region may also be considered a mature seismic gap.
Anticipation of large/great earthquakes in the region led to the installation of Guerrero Accelerographic Array in 1985 (Anderson et al., 1986, 1994). Soon after the completion of the array, the Michoacán earthquakes of 19 and 21 September1985 (Mw 8.0, 7.5) ruptured the plate interface NW of the seismic gap. The earthquake of 19 September 1985 caused unprecedented damage and death in Mexico City, which led to increased concern about the occurrence of similar earthquakes in Guerrero. As a consequence, the accelerographic and seismic networks in the region were improved and strengthened, and a seismic alert system for Mexico City, triggered by earthquakes in the gap, became operational. A seismic network was operated during 1987-1993 to monitor the seismicity and to map the geometry of the subducted Cocos plate beneath the region (Suárez et al., 1990). In a collaborative effort among Caltech, U.C. Los Angeles and UNAM, called the MesoAmerican Subduction Experiment (MASE), a portable array of 100 broadband seismographs, spaced 5 km apart, was operated between Acapulco and Tampico during 2005-2007 (Pérez-Campos et al., 2008). Analysis of the data produced by the permanent networks, and temporary and portable arrays has resulted in a much improved knowledge of seismicity and seismotectonics of the region, including the geometry of the subducted Cocos plate (e.g., Suárez et al., 1990; Singh and Pardo, 1993; Pardo and Suárez, 1995; Pérez-Campos et al., 2008; Song et al., 2009; Husker and Davis, 2009; Pacheco and Singh, 2010). Seismicity and focal mechanisms in the Guerrero segment, based on local and regional data, reveal that the Cocos plate subducts below Mexico at a shallow angle, reaching a depth of 25 km at a distance of 65 km from the trench (~ 5-10 km inland from the coast). An unbending of the slab begins at this distance. The slab becomes horizontal at a distance of ~ 120 km at a depth of 40 km. Earthquakes and focal mechanisms shown in Figure 1b, based on Table 1 of Pacheco and Singh (2010), summarizes the seismicity and seismotectonics of the region: (a) a relatively wide band (~ 60- 65 km) of shallow-dipping thrust events which extends from near the trench up to the coast, (b) a narrow band of events about 15-25 km inland in the depth range of 25-40 km, mostly exhibiting downdip compression, (c) a hiatus in the inslab seismicity from about 85 to 160 km from the trench and a resumption of normal- faulting earthquakes which, finally, cease at a distance of ~ 240 km. There is also evidence of a thin (~ 3-5 km) ultraslow velocity, high-pore pressure fluid layer at the top of the subducted oceanic crust of the slab (Song et al., 2009; Kim et al., 2010).
Table 1 Source parameters of the 18 April 2014, Papanoa, Mexico earthquake.
| Source | Lat., °N | Lon., °W | Depth, km | Strike,° | Dip,° | Rake,° | M0,Nm |
|---|---|---|---|---|---|---|---|
| This study | 17.375 | 101.055 | 15* | - | - | - | - |
| SSN | 17.182 | 101.195 | 18.0 | - | - | - | - |
| Regional W-phase+ | 17.35 | 101.230 | 21.5 | 300 | 23 | 95 | 8.58×10¹⁹ |
| NEIC | 17.397 | 100.972 | 10 | - | - | - | - |
| USGS, CMT | 17.397 | 100.972 | 10 | 312 | 23 | 114 | 7.72×10¹⁹ |
| USGS, W-phase, CMT | 17.397 | 100.972 | 21.5 | 302 | 20 | 99 | 8.49×10¹⁹ |
| Global CMT | 17.55 | 101.25 | 18.9 | 303 | 18 | 98 | 1.00×10²⁰ |
*Depth fixed.
+Base on a real-time algorithm implemented at Institute of Geophysics, UNAM, which uses regional waveforms recorded on SSN broadband stations. The depth was fixed in the inversion and a grid search was performed for the centroid location.
The region is also equipped with a sparse distribution of continuous GPS stations. This network has detected the occurrence of large, slow seismic events (SSEs) in the region with a periodicity of ~ 4 years: in 1997-1998, 2001- 2002, 2006, and 2009-2010 (e.g., Lowry et al., 2001; Kostoglodov et al., 2003; Iglesias et al., 2004; Yoshioka et al., 2004; Kostoglodov et al., 2010; Radiguet et al., 2011; Radiguet et al., 2012). In these episodes the slow slip in NW Guerrero was not only confined to the near- horizontal segment of the plate interface but extended to the updip portion of the slab up to ~ 10 km inland from the coast, at least for the 2006 event (Radiguet et al., 2011; Cavalié et al., 2013). The source inversion shows that part of the slip area may have extended offshore. Radiguet et al. (2012) and Cavalié et al. (2013) report that, due to such aseismic energy release, the secular slip deficit in the seismogenic zone of the NW Guerrero seismic gap is one fourth of the adjacent segments, suggesting that this may be the reason for longer recurrence period in the segment. The most recent SSE in the region began in January, 2014. The 18 April 2014 Papanoa earthquake (Mw 7.3) occurred during this SSE episode.
In the context of the SSEs and other related phenomena (e.g., tectonic tremors) observed in the region, and the concern over the seismic potential of the Guerrero seismic gap, a detailed study of the Papanoa earthquake acquires special interest. In this paper, we present an analysis of the earthquake and the subsequent seismic activity in the region based, mostly but not exclusively, on local and regional data.
Local recordings and the location of the earthquake
In and near the epicentral region, there were two permanent broadband stations (ZIIG and CAIG) belonging to Servicio Sismológico Nacional (SSN, Mexican Seismological Service), which are also equipped with accelerometers and GPS receivers, and four accelerographic stationsbelonging to the Institute of Engineering, UNAM (PET2, SLU2, NUX2, and SUCH) (Figure 2). In addition, there were four accelerographic stations (GR01, GR02, GR13, GR14), belonging to the Mexican seismic alert system (SASMEX), which recorded the event. SASMEX data could not be used in location and in quantitative analyses since these accelerograms did not have absolute time and the quality of recordings was relatively poor. The broadband seismograms at ZIIG and CAIG were clipped during the mainshock. We used accelerograms at these stations in our analysis.

Figure 2 Permanent stations in the epicentral region. Azimuths of the hypocenter of the mainshock with respect to stations ZIIG, PET2, SLU2, SUCH, and NUX2, determined from P-wave polarization, are shown. The location of the mainshock and the aftershocks 8 May (Mw6.5) and 10 May (Mw6.1) are shown by circles and are marked M, A1, and A2, respectively.
The location of the earthquake presented usual problems associated with large coastal earthquakes in Mexico. It was difficult to pick S wave corresponding to the first P wave on local recordings. The density of stations is still relatively sparse and crustal structure too poorly known for precise location of the event with only the arrival times of P-wave. P-waves of this earthquake on local seismograms were emergent. Thus, to locate the earthquake we used both P-wave arrival time and azimuth of the source at stations ZIIG, PET2, SLU2, NUX2, and SUCH (Figure 2). We measured the azimuth by plotting the horizontal displacement polarization during the first 3 s of P wave (Figure 3). The convergence of the azimuths points to a source near the town of Papanoa (Figure 2). We fixed the depth at 15 km and searched for a location in the neighborhood of the convergence area which, using the crustal model employed by SSN, gave the minimum P-wave arrival-time rms error. This location is given in Table 1 along with those reported by other agencies. We note that the GCMT epicenter is 28 km to N47oW of the epicenter obtained from local data (Figure 2).
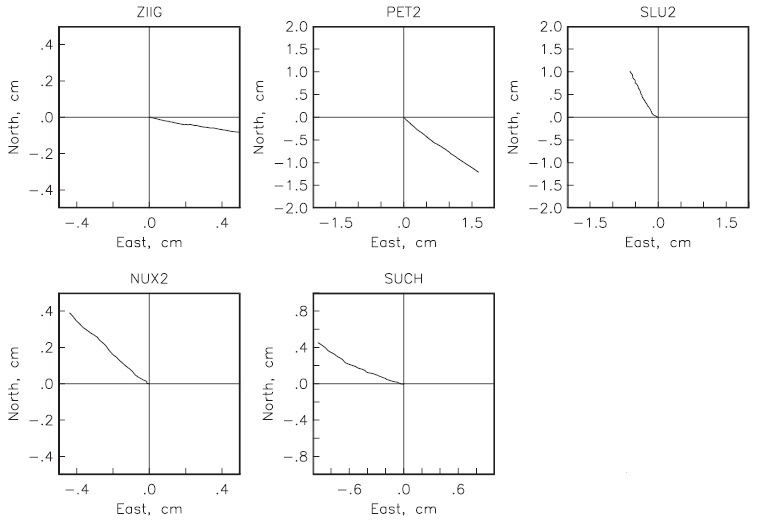
Figure 3 Polarization during the first 3 s of P wave of the mainshock at ZIIG, PET2, SLU2, SUCH, and NUX2, used in the location.
Some observations from local recordings
Figure 4 shows plots of acceleration, velocity, and displacement traces at local stations from NW of the epicenter (UNIO, ZIIG, PET2) to the SE (SLU2, NUX2, SUCH, CAIG). The velocity and displacement traces were obtained from direct integration of the accelerograms. The traces begin at the arrival of P wave. As expected, the static displacements at most stations are unreliable. This is illustrated in Figure 5 where the displacements at ZIIG from double integration of acceleration traces and 1-s GPS data are compared (GPS station ZIHU is collocated with the seismographic station ZIIG). The figure demonstrates the need for collocation of accelerograph and GPS receiver if we wish to retrieve true ground displacement valid from infinite period to high frequencies. The static displacement at Tecpan GPS site was negligible as was also the case at CAIG.

Figure 4 Acceleration, Arias intensity, velocity, and displacement at (a) UNIO, (b) ZIIG, (c) PET2, (d) SLU2, (e) NUX2, (f) SUCH, and (g) CAIG. Displacement was obtained from double integration of base-line corrected acceleration, without applying any filter.

Figure 5 (a) GPS time series at ZIHU for the period 2000 - August 2014 (sampling 0.03 Hz). The ellipses enclose co-seismic displacement for the 18 April 2014 earthquake. Post-seismic displacement associated with the event is clearly visible.
Figure 4 includes plots of Ii (t) = ∫ a2 i (t)dt, where the integration is performed beginning at the arrival of P wave up to the end of the accelerogram, and i refers to the component of the accelerogram. The plots list the "effective" duration of each component, defined here as the time window that includes 5 to 95% of Ii (t).
Some source characteristics can be inferred from the visual inspection and preliminary analysis of local recordings:
The effective durations on the horizontal components at UNIO, ZIIG, and PET2 (to the NW of epicenter) range between 10 to 15 s while it is between 20 to 35 s at SLU2, NUX2, SUCH, and CAIG (stations to the SE of the epicenter). This suggests that the rupture propagated towards NW. Negligible static displacement field at Tecpan shows that the rupture did not extend till this town.
Three bursts of high-frequency radiation are visible in the acceleration traces at SLU2, NUX2, and SUCH. Two bursts are also seen at PET2. At ZIIG and UNIO the two bursts are not very clear.
The displacement traces at SLU2, NUX2, and SUCH are dominated by a single, simple S-pulse. The displacements at these stations corresponding to the two later high-frequency bursts are relatively small. S-waves from the second and third bursts at these stations arrive ~7s and 20 safter the S wave from the first burst. The displacement traces at PET2 and ZIIG consist of three, closely-spaced S-pulses. A simple working model, consistent with the observations, may consist of three sources, the first involving larger slip than the other two. The first source is located near the hypocenter ~ 20 km NW of SLU2, near the town of Papanoa (Figure 2). The second source is located roughly 10 km from the first source towards PET2. The third source is located between PET2 and ZIIG. Because of the proximity of the second and third sources, and larger slip during the first source, their corresponding S pulses are seen at PET2 and ZIIG. However, the latter two sources are relatively far from SLU2, NUX2, and SUCH. Hence, the first pulse dominates the record.
A subsidence of ~ 4 cm at ZIIG (Figure 5) suggests that if the rupture propagated up to this station then the slip on the fault probably did not extend more than about 8 km inland of this station. This conjecture is based on Okada's model (Okada, 1992; Figure 3 of Singh et al., 2012).

Slip on the fault from inversion of teleseismic seismograms with some constrain from local GPS data
Results from slip inversion, based on teleseismic data, were reported soon after the earthquake by NEIC and C. Mendoza (personal communication, 2014). NEIC inversion uses the NEIC hypocenter (17.6 °N, 100.7 °W, H = 24 km; Table 1). It shows two patches of slip: a compact, approximately circular area of ~10 km radius centered at the hypocenter and a diffused second patch with maximum slip occurring ~ 35 km to the WSW of the first patch. The moment rate function includes a third pulse which begins about 27 s after the first pulse and lasts for ~ 16 s. The slip distribution obtained by C. Mendoza, who uses 17.55 °N, 100.82 °W, H = 24 km as the hypocenter, is similar to that reported by NEIC. Since the locations used by NEIC and C. Mendoza are 45 km to N56°E and 32 km to the N52°E, respectively, with respect to the location estimated here, the slip areas obtained in these inversions are shifted inland accordingly.
In our inversion we applied the same simulated-annealing, wavelet domain wave- form inversion algorithm as used by NEIC (Ji et al., 2002a, b) to invert teleseismic body and surface waves for the slip on the fault plane. We used a total of 29 P-waves, 34 S-waves, 29 Rayleigh waves and 29 Love waves. In addition, we included the static displacement measured by the GPS instruments of the SSN at ZIIG (Figure 5) and Tecpan (TCPN, which was taken as zero) in the inversion. We used the hypocenter location and origin time determined in this study (Table 1) as well as that reported initially by the SSN (Table 1). We inverted for the magnitude, direction and duration of slip at each 10 × 10 km2 subpatch of the fault. The slip-rate function of each fault was parameterized by an asymmetric cosine function (Ji et al., 2002a). The timing of the initial slip in each patch was constrained to follow a rupture velocity of 2-3 km/s. First the body-wave arrivals were aligned on theoretical travel times based on a 1D Earth model. However, we found large apparent time shifts between observed and calculated seismograms, caused by the 3D structure of the Earth. The systematic variation of these shifts with azimuth is probably also responsible for the large mislocation of the hypocenter by global agencies, mentioned above. To minimize the effect of unmodeled 3D structure on the result, we manually aligned the body-wave phases on the first observable arrival in the seismogram. At stations where we could not identify the first arrival, we aligned them to be consistent with neighboring stations. The distribution of slip on the fault plane determined by the inversion, projected to the surface of the earth, is shown in Figure 6a and b. The figure also shows computed and observed static field at Zihuatanejo (ZIIG) and Tecpan (TECP). Observed and synthetic seismograms are compared in Figure 6c. The observations are well fit by the synthetics. The total seismic moment obtained from the modeling is 8.32×10¹⁹ Nm (Mw 7.2).

Figure 6 (a) Slip of the fault from inversion of teleseismic body and surface waves, and static field at ZIIG and Tecpan using hypocentral location from this study (Table 1). Circles: aftershocks (see text). Source time function for the solution is shown. (b) Same as (a) but using hypocentral location initially reported by SSN.
There are two significant regions of slip, one near the hypocenter and the other ~ 40 km to WSW (Figure 6a). The first slip area is similar to that reported by NEIC and C. Mendoza but the second one is more concentrated than in the other two studies. The location of this area suggests that it probably corresponds to the third burst of high-frequency energy, seen in the accelerograms at SLU2, NUX2 and SUCH. The region of the second emission of high-frequency energy is not resolved in the inversion.

Figure 6 (c) Comparison of observed and synthetic teleseismic seismograms corresponding to the inversion using hypocentral location from this study.
A comparison between the slip models obtained using the hypocenter determined in this study (Figure 6a) versus that reported initially by SSN (Figure 6b), shows that the relative location of the slip patches to the hypocenter and each other remains similar. However, the absolute location varies significantly. This shows how critical an accurate hypocenter location is.
Aftershocks of the 18 April 2014 earthquake
Following the earthquake, the Institutes of Geophysics and Engineering of UNAM installed a portable network of three broadband seismographs and two accelerographs in the epicentral zone. This network became operational within about 24 hours. Analysis of the data from this network is in progress. In this report we present location of the aftershocks based only on the permanent seismic network. We located 108 aftershocks (2.4 ≤ M ≤ 5.2), which occurred within 36 hours of the mainshock. In locating the earthquake we also used the azimuth of the source obtained from P-wave polarization. Keeping the depth free or fixing it at 15 km only slightly changed the epicentral locations. The aftershocks (from our preferred depth- free locations) define an area of ~ 40 km × 70 km, with major length oriented N75oE, situated between Papanoa and Zihuatanejo (Figure 6). This area encloses the inverted slip region. However, there were few aftershocks in the area of large slip corresponding to the first subevent. Aftershocks suggest that the rupture reached inland and extended ~ 30 km updip from the hypocenter. About 50 % of the aftershock area lies onshore. Generally, the aftershock and slip distributions are consistent with each other. A large fraction of the 2014 aftershock area overlaps with that of the 1979 earthquake (Figure 6a). A small part also falls in the aftershock area of the 21 September 1985 earthquake.
The slip contours during SSEs of 2001- 2002, 2006, and 2009-2010 (adopted from Radiguet et al., 2012) are shown in Figures 7a, 7b, and 7c along with the aftershock areas of large earthquakes in the region. The figure shows that the area of large slip during first subevent of the 2014 earthquake (located inland, Figure 6a) had previously slipped 6 - 10 cm, ~ 2 cm, and 6 - 10 cm during these previous SSE episodes.

Figure 7 Slip contours (thin lines) during seismic slip events of (a) 2001-2002, (b) 2006, and (c) 2009-2010 adopted from Radiguet et al. (2012) for geometry B of the plate interface. The aftershock areas of large earthquakes in the region are shown by thick contours. Star denotes the epicenter of the 2014 earthquake.
The two largest aftershocks occurred on 8 May (Mw 6.5) and 10 May (Mw 6.1). During 8 May earthquake a bridge in Tecpan collapsed. The earthquake was strongly felt in Mexico City. The source parameters of these events are listed in Table 2. A careful analysis of spectral ratios of the recordings of these aftershocks shows that the rupture during the 8 May earthquake propagated SE, towards Acapulco, whereas the opposite occurred during the 10 May event. For the sake of brevity, we abstain from presenting a detailed analysis here. These aftershocks generated their own aftershock sequences. As seen in Figure 6, the location of these events and their aftershocks are separated from the aftershock and slip areas of the mainshock.
Table 2 Source parameters of the aftershocks of 8 May 2014 (Mw6.5) and 10 May 2014 (Mw6.1).
| Date; Hr: Min: Sec | Lat., °N | Lon., °W | Depth, km | M0, Nm | Mw | Strike, ° | Dip, ° | Rake, ° | Source |
|---|---|---|---|---|---|---|---|---|---|
| 08/05/14; | 17.033 | 100.922 | 18F | 9.64×10¹⁸+ | 6.6+ | 297+ | 11+ | 89+ | This study |
| 17:00:16.0 | |||||||||
| 08/05/14; | 17.300 | 100.690 | 23.2 | 6.67×10¹⁸ | 6.5 | 289 | 21 | 83 | Global CMT |
| 17:00:22.1 | |||||||||
| 10/05/14; | 07.159 | 100.831 | 24.0 | 2.19×10¹⁸+ | 6.2+ | 296+ | 10+ | 94+ | This study |
| 07:36:01.4 | |||||||||
| 10/05/14; | 17.300 | 100.730 | 20.9 | 1.86×10¹⁸ | 6.1 | 283 | 19 | 76 | Global CMT |
| 07:36:06.8 |
Clearly these two large aftershocks occurred in the NW Guerrero seismic gap.
SSE of 2014 and the Papanoa earthquake
As mentioned earlier, a slow slip event was in progress in Guerrero at the time of the Papanoa earthquake. Location of some selected GPS stations and the corresponding GPS time series are shown in Figures 8a and 8b, respectively. Clearly, slip during the 2014 SSE extended to the north at least until IGUA (Iguala) and to the south upto the coastal stations of CAYA, COYU, ACYA, and TCPN. A visual examination of the traces in Figure 8b suggests that the SSE may have started near ACYA. As expected, large coseismic displacement caused by the 2014 Papanoa earthquake is observed at station ZIHP (see, also, Figure 5) and PAPA which lie above the rupture area. It is also visible at sites outside the epicentral zone, e.g., at TCPN, CAYA, and IGUA. Curiously, ZIHP shows small, if any, displacement during the SSE prior to the earthquake. This may also be true for PAPA, although the data was lost during the critical time period. It seems very likely that the region of seismic slip during the mainshock did not experience slow slip during the 2014 SSE prior to the rupture. Whether 2014 earthquake was triggered by the 2014 SSE must await mapping of the slip evolution in time and space which is currently in progress.

Figure 8 (a) Map showing location of some GPS sites in Guerrero. (b) Northern displacement beginning 2013 at sites shown in (a). Vertical lines indicate origin times of 18 April 2014 Papanoa earthquake and its largest aftershock of 8 May. Beginning of SSE in January of 2014 is visible at most stations, except at ZIHP and perhaps also at PAPA.
Radiated seismic energy and source spectrum
Seismic energy, Es , for the mainshock was estimated from teleseismic (8.5 × 10¹⁴ J, Me = 7.03) and regional data (3.1 × 10¹⁵ J, with corresponding energy magnitude Me = 7.43) independently. For the first, we follow Boatwright and Choy's (1986) methodology as modified by Pérez-Campos and Beroza (2001) and Pérez-Campos et al. (2003).This includes a stronger attenuation correction for subduction earthquakes and a generic site correction for hard rock sites (Boore and Joyner, 1997). For the regional estimation, we followed Singh and Ordaz (1994), and included a site correction suggested by Pérez-Campos et al. (2003). Difference between these two estimates, a factor of 3.6, is reflected in the source spectra obtained from each set of data (Figure 9b). The teleseismic spectrum is depleted at high frequencies with respect to the regional spectrum. One possible explanation is that some energy is being trapped in the hanging wall (Brune, 1996), resulting in larger values of Es for the regional estimates and lower values of Es for stations in an azimuthal range of 0-150o than for stations within a range of 260-360o (Figure 9a). If we use regional stations within 260-360o of azimuth, we obtained an average Es = 1.08 × 10¹⁵ J (Me = 7.12), only a factor of 1.3 from the teleseismic estimate. Another possible explanation is directivity. Although understanding the cause of the discrepancy between teleseismic and regional estimates of Es has important implication in ground motion prediction, it is beyond the scope of this paper.

Strong ground motions in Mexico City
The earthquake was strongly felt in Mexico City and caused general panic. The damage, however, was minor. Several walls collapsed and cracks were reported in some facades. The city suffered partial power outage. It is interesting to compare ground motions in Mexico City during this earthquake with those recorded during other recent large earthquakes. We illustrate this comparison at CU and SCT, representative sites of hill- and lake-bed zones, respectively.
Accelerograms of Mexican earthquakes recorded on CU campus of UNAM are available since 1964. PGA (PGA = [( A2 n + A2 e )/2]1/2), where An and Ae are peak accelerations on NS and EW components, respectively) during the Papanoa earthquake was 13.7 gal, the fourth largest produced by interplate subduction earthquakes since 1964. The other three earthquakes were: 19 September 1985 Michoacán, Mw 8.0 (30 gal); 14 March 1979 Petatlán, Mw 7.4 (18.3 gal); and 21 September 1985 Michoacán- Guerrero, Mw 7.5 (13.9 gal). Figure 10a shows the median Fourier spectra of the two horizontal components. The spectral amplitudes of all four events are about the same above 2 Hz. However, the 19 September 1985 earthquake has significantly higher spectral level below 2 Hz, followed by the 1979 earthquake. The spectra of the earthquakes of 21 Sep. 1985 and 2014 are similar above 0.4 Hz and the PGA values are almost same.
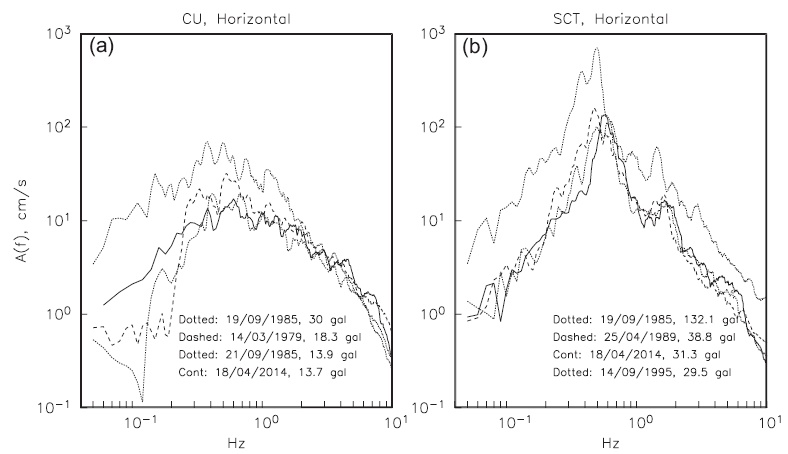
Figure 10 (a) Fourier acceleration spectra (median of the two horizontal components) at CU, a hill-zone site, during four interplate earthquakes with largest PGA values recorded at the station since 1964. PGA values are given in the figure. (b) Same as (a) but at SCT, a lake-bed zone site.
SCT station, located in the lake-bed zone, did not exist in 1979 and the accelerograph malfunctioned during the 21 Sep. 1985 earthquake. Figure 10b shows median Fourier spectra of four interplate earthquakes with largest recorded PGA at SCT. These events are: 19 Sep. 1985 Michoacán, Mw 8.0 (132.1 gal); 25 Apr. 1989 San Marcos, Mw 6.9 (38.8 gal); 18 Apr. 2014, Mw 7.3 (31.3 gal); and 14 Sep. 1995, Copala, Mw 7.3 (29.5 gal). The spectral level of the 19 Sep. 1985 is higher than for the other events. 1989 earthquake has slightly higher spectral level between 0.2 and 0.6 Hz than the other two events, which have very similar spectra as well as PGA values.
We recall that during the 1979 earthquake a building of Iberoamericana University in the lake-bed zone collapsed. PGA during this earthquake at CU was 18 gal. The earthquake of 1989 caused some damage to the city. During the 1989 earthquake the PGA values were 12 and 39 gals at CU and SCT, respectively. This suggests that some damage to Mexico City from an interplate earthquake may be expected if PGA values at CU and/or SCT exceed ~ 15 and 40 gal, respectively. It is worth remembering that these values at CU and SCT during the disastrous 19 September 1985 earthquakes were 30 and 132 gals, respectively.
Damage and Iso-Acceleration Contours
The earthquake caused significant damage to Papanoa and other coastal towns in the epicentral zone. The highest PGA (geometric mean of the two horizontal components) of 1138 gal was recorded at a soft site in Papanoa. At hard sites the recorded PGAs were ≤ 420 gal (Figure 4). Figure 11 shows PGA contours of the earthquake. These contours were obtained from the recorded data using a Bayesian interpolation technique. We note that the maximum contour roughly coincides with the maximum slip (Figure 6a). The figure also shows municipalities where significant structural damage occurred and which received federal funds for recovery and reconstruction of the affected population.

Attenuation of strong motion with distance
Figure 12 shows plot of ground motion parameters - PGA and pseudo-acceleration response spectra (5 % damping), Sa, at f = 5, 1, and 0.5 Hz - as a function of R, the closest distance from the rupture area. With few exceptions (marked in the figure), the stations are situated at hardrock sites. The expected motions from ground-motion prediction equations (GMPEs) developed by Arroyo et al. (2010), shown by dashed curves (median and ± 2σ), match well with the observations, giving us confidence in the applicability of these relations.

Figure 12 PGA and pseudo-acceleration response spectra (5% damping), Sa, at f = 5, 1, and 0.5 Hz, as a function of R (closest distance to rupture area), observed during the Papanoa earthquake. PGA and Sa values correspond to the geometrical mean of the two horizontal components. Predictions from Arroyo et al. (2010) (denoted as Aea2010) shown by dashed curves (median and ± 2σ) match well with the observations. Note that only the intra-event part of sigma is considered.
Discussion and conclusions
The earthquake of 2014 ruptured a segment of the plate boundary between Papanoa and Zihuatanejo, leaving intact the NW Guerrero seismic gap, which extends from Acapulco to Papanoa (~100 °W- 101 °W). More than half of the aftershock area of the earthquake overlaps with that of the 1979 earthquake and a small fraction of it with that of the 21 September 1985 earthquake. The aftershock area of the 1985 earthquake is somewhat uncertain as it generated relatively few aftershocks and also because of the contamination from the aftershocks of the great Michoacán earthquake (Mw 8.0) which had occurred ~36 hours earlier (UNAM Seismology Group, 1986). Due to a dense deployment of portable seismographs in the epicentral zone, the 1979 aftershock area is well defined (e.g., Valdés-González et al., 1998). Unfortunately, the slip distribution during these previous earthquakes is not known. For this reason, a critical issue that cannot be resolved is whether one or both patches that slipped during the 2014 event also broke during 1979 and/or 1985, or whether the major slip during 2014 occurred over areas that had not slipped during the previous two earthquakes. In view of the aftershock areas of the three earthquakes, the width of the seismogenic zone in the region may be ~ 70 km, extending ~ 25 km inland.
The adjacent segment, the NW Guerrero gap, has not experienced a large/great earthquake since 1911. Episodic slow slip earthquakes (SSEs) reported in the region occur not only on the subhorizontal part of the plate interface but appear to extend updip up to about 10 km inland from the coast. Large slip during the first subevent of the Papanoa earthquake occurred on a patch of the plate interface which had slipped 6 - 10 cm, ~ 2 cm, and 6 - 10 cm during previous SSE episodes of 2001-2002, 2006, and 2009-2010, respectively (Radiguet et al., 2012) (Figure 7). The inverted slips on/near the patch during the SSEs are mostly controlled by the GPS station at Zihuatanejo (ZIHU) and are probably not well resolved. If, however, the slip on the patch during the SSEs is real, then it implies that slow and fast slip can occur over the same area of the interface during SSEs and earthquakes, respectively.
Mechanical models of earthquakes under rate- and state-dependent (R&S) laws show that rapid (unstable) and aseismic slip is primarily governed by velocity-weakening (VW) and velocity-strengthening (VS) fault constitutive regimes, respectively (e.g., Lapusta et al., 2000; Liu and Rice, 2007; Kaneko et al., 2010). Since the aseismic slip apparently spread over the first asperity of the Papanoa earthquake during earlier SSE episodes, it suggests that this segment is mainly characterized by VS properties. However, while unstable rupture propagation (with rapid slip) may occur over VS segments due to dynamically driven weakening processes (Noda and Lapusta, 2013), it cannot spontaneously initiate in those segments. To reconcile the observations with a physical model, we propose that the area which ruptured during the first subevent was a VW patch (an asperity) surrounded by a conditionally stable and larger VS zone where slow slip during the SSEs occurs. This R&S mechanism has successfully explained the mechanism of repeating earthquakes (Chen and Lapusta, 2009), where slow slip in VW patches arises as a consequence of aseismic movement in the surrounding VS fault.
We note that the aftershock areas (presumably also the slip areas) of 1979 and 2014 earthquakes begin about ~ 35 km downdip from the trench (Figure 6a). Seismically, the interface from the trench up to a distance of ~35 km downdip appears similar to that of the adjacent NW Guerrero gap (Figure 1b). In both regions there is little seismicity at M > 5 level in this portion of the interface, except for a sequence of near-trench earthquakes which were recorded on 18 April 2002. The mainshock (Mw 6.7), which was located near the trench of the NW Guerrero gap, produced many aftershocks. The principal aftershock (Mw 5.9) was also located near the trench but updip of the 1979 and 2014 aftershock areas. The two events are denoted NTE in Figure 1b. These moderate earthquakes were deficient in high-frequency radiation of seismic energy (Iglesias et al., 2003). The mainshock had extraordinarily large centroid delay time for its magnitude, about 30 s (Figure 4 of Duputel et al., 2013). It also generated a small tsunami.
These characteristics point to a tsunami earthquake. [The only other region along the Mexican subduction zone where similar near- trench earthquakes have been documented is off the coast of Pinotepa Nacional (Iglesias et al., 2003).] Thus, the shallow interface near the trench updip of the aftershock areas of 1979 and 2014 earthquakes as well as the NW Guerrero seismic gap seems to be in the domain of tsunami earthquakes or of stable sliding. The interface further downdip upto ~ 35 km from the trench may be aseismically stable, or conditionally stable so that it slips seismically when accelerated and dynamically weakened by rupture of adjacent seismic patches (Noda and Lapusta, 2013).The interface from 35 to 80 km of the trench in Papanoa - Zihuatanejo region clearly differs from the region of NW Guerrero. In the former region, although aseismic (slow) slip seems to reach the coast (~65 km from the trench), this seismically active portion of the interface clearly has highly locked VW asperities, so that the inter-SSE coupling ratio is relatively high (>0.5). In the latter region (i.e., within the seismic gap), the strain is mostly released during SSEs, the inter-SSE coupling ratio is very small (< 0.2), and slip deficit is one-fourth of that in the former region (Radiguet et al., 2012). However, as suggested by the two largest aftershocks (Mw 6.5 and Mw 6.1) that occurred in the NW segment of the gap about 20 km away from the mainshock (Figure 6a), this portion of the interface may be conditionally stable with isolated unstable asperities, such as the ones depicted by the green and blue epicenters. Actually, the absence of aftershocks between this area and the main rupture zone may probably reflect aseismic afterslip accommodation on the plate interface that eventually triggered the Mw 6.5 and Mw 6.1 sequence.
The earthquake caused significant damage to Papanoa and other coastal towns. The peak iso-acceleration contour coincides with area of large-slip. The earthquake was strongly felt in Mexico City but caused only minor damage. The recorded ground motions in the city were similar to those produced by the 1979 and 1985 earthquakes. It is reassuring to note that the ground motion prediction equations developed for Mexico explain the observed ground motion parameters quite well.

