


 nueva página del texto (beta)
 Inglés (pdf)
 Artículo en XML
 Referencias del artículo
 Enviar artículo por email
 Citado por SciELO
  Similares en
SciELO
Similares en
SciELO 
 Permalink
| Symbols Table | |
|---|---|
| B surface energy balance | K = K ω ∂m/∂z vertical flux of water vapor |
| R net radiation | Lv is the specific sensible heat of evaporation |
| H turbulent sensible heat flux | K ω is the eddy diffusivity of water vapor |
| L v E turbulent latent heat flux | m mass per unit volume of water vapor |
| Lf P′ heat flux from precipitation | Lf represents the specific latent heat of melting |
| S↓ incoming shortwave radiative heat flux | ϕ precipitation rate |
| S↑ outcoming shortwave radiative heat flux | M ω molecular weight of water |
| L↓ incoming longwave radiative heat flux | ℯ pressure of water vapor in the atmosphere |
| L↑ outcoming longwave radiative heat flux |
|
| α surface albedo | T air temperature |
|
|
Ts saturation temperature |
|
|
P air pressure |
| θ' v turbulent fluctuation of the virtual potential temperature | Ma air molecular weight |
| ⍴α air density | ⍴ the air density |
| Cpd heat capacity of dry air | τ shear stress of dry air on the surface |
| Kh Eddy Heat Diffusivity coefficient | u wind speed at height |
| ⍴ represents the air density | z 0 surface roughness |
| Cp the specific heat capacity at constant pressure | k 0 Von Karman constant |
Introduction
The retreat of Mexican glaciers is so strong that they could be gone before mid-century (Delgado-Granados, 2007). The glaciers at the summit of Popocatépetl have largely melted prior to late year 2000, forced by climatological conditions and accelerated by eruptions (Delgado-Granados et al., 2007). The glaciers that still exist on top of Iztaccíhuatl and Citlaltépetl volcanoes are shrinking quickly in spite of dormant volcanic conditions.
These Mexican glaciers at 19°N, are special because they are some of the last tropical climate indicators in this high elevation zone that still exist around the world. So it is very important to know the main factors influencing their retreat and projected eventual demise. In this sense, the effect of radiative fluxes on the energy balance and resulting glacier retreat had not been studied, so, the only parameters published in the literature related to this glacial retreat were temperature and precipitation. Considering that its position in reference to astronomical tropics, Mexican Glaciers receive solar radiation of the same way that tropical glaciers do, but doesn't have the same variability in precipitation and temperature. These parameters and their relationship to energy balance across the glacial surface play an important role in the variability of accumulation and ablation on the glacier. This means that the retreat of glaciers at 19°N latitude is determined not only by the annual variability of temperature and precipitation, but also strongly determined by the energy balance and radiative fluxes involved.
Glaciar Norte, on the northern flank of Citlaltépetl volcano, is the largest ice body of Mexico, although its extension has been reduced noticeably. The current volcanic activity of Citlaltépetl is not relevant as compared to Popocatépetl, but slight fumarolic activity is ongoing close to the summit. On the other hand, Citlaltépetl volcano is located distant from any large city or industrial center (it lies 200 km east of Mexico City, 100 km west of Veracruz; Figure 1) and thus, has the lowest anthropogenic influence of all Mexican glaciers. Thus, changes in Glaciar Norte most likely reflect changes in the climatic conditions (Delgado-Granados et al., 2007) and not recent volcanism or local air pollution sources.
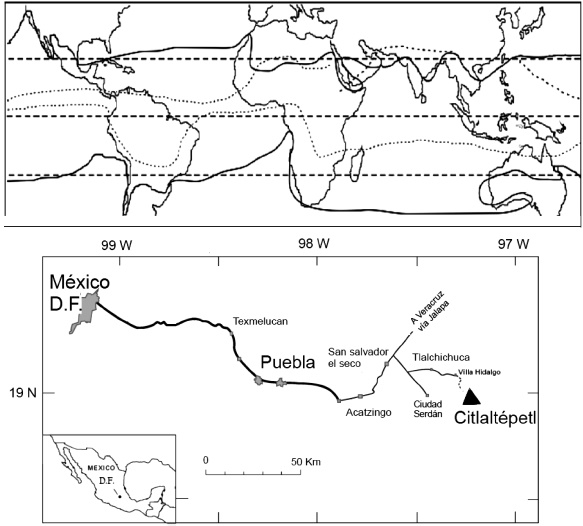
Figure 1 Geographic position of the Intertropical Convergence Zone (ITCZ). Modified from Kaser and Osmaston [2002]. In the figure below it is shown the volcano position respect to Mexico City.
There might be several meteorological variables influencing the retreat of Glaciar Norte at Citlaltépetl volcano. They can be revealed by: a) instrumentation devoted to continuous data collection in the field; b) a systematic meteorological record for the glaciated area over an extended period of time; and c) calculation of the energy balance over the surface of the glacier according to a theoretical model applied to the meteorological conditions of Glaciar Norte.
This study focuses on Citlaltépetl Volcano because it has no significant current volcanic activity and the least anthropogenic influence in the region. It is believed that the changes shown by Glaciar Norte are mainly due to climatic factors (Delgado-Granados, 2007). Then, using data acquired during 2006 to 2009 from two automatic weather stations which were installed at >5,000 masl, we demonstrate, for the first time, that net radiation is playing an important role in the demise of Mexican glaciers, because it is moderating the surface energy balance.
After this analysis it was possible to compare the behavior of surface energy exchanges on the surface of this glacier located at 19°N latitude to those of tropical glaciers, that is, those glaciers whose annual temperature variability equals the daily temperature variability, receive rainfall throughout the year and are within the astronomical tropics (spanning between 23° 26' N and 23° 26' S latitudes as defined by the apparent north-south journey of the sun).
This is important because Mexican glaciers do not have all the characteristics expected for tropical glaciers lying beneath the annual range of the Inter-tropical Convergence Zone (ITCZ). The discussion about similarities and differences between tropical snow and ice systems begins a new research topic on glaciers located at this latitude.
Meteorological Data
Two controlling seasons were recognized at Popocatépetl volcano: the wet season, with dominance of accumulation, and the dry season, with dominance of ablation (Delgado-Granados et al., 2007). Summer is the rainy season (starting in May-June), characterized by precipitation of snow and hail. Snow can last until January-February before the ablation produces penitents (see for example Betterton, 2001), however, these conditions present at Popocatépetl are similar at Citlaltépetl region as shown by our data.
On September 17, 2006, two Automatic Weather Stations (AWS) began operating. One was located on the surface of Glaciar Norte (Glaciar station) at 5131 masl, and another on the lateral moraine close to the glacier at 5115 masl (Morrena station). Glaciar station was the main provider of meteorological data used in the energy balance model.
The AWS consists of temperature sensors (accuracy, ±0.5°C), a relative humidity probe (accuracy, ±5%), sensors for wind speed (accuracy, ±0.5) and direction (R.M. Young 03001-5 Wind Sentry Set), a digital barometer (accuracy, ±0.2hPa), and a NR Lite Net Radiometer (error, 3%). Daily averages of each parameter automatically calculated by the station's internal program from September 17, 2006 to October 15, 2009 are presented.
This AWS instrumentation doesn't allow obtaining the energy balance components' absolute values. However, for this study, the net radiation is compared with other data in order to recognize the main processes governing the ablation on the glacier surface.
The total radiative component was measured in the field by two sensors at Glaciar station, placed horizontally above the glacial surface. The sensor facing upwards measured the incoming direct and diffuse solar radiation, whereas the other one was facing downwards aimed towards the glacier surface. The downward aimed radiometer measured the reflected, emitted and diffused outgoing radiation. All the components were summarized in a single exiting signal: the net radiation on the glacial surface.
During times when observed wind speed was seemingly zero, these periods corresponded to low temperatures and a characteristic low valued wind direction, and thus one can interpret the data during these periods. Occasionally, some sensors were frozen, especially the moving parts of the vane and anemometer. During these periods, missing data were replaced by averages from nearby months.
No relevant gaps are present in the data, as the automatic weather station worked correctly since the startup date. However, some data gaps were replaced using daily averages and thus formed a three-year energy balance record to describe the behavior and variations of the energy balance during that period.
The energy balance model
A theoretical model has been developed for this study based on previous work (Paterson, 1994; Oerlemans, 2001; Francou and Puoyaud, 2004). This model considers the glacier as an adiabatic thermodynamic system, marking an exception in the glacier-atmosphere interface where diabatic processes do occur. The equations for heat flow and water phase change (ice to liquid to vapor for instance) must take into consideration the atmosphere as a fluid or a system composed of gases.
The measured meteorological variables (temperature, solar radiation, humidity, precipitation, wind and atmospheric pressure) at the glacier fed the theoretical model. The model allowed estimating the energy exchange at the glacier-atmosphere interface at Glaciar Norte using the data obtained from the instrumentation already mentioned. The energy balance was estimated with an independent calculation of each component (latent heat, sensible heat and net radiation). The energy balance for the surface of Glaciar Norte could be approximated as:
where R is the net radiation, H and L vE are the turbulent sensible heat flux and the turbulent latent flux respectively, L fØ is the heat flux from precipitation, and B is the total energy flux over the surface. The energy supplied by rain is assumed negligible because the glacial surface remains at melting point, but it could be significant when rain freezes on the surface (Paterson, 1994). We follow the convention to consider all fluxes towards the glacial surface as positive, while all fluxes away from the glacial surface are negative. When the surface temperature is ~0°C and the energy balance (B) is positive, melting processes are considered as natural processes on the glacial surface.
Net Radiation
The total radiative flux is the sum of the net short-wave radiation and net long-wave radiation coming from Earth and sun's emissions. Since net short-wave and long-wave radiation can be separated into incoming and outgoing radiation, the net radiation energy can be expressed by:
where S ↓ is the incoming short-wave radiation or incoming solar radiation, while S ↑ is the outgoing short-wave radiation (reflected by the Earth's surface), L ↓ is the incoming long-wave radiation emitted by the sun and the atmosphere toward the Earth's surface, L ↑ is the outgoing long-wave radiation emitted by the surface, and α is the surface albedo of the glacier. The net radiation measured at some point on the surface represents by itself an energy balance of the surface in which this is measured (Francou and Pouyaud, 2004).
The turbulent heat fluxes
The water vapor transfer in a glacier is associated with the release and absorption of latent heat that dominates the water evaporation and condensation over the glacier.
On the other hand, the transport of sensible heat between the atmosphere and the glacier's surface is mainly through mechanic or thermal turbulence. The component of the vertical sensible heat flux can be expressed as /
The heat transferred by convection can be treated as conduction, so H can be expressed in terms of the temperature lapse rate and as "Eddy Heat Diffusivity" (Kh ) coefficient:
here, ρ represents the air density and c p the specific heat capacity at constant pressure. Therefore, the convective energy by the heat flux of the water vapor and the flux transferred by the precipitation are summed up to calculate the convective energy H, hence obtaining the total energy fluxes (Paterson, 1994). The vertical flux of water vapor is given by E = -K ω ∂m/∂z. So, the heat flux associated to water vapor flux is:
where L v is the specific sensible heat of evaporation, K ω is the eddy diffusivity of water vapor, and m the mass per unit volume of water vapor. Finally, L fØ is the precipitation, i.e. the vertical flux of water, while L f represents the specific latent heat of melting and Ø as the precipitation rate. As stated above, the energy supplied by rain is negligible when the surface and the air temperatures are near the melting point.
Meteorological parameterization
The equation of state for moist air as an ideal gas is:
where M ω is the molecular weight of water, e is the pressure of water vapor in the atmosphere; while for dry air, it is given by:
with P representing the air pressure, M α
the air molecular weight and ρ the air density. Such that, m = ρeM ω /PMω = (0.622) ρe/P where
The heat transfer by convection depends on air turbulence and it is measured through the eddy viscosity Km' which means that, τ= K mρ∂ul∂z, where τ is the shear stress of dry air on the surface and u is the wind speed at height z, this equation represents the vertical flux of horizontal momentum. There is evidence, that at some height, the coefficients K m' Kh and K ω are approximately equal to those of a neutral atmosphere (Paterson, 1994). Although this is possible only if the wind speed, temperature and water pressure are distributed logarithmically with height. This rule described by Paterson (1994) is also applied if the meteorological observations are within ~2m of the surface, and the surface is at melting point. Since these energy balance measurements were taken within the first 2m above the glacier surface, then this rule should apply over the melting surfaces studied here. Thus, it is assumed that: K m could replace K h and K ω. Finally, considering that τ does not change with height,
while u* represents the frictional velocity. This frictional velocity is related to the surface roughness (z 0), determined by two wind speed measurements at two different heights. Thus, u * and z 0 for neutral atmospheres can be expressed as:
in which k 0 is the Von Karman constant, in this case (0.4); u 1 is the wind speed at Morrena station, and u 2 is the wind speed at Glaciar station; z 1 = 1.5 m and z 2 = 16.5 m. Using the wind speed measured at both automatic weather stations to calculate z 0' then the frictional velocity ranges between 0 and 0.65 m/s, the latter value corresponds to the extreme case of Max wind speeds recorded in both weather stations. This value is higher than usual values for glacial surfaces of which the melting point is usually k 0 ≈ 0.1 to 0.5 (Kuhn, 1979) due to the high exposure to wind that represents the topography of the glacier. Equation (9) leads to ∂ul∂z = u */k0z. Inserting this result into equation (8) we obtain the expression, K m = u*/k0z, which can be written K m = Kh = Kw = u*/k0z. Then by substituting this with the expression ρ = ρ0(P/P0)obtained from the state equation of ideal gases at height z and z 0' the resulting equation is:
and after integrating is obtained:
and by substituting of (9) the final expression is:
The equation (12) is obtained through a similar process
if the transfer coefficient is defined as:
The value of C* wills depend on measurement height and surface roughness, however previous studies have shown that the parameter depends mainly on the vertical distribution of wind speed (Paterson, 1994). Applying the acquired data sets for the wind speed at the glacial surface, it is possible to calculate the z 0 and C respectively, and this yielded an average value for C* equal to 0.0017. For this study, the numerical constant values given in Paterson (1994) are used: ρ 0 = 1.29 kgm-3 is the corresponding normal value for air density at 0°C, measured at a sea level pressure of P 0 = 1.013 x 10⁵ Pa. These density and pressure values are used because they are a good reference for the ideal gases state equation. The heat capacity of air is c p = 1010Jkg-1K-1 at these pressure conditions, and the latent heat of water vaporization of water is L v = 2260 x 103 J/kg. After substitution, the resulting equation yields:
At this point, it is possible to reformulate the general equation (1):
The saturation vapor pressure e was calculated using the Goff and Gratch formula
where
e is the saturation water vapor pressure (hPa)
T is the absolute air temperature in kelvins
TS is the steam-point (boiling point at 1 atm.) temperature (373.15 K)
eS = 611 Pa is the e S at the steam-point pressure (1 atm = 1013.2 5 hPa)
Results
Net contributions calculated with the collected data for each component of the energy balance model for the period of September 2006 to September 2009 were respectively: -40525.122 W/m2 for latent heat, -12842.599 W/m2 for sensible heat and 37961.148 W/m2 for net radiation. At the end of the measurement period, the daily average energy balance was calculated as -14.94 W/m2. Integrating for energy loss for the three-year period, yields a total energy of ≅10.73 × 10⁸ J/m2. If water for freezing is available, the computed energy loss would be enough to freeze ≅4163.5 Kg/m2 of water on the glacier surfaces. By assuming these energy loss processes are occurring at an average air temperature of 2.57 °C (this study) and by considering the average density of glacial ice at Popocatépetl vocano is 900 kg/m3 (Delgado-Granados, 2007), the total energy loos computed would be sufficient to freeze an equivalent ≅4.6 m3 cubic meters or superimposed ice on a typical Mexican glacier between 2006-2009.
There only 4 days of data gaps for temperature, net radiation, relative humidity and pressure from both automatic weather stations. Precipitation data of the automatic weather stations are not considered here for the calculation of the energy balance.
There are only 27 days with temperatures above 0°C within the first year with a maximum value of 1.6 °C, which was present on October. For the rest of the period, temperatures lay near the melting point, however a few excursions down to the -10°C were detected.
Tables 1-4 show the mean value of energy balance components and air temperature, together with the correlation matrix of all of these parameters on Glaciar Norte glacier.
Table 1 Correlation coefficients for energy balance components and temperature at Glaciar Norte, from September 19 2006 to October 15 2009 (n=1117).
| table 1 | EB | NR | H | LvE | T |
|---|---|---|---|---|---|
| Averag | -14.94 | 33.46 | -11.54 | -36.85 | -2.57 |
| std dev. | 66.42 | 64.06 | 13.61 | 41.39 | 1.64 |
| EB | 1 | 0.67 | 0.40 | 0.41 | 0.16 |
| NR | 1 | -0.26 | -0.36 | -1.14 | |
| H | 1 | 0.743 | 0.61 | ||
| LvE | 1 | 0.29 | |||
| T | 1 |
Average and standard deviations for energy fluxes in W/m2 and temperature in °C. Significant correlations (p<0.05) are marked in bold.
Table 2 Correlation coefficients for energy balance components and temperature at Glaciar Norte, from December 2006 to May 2007 (Dry season n=150).
| table 2 | EB | NR | H | LvE | T |
|---|---|---|---|---|---|
| average | 17.32 | 68.93 | -11.91 | -39.68 | -3.15 |
| std dev. | 92.40 | 15.26 | 15.26 | 49.38 | 1.68 |
| EB | 1 | 0.74 | 0.59 | 0.54 | 0.23 |
| NR | 1 | 0.04 | -0.13 | 0.17 | |
| H | 1 | 0.74 | 0.36 | ||
| LvE | 1 | 0.07 | |||
| T | 1 |
Average and standard deviations for energy fluxes in W/m2 and temperature in °C. Significant correlations (p<0.05) are marked in bold.
Table 3 Correlation coefficients for energy balance components and temperature at Glaciar Norte, from December 2007 to May 2008 (Dry season n=152).
| table 3 | EB | NR | H | LvE | T |
|---|---|---|---|---|---|
| average | -1.02 | 64.85 | -18.64 | -47.23 | -3.74 |
| std dev. | 64.03 | 67.51 | 16.11 | 41.51 | 1.63 |
| EB | 1 | 0.66 | 0.34 | 0.32 | 0.27 |
| NR | 1 | -0.32 | -0.47 | 0.03 | |
| H | 1 | 0.67 | 0.58 | ||
| LvE | 1 | 0.13 | |||
| T | 1 |
Average and standard deviations for energy fluxes in W/m2 and temperature in °C. Significant correlations (p<0.05) are marked in bold.
Table 4 Correlation coefficients for energy balance components and temperature at Glaciar Norte, from December 2008 to May 2009 (Dry season n=150).
| table 2 | EB | NR | H | LvE | T |
|---|---|---|---|---|---|
| average | -18.82 | 61.28 | -19.01 | -61.08 | -3.30 |
| std dev. | 75.23 | 52.41 | 52.41 | 49.44 | 1.54 |
| EB | 1 | 0.56 | 0.56 | 0.68 | 0.57 |
| NR | 1 | 1 | -0.20 | 0.23 | |
| H | 0.78 | 0.74 | |||
| LvE | 1 | 0.37 | |||
| T | 1 |
Average and standard deviations for energy fluxes in W/m2 and temperature i n °C. Significant correlations (p<0.05) are marked in bold.
Figures 2 and 5 show the variability of air temperature and energy balance components. The results demonstrate the low variability of air temperatures above the glacier throughout the year (ranging only between 0 and -10°C). Periods with relatively high temperatures (but below zero) and low subfreezing temperatures are related with hot summer and cold winter seasons respectively. Net radiation values are higher than latent and sensible heat, and the variability of net radiation clearly dominates the energy balance. Even more, Figure 3 shows that the variability of net radiation and energy balance are highly positive correlated, Table 1 shows the same relationship.
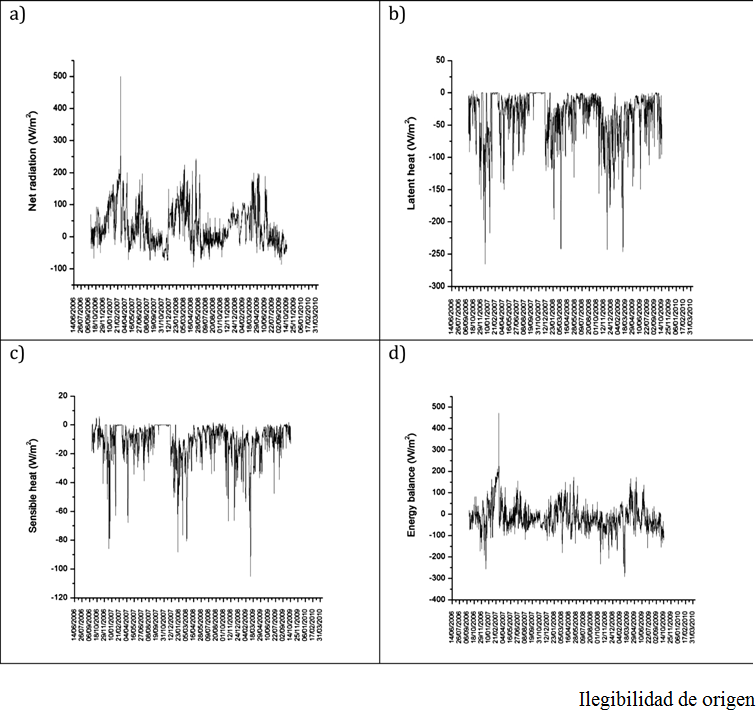
Figure 2 Variability of the Energy balance and its components are shown. Note how the energy balance and net radiation variations are much more similar than between Latent heat and Energy balance or between Energy balance and Sensible heat. Also it is possible to see that Latent and Sensible heat variations are similar and both have predominantly negative values, as a consequence of this, the Energy balance oscillates between positive and negative values.
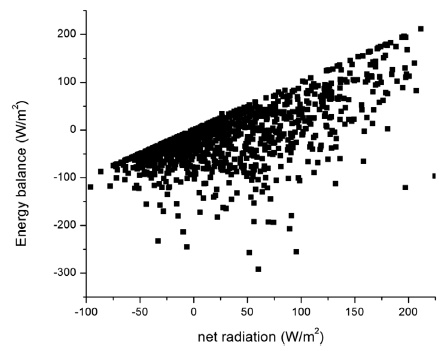
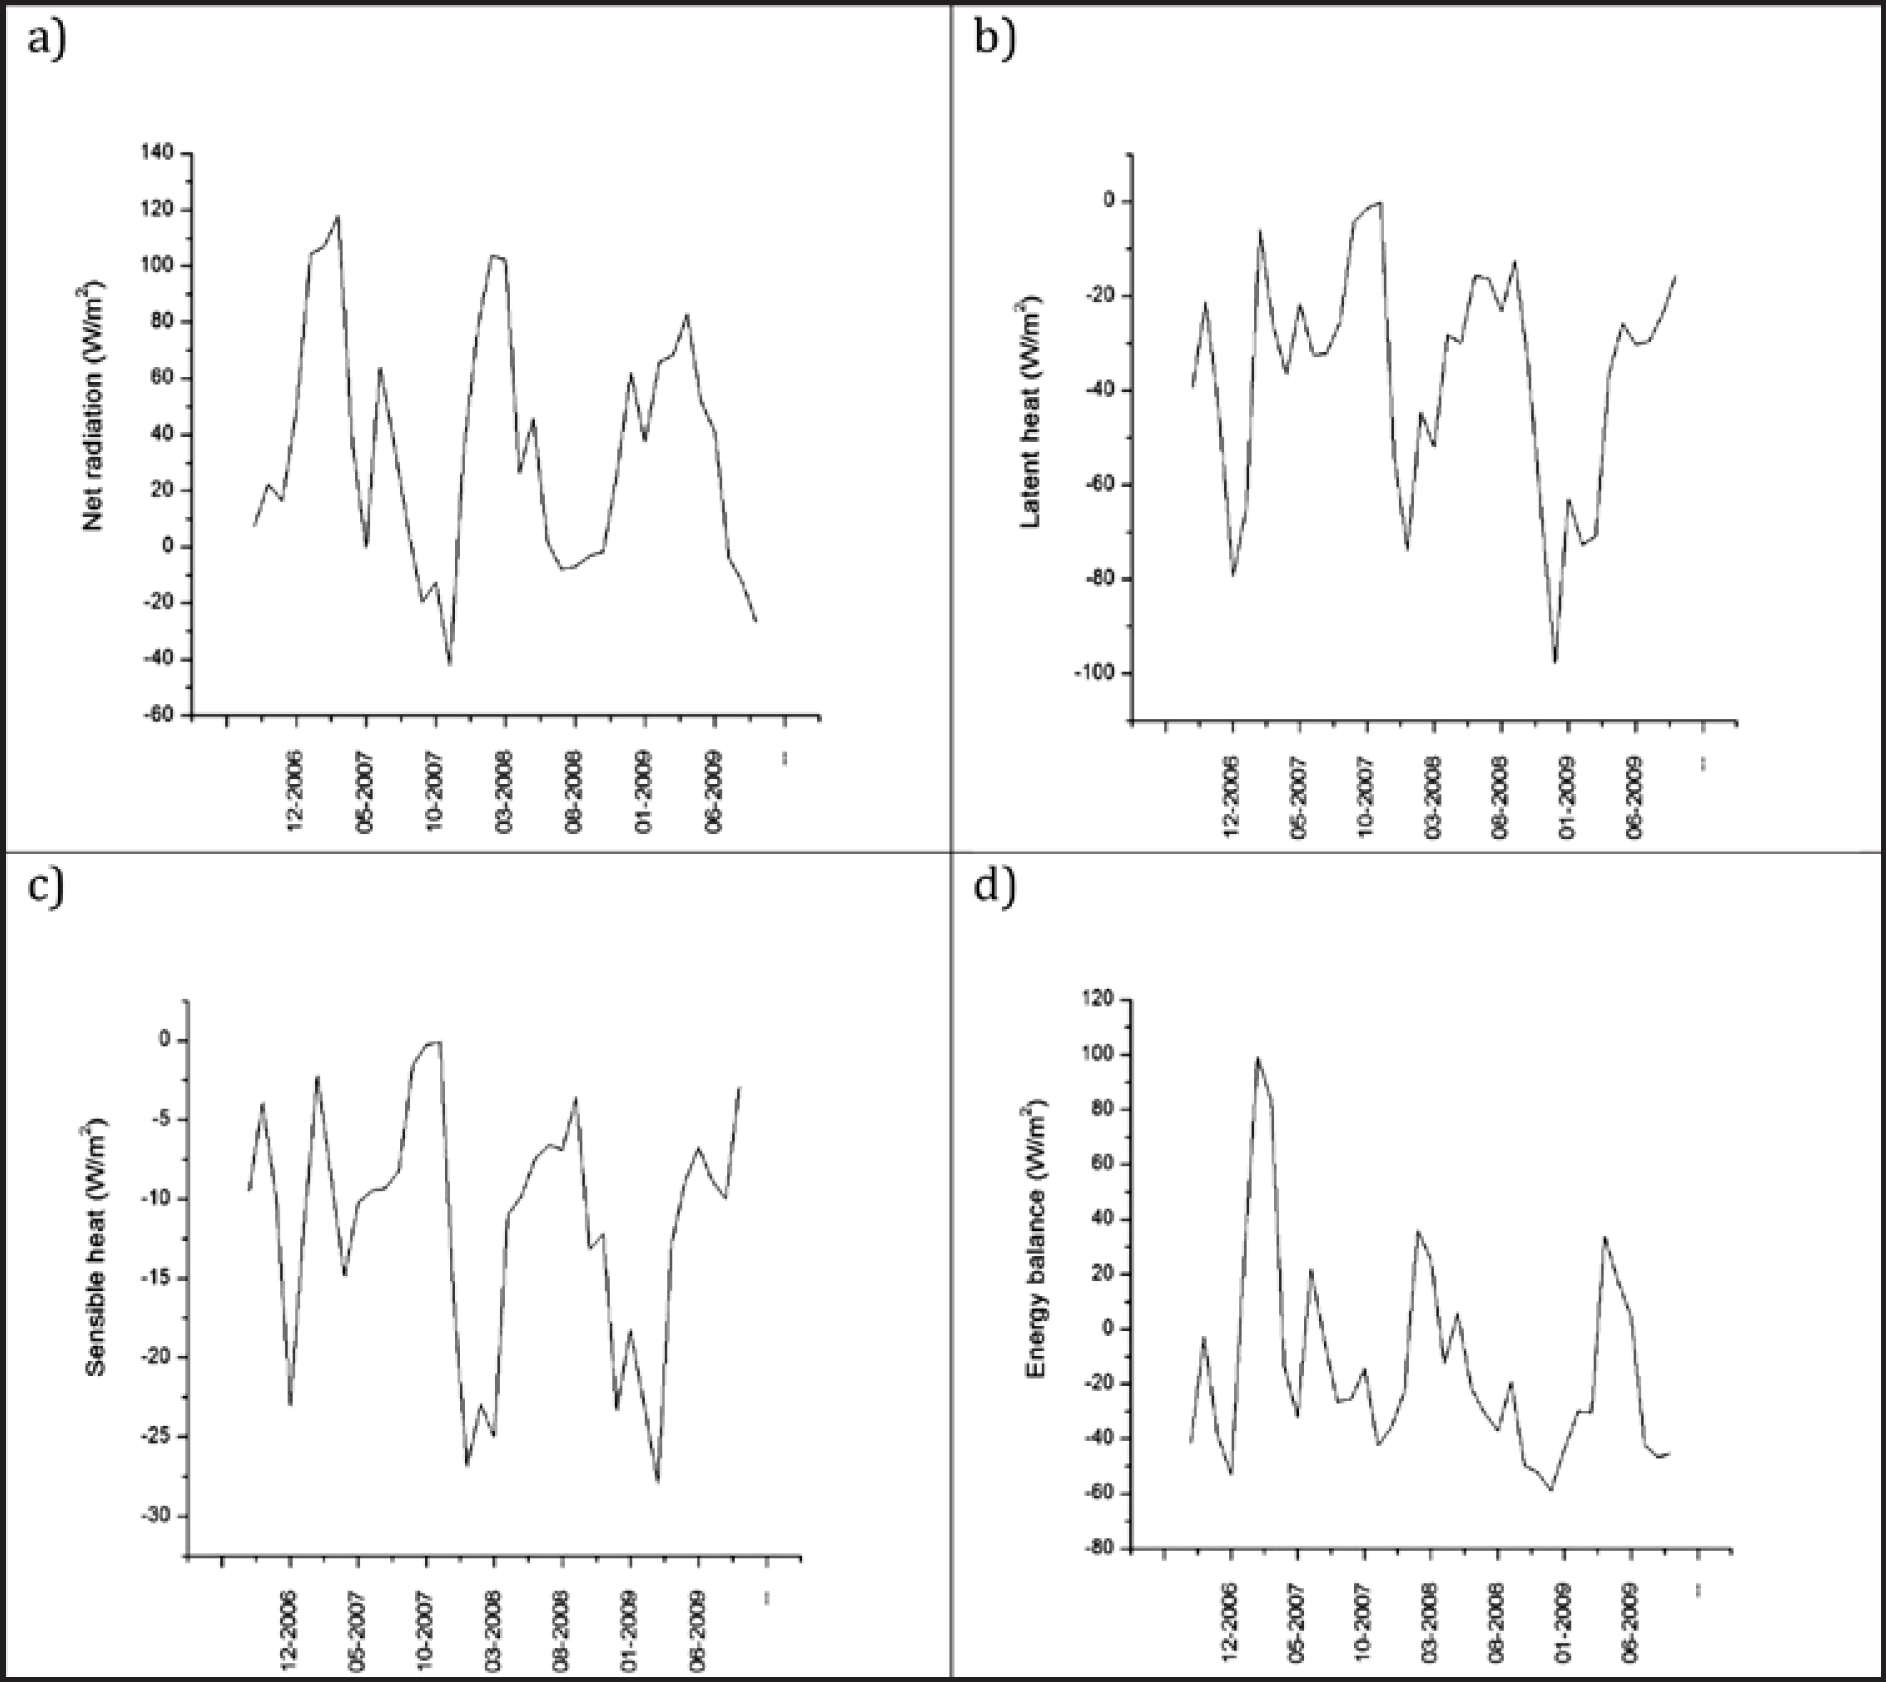
Figure 4 Annual variation for each component of energy balance (sept 06-oct 09). During all of these three years there is an ablation period where the values of the energy balance are high. Between January and march the net radiation is more intense than during the rest of the year. However, the components corresponding to the sensible and latent heat fluxes seems to have almost an opposite variation pattern.
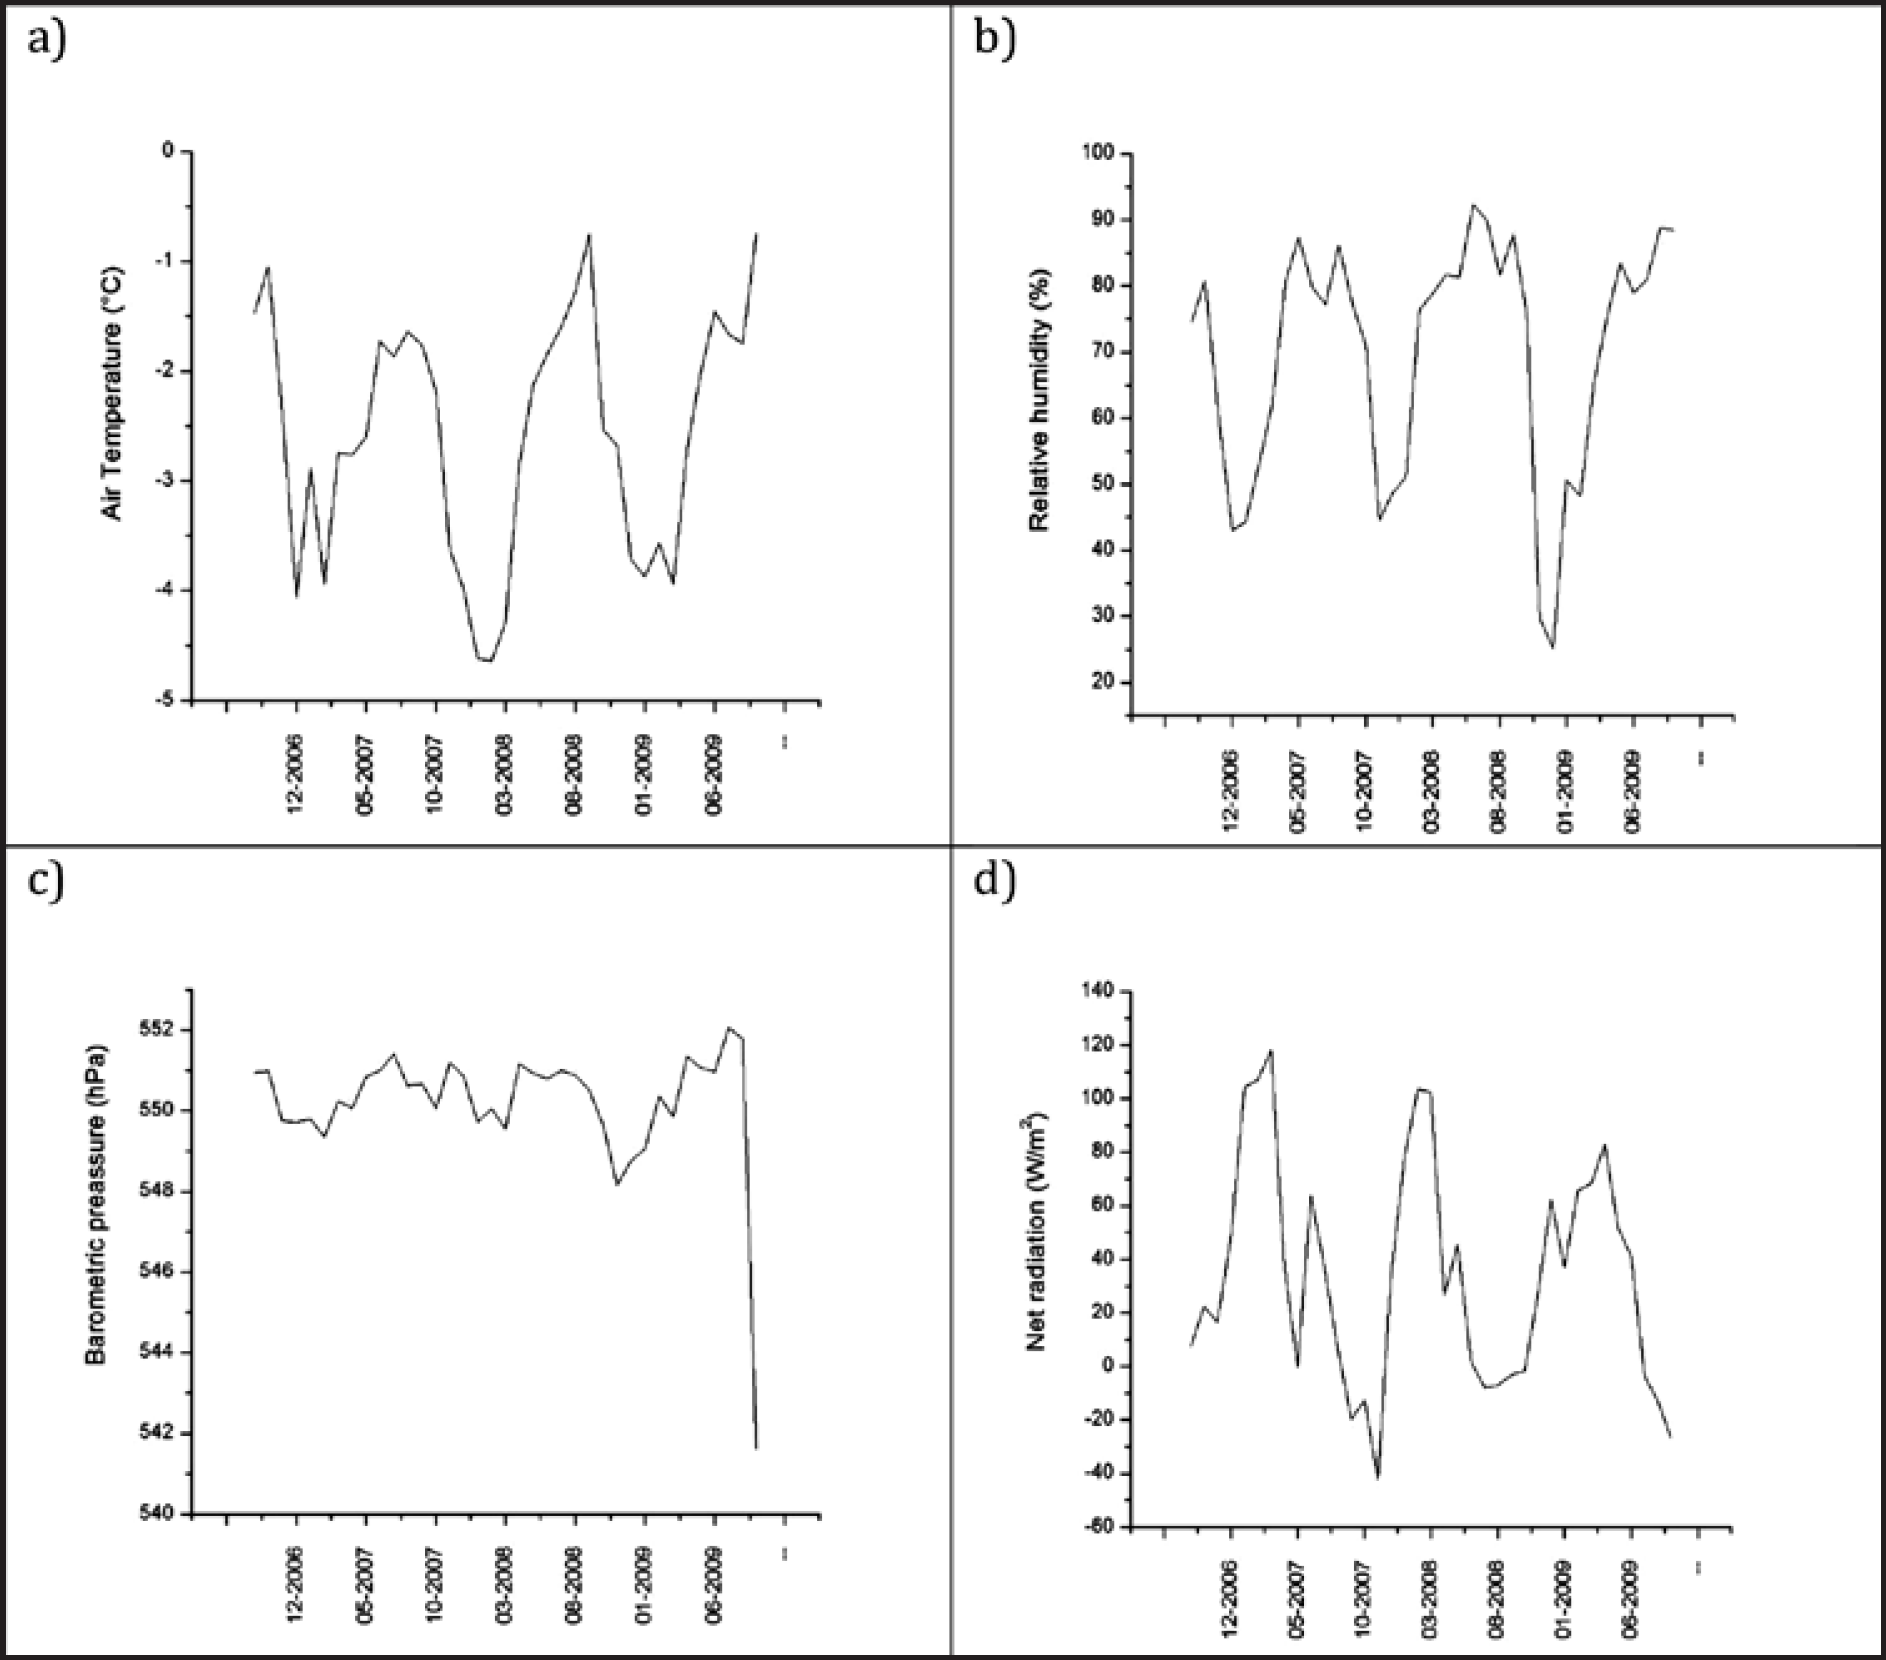
Figure 5 Seasonality of air temperature, relative humidity, barometric pressure and net radiation. Barometric pressure is nearly with stable values, nevertheless, It can be determined an alternation of a wet and a dry season along the year. Temperature and relative humidity have a similar behavior with an oscillation of annual regularity. When temperature is lower also air is dryer, therefore, during dry season is it difficult to reach freezing point.
Results here involve three dry seasons and almost four wet seasons, comprising the 2006-2009-study period.
During this study period of 2006-2009, the net radiation shows the highest variability of all energy fluxes representing the main energy source to melt (σR ≈ σ SEB ) which can be seen in Tables 1-4. The latent heat flux (LE) is the principal sink of energy on the glacier surface due to the strong variability of sublimation, which is larger than for sensible heat flux (H). Sensible heat flux is also negative along all data which means a cooling of the surface and sometimes this could means that sublimation is inhibited and melting is enhanced.
Finally, it was calculated the annual cycle of the energy balance and the energy fluxes for these three years of measurements (Figure 4). The variability of the net radiation shows high values between January and March, which is the same for energy balance. For these months, latent and sensible heat fluxes show low negative values compared with the net radiation fluxes. This means the net radiation (R) controls the surface energy balance (B) as shown by the strong correlation between these variables, r 2(R|B) = 0.67 (Table 1, Figure 3). Turbulent fluxes were poorly correlated to net radiation (Tables 1-4).
The behavior of air temperatures measured just over the glacier and measured in a zone nearby (but not over the glacier) is strongly correlated (Tables 1-4). The variability of temperatures observed are very similar, even though the temperatures just off the glacier margins are slightly higher than temperatures above the glacier surface. In contrast, air temperature variations outside the glacier margin have lower standard deviations than air temperatures just above the glacier. Compared with glaciers at mid and high latitudes, the temperature standard deviations at Glaciar Norte glacier were lower (see Sicart et al., 2008). For comparison, the work of Sicart et al. (2008) indicates, temperature on Zongo glacier (4900 to 6000 masl at 16°S latitude in Bolivia) is very poorly correlated with R and Surface Energy Balance. A similar situation occurs at Glaciar Norte where temperatures were not significantly correlated to R. For this glacier studied, air temperature was positively correlated with sensible heat flux, which implies a heat flux component similar to that of mid-latitude glaciers (Sicart et al. 2008; Zemp et al., 2007; Dyurgerov, 2002; Braithwaite, 1981). This relationship could mean that sensible flux is relevant when temperature rises enough to melt the glacier surface.
Discussion
The energy balance presented in this paper is first time the energy balance variability of glaciers at 19°N latitude has been approximated with a comprehensive theoretical basis. Here, the strong relationship between net radiation and energy balance dominates the energy exchanges on the glacier surfaces. From this, it should be possible to identify similarities and differences that link the behavior of these glaciers with others in tropics. Within this section, variability of the energy balance components is compared to temperature variations using the same parameters documented for other tropical glaciers. This comparison is based on the effect of each meteorological and energy flux to the energy and mass balance variabilities. For the case of Mexico, we only focus on the energy balance variability. In this way, patterns are established which can explain the relationship between the energy budget and how glacial retreat happens in the tropics. All of these relationships are summarized on Table 5 in order to simplify the comparison of Glaciar Norte with tropical glaciers.
Table 5 Comparison of Glaciar Norte response to energy fluxes and temperature versus tropical and mid-latitude glaciers.
| Cordillera Blanca [Vuille et al., 2008] | Zongo [Francou et al., 2003] | Saint-Sorlin [Sicart et al., 2008] | Glaciar Norte | |
|---|---|---|---|---|
| Temperature variability | (6 °C | (6 °C | ( (6 °C | (5 °C |
| Precipitation rate | 770 mm/year | 668 mm/year | ( 1100 mm/year | 454 mm/year |
| Main factor to variability of Mass balance | Precipitation | Sea temperature anomalies | Air temperature | Net radiation |
| First energy source | Net short-wave radiation | Net short-wave radiation | Incoming long- wave radiation | Net radiation |
| Second energy source radiation | Latent heat | Latent heat | Incoming short-waves | Latent heat |
| Effect of air temperature | Low | Low | High | --- |
| Effect of sensible heat | None | None | High | --- |
| Effect of latent heat | High | High | None | Low |
| Effect of net radiation | High | High | None | High |
Energy balance components
When a component of the energy balance is positive, the physical processes associated with it favor ablation. But when energy balance is negative, the associated physical processes favor accumulation if the proper temperature and precipitation conditions for accumulation are present.
In Figure 2, the components of the energy balance are plotted as independent values. The values of sensible heat are smaller than those for latent heat, although both have very similar behavior.
Latent heat is predominantly negative for the study site. This explains the presence of accumulation on the glacier. Contrary to net radiation, which is mainly considered positive, Latent heat seems to cause more ablation on the glacier. In addition, there is a greater correspondence between the energy balance and the radiative component than between the energy balance and any other component measured on this glacier. The correspondence found between the energy balance and net radiation shows a positive correlation of about 0.67 (Figure 3). From this value it can be said that the radiative components involved in net radiation mainly determine the regularity and variability of the energy balance. After discovering that fact, it is possible to conclude that the principal factor governing energy balance variability is net radiation, however, the fluxes of sensible and latent heat are very important in terms of the magnitude of the energy balance. It is possible to compare energy balance of Mexican glaciers and more tropical glaciers because the net radiative and the latent heat fluxes dominate the energy balance of these glaciers and not the sensible heat flux (Francou et al., 2003; Favier et al.,2004).
So, the energy available for melting and sublimation (given by the energy balance) is determined by sensible and latent heat fluxes, while the energy variability is driven by net radiation. Figure 5 shows the annual variation behavior of temperature, relative humidity and net radiation. This behavior is essential to the formation of wet and dry seasons and its alternation along the year.
Although net radiation is the principal factor driving energy balance variations, it is important to note that the sequence of maximum and minimum balance although followed by net radiation, is opposite to that followed by sensible and latent heat. Thus, the role of latent and sensible heat fluxes appear to counter balance the effects of net radiation.
Regime and seasonality
The annual cycle of the four energy balance components was analyzed during the three years of this study (Figure 4). During all three study years, there is observed an ablation period where the values of the energy balance are high (Figure 4, d). Nonetheless, there are some periods when the energy balance values are low, which could mean accumulation periods. However, as ablation is present during almost year, the annual variation of energy balance and the energy available for melting are driven by net radiation variability, similar to what happens at tropical glaciers (Sicart et al., 2008). However, from September to November the glacier experiences a strong accumulation period, and also registered the maximum annual accumulation. This phenomenon is similar to that of glaciers in the outer tropics (such as near 23o N) where the ablation is low at the end of the balance year (Francou et al.,2003).
Temperature and relative humidity have a similar behavior throughout the year. It is possible to observe an oscillation of annual regularity, where air temperature begins to descend at the end of October to early November causing the air to contain less steam water (Figure 5a and 5b). In addition, a decrease in relative humidity begins during the same period. As a result, two seasons are defined during the year: a humid and a dry season (Figure 5, un-shaded and shaded zones respectively).
Sometimes during the summer, severe thunderstorms may occur that momentarily deposit sleet and hail on Mexican glaciers. The deposited icy material does not usually stay long, and in most cases disappears in a few days after the intense rainfall event nearby ends. This melt is fast between summer season accumulation events, when the sky is clear and the solar radiation is intense. It is common to observe that after major precipitation events, that runoff increases and the soil becomes saturated with moisture. It is important to note that although most of the snow melts and is lost as runoff, also a certain portion percolates into the glacier and may become internal accumulation or also may become superimposed ice and thus, storms may contribute slightly to reduce the energy available for melt.
It is noticeable that during the dry season, lower temperatures are recorded when low humidity is registered (Figure 5). Therefore, during the dry season it is difficult to reach a natural freezing point, since at low temperatures lower humidities are required for saturation of an ice-water-air mix. Also, during the dry season the sensible heat flux is strongly correlated with temperature, where temperature controls the interchange of sensible heat flux between glacier and atmosphere. The net radiation contains the energy available for melting and overall ablation occurs during the dry season. It is remarkable that between December-February the annual oscillations of temperature (Figure 5a), atmospheric pressure (Figure 5c), and relative humidity (Figure 5b) reach a minimum value. The low pressure registered in these months also impedes the air saturation process and reduces the effect of latent heat to sublimation. Furthermore, the net radiation reaches a maximum during those months (Figure 5d), thus causing ablation and glacier thinning. The low pressure periods shown for the summit weather station are coincident with low atmospheric pressures reported for lower altitudes, and are attributed to the passage of cold fronts. Turbulent sensible heat flux is small and its variation is low because temperatures remain low during the dry early winter season; this is the same for glaciers like Zongo (see Sicart et al., 2008). However, if sublimation is strong this partly cancels out the energy gains in H and the sum of the turbulent fluxes remains small over the glacier. For Glaciar Norte this behavior is different because H is negative and can sum to the latent heat allowing sublimation of the glacial surface. Nevertheless, net radiation is stronger than turbulent fluxes and melting is more relevant than sublimation.
Between January-March the net radiation is more intense than during the rest of the year, because the weather is often cloud free over the highest Mexican summits. However, the components corresponding to the sensible heat and latent heat fluxes also present high negative values in January (Figure 4c, and d). Therefore, during this period the physical processes in connection to the sensible heat and latent heat lead to accumulation and mass gain on the glacier, whereas the radiative processes lead to ablation and mass loss on the glacier. On the other hand, it can be observed that the energy balance during the same period is strongly positive but begins to decrease during about May. So, from December to May, ablation is dominant.
During the ablation period, the glacier receives energy that will be used to increase its temperature up to the melting point and from this point on the energy will be used to melt ice. It is important to notice that the ablation period coincides with the dry season, with a decrease of temperature and atmospheric pressure. So, it would be interesting to measure surface temperature of glacier in order to get better estimation of heat fluxes and to better estimate internal glacial processes, such as superimposed ice formation.
In general, the recorded temperature is so close to the melting point that the ice near the surface does not need to increase its temperature much to reach that point. This causes the component of sensible heat to be low; however, during the ablation period, the sensible heat flux is more negative than during the rest of the year. That is because when the air temperature decreases, the glacial surface needs to release energy to be in thermal equilibrium with the surrounding air.
The dry season, observed between November-May, coincides with the NH winter season when occasionally a polar air mass descends toward Mexico from the north of the continent (Jauregui, 2004). These polar-type systems can spread stronger than normal winds and may cause the temperatures to abruptly drop. This increase in wind speed is the cause of the increase (in the importance) of the latent heat flux in the energy balance, due to elevated turbulent heat flux. On the other hand, the decrease in relative humidity during these frigid patterns causes a decrease in cloud cover over the glacier's surface, which contributes to the increase in registered net radiation during the wintertime dry season.
There are occasionally rare storms during winter, however, and for these cases, the internal and surficial refreezing will occur more easily. The refreezing happens more often after storms of late fall and early winter and this refreeze is the origin of the superimposed ice is usually found on the glacier as ice layers or surface covering sheets. The effect of refreezing of the storms in the energy balance is reflected by the fact that during these seasons the energy balance reaches its minimum. So we can say that storms during all seasons play a role in recharging the glacier that in the future should be evaluated so we can quantify their importance better.
It should be noted that the first year of data collection coincided with an "El Niño" winter (2006) and the beginning of "La Niña" year in March 2007 (Centro Internacional para la investigación del fenómeno del Niño, Boletín CIIFEN April 2007, available from: http://www.ciifen-int.org/images/stories/pronostico_est/Boletn_CIIFEN_April_2007.pdf, last access: 7 August 2012). The impacts of "El Niño" during the winter can be described in general as heavy rainfall and anomalously low temperatures, especially in the northern part of Mexico due the entrance of baroclinic waves and cold fronts from the north due to amplifications of the winter circulation cycle in North America (Magaña et al., 1999). The winter effect of "El Niño" during the year of study is associated immediately with the possibility glacier accumulation during the winter months that still coincides with the dry season. Moreover, during November-December the lowest values in our energy balance results indicate a large accumulation of mass on the glacier during this time.
During March 2007 study period, the ocean-atmosphere climate system went into the "La Niña" phase. So, for the following months the glacier observations recorded correspond to the "La Niña" spring and summer. During "La Niña" summers, the weather tends to rain across most of Mexico. Although most rainfalls are considered normal, there are greater chances that precipitation amounts could be anomalously intense during a La Niña year. There are several factors that can result in higher rainfall than normal over southeastern Mexico, but perhaps the most important is the activity of the easterly moisture stream embedded in the ITCZ and hurricanes produced in the Caribbean and Gulf of Mexico (Magaña et al., 1999). During La Niña or Neutral ENSO years hurricanes are more likely to provide extra precipitation into eastern Mexico near the study site during August through November.
Visual observations
The penitents are composed of "praying" snow peaks related to superficial ablation, that mainly form during the dry season at high altitudes in the Himalayas, Andes, Rocky Mountains, sometimes southern slopes of the Cascade volcanoes and the Alps (Betterton, 2001; Corripio and Purves, 2006). During the dry season, penitents are present on Glaciar Norte confirming that ablation occurs during this period as a result of evaporation and/or sublimation, and not just melt.
Conclusions
This study allows understanding of energy exchanges between a high mountain glacier and the atmosphere throughout several years at the Citlaltépetl region near 19o N latitude in Mexico.
The annual variability of energy balance in the glacier is characterized by the existence of a period of important ablation during the first half of the year during the Northern Hemisphere (NH) winter season, when, although at relatively low temperatures, the atmospheric pressures and relative humidities reach a minimum with a remarkable increase in net radiation. This ablation period during the tropical NH dry winter season is followed by a period of minimal net accumulation during the tropical NH wet summer season. Although the first year of this study coincided with the transition between "El Niño" and "La Niña", this did not have much influence on the annual variability of energy balance of the glacier, yielding similar results as compared to the years without these phenomena. The variability of energy balance observed during this study does not correspond to normal tropical glaciers reported elsewhere because of the interruption of the ablation period. Differences may also be due to the zone of influence of the Inter tropical Convergence Zone (see Figure 1) which wobbles northwards across central Mexico during the summer season.
Following current trends, the glaciers in Mexico could disappear in a few years, which is in correspondence with the published climatic projections made by Christensen et al. (2007). However the Mexican glaciers have already survived longer than expected, suggesting that internal refreezing of meltwater, penitent physics, storminess and hurricane variability may play more significant roles in modulating glacier balance than currently considered. Although the data collected and used for this study were not enough to provide a conclusion about the influence of climatic change on energy balance, the data obtained are important for future meteorological, glaciological and water supply studies.

