


 text new page (beta)
 English (pdf)
 Article in xml format
 Article references
 Send this article by e-mail
 Cited by SciELO
  Similars in
SciELO
Similars in
SciELO 
 Permalink
Introduction
Understanding groundwater flow systems is crucial for the management of groundwater resources in Mexico because many areas in arid zones depend on groundwater as the main source for urban, agricultural, and industrial development. In the Valley of Queretaro Aquifer (VQA), many wells are drilled near or along major faults and the high variability of piezometric levels in relatively short distances evidence changes on hydraulic properties (Carreón-Freyre et al., 2005;Figure 1). Furthermore, the spatial distribution of extraction wells and drawdown zones in the VQA during the last 30 years suggests that faults compartmentalize the aquifer system (Carreón-Freyre et al ., 2005). In the VQA, groundwater is extracted from depths greater than two hundred meters; at this depth, geological heterogeneity should be considered for evaluating groundwater flow patterns to allow an accurate estimation of groundwater resources. Thus, the VQA could be considered a faulted aquifer, where faults and fracture zones strongly influence the overall flow dynamics of the system (Caine et al., 1996; Allen and Michel, 1999) and the assessment of the hydrogeologic behavior of major structures can be as important as obtaining the hydraulic properties of the stratigraphic sequences. This work examines the role of major structures (e.g., faults and volcanic or plutonic bodies) as hydrogeological independent units, rather than only as hydraulic boundaries, and presents a numerical modeling of the groundwater flow conditions in the faulted VQA. Integration of representative geological data in the model included: (a) vertical variations by assigning a hydraulic conductivity (K) to each geological unit; (b) faults; (c) lateral truncation of the hydro-stratigraphic units and; (d) the presence of intrusive rocks (Walton, 1970; Ingebritsen et al., 2006; Zoback, 2007), in particular dikes (Kulkarni et al., 2000).
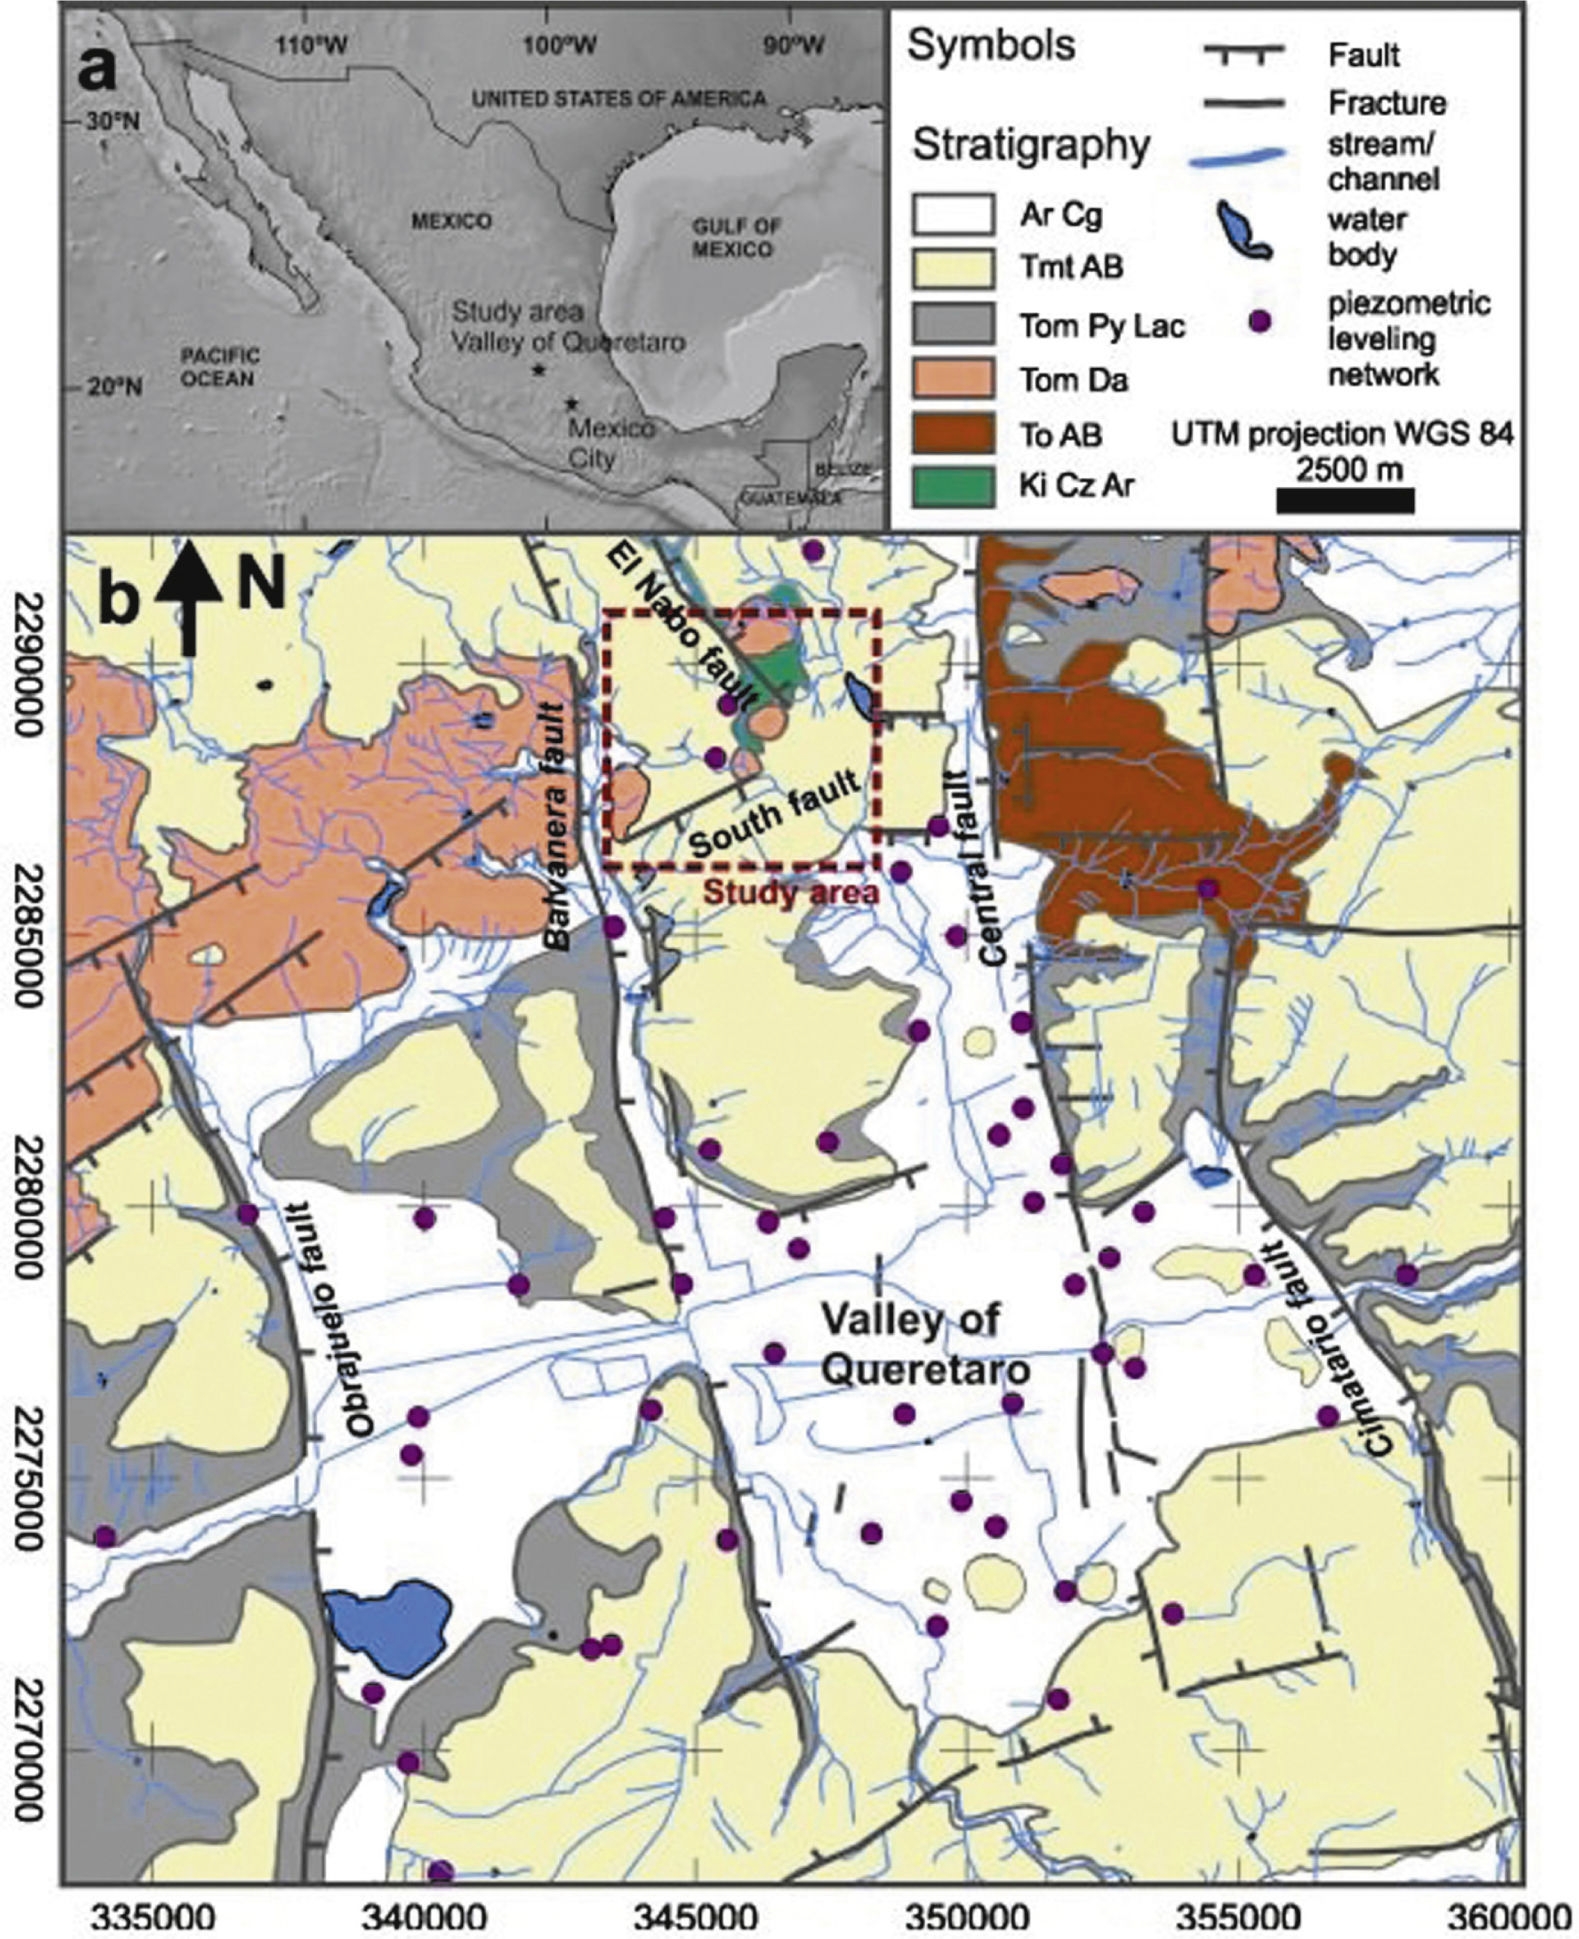
Figure 1 (a)The Valley of Queretaro is located in the central part of Mexico; (b) Geological map of the Valley of Queretaro. Dashed red square line on the geological map indicates the area considered in modeling, black lines are major faults. Green polygon represents the Cretaceous rocks exposed in the zone. Medium and light gray units represent Oligocene and Miocene volcanic rocks, respectively. (Modified form Carreon-Freyre et al., 2005).
The study area is located in the northwestern part of the VQA system (Figure 1). The Valley of Queretaro is located in the central part of the Miocene to Recent Trans Mexican Volcanic Belt (TMVB; Ferrari, 2000; Alaniz-Alvarez et al., 2002) and is delimited by groups of N-S and NE-SW trending faults active at least since the Miocene (Alaniz-Alvarez et al ., 2001). We aim at having a better understanding on the role of major structures in groundwater flow patterns in the VQA by integrating them in a numerical model.
Faulted aquifer systems
Previous works have documented the variations in hydraulics properties induced by the complex architecture of regional faults (MaClay and Small, 1983; López and Smith, 1995; López and Smith, 1996; Caine et al., 1996; Allen and Michel, 1999; Carreón-Freyre et al., 2005; Anderson, 2006; Mayer et al., 2007; Delinom, 2009; Rafini and Larocque, 2012). Anisotropy of hydraulic conductivity in faulted and stratified geological media determines groundwater flow patterns (Hsieh and Neuman, 1985). Regional faults represent an important heterogeneity influencing overall aquifer dynamics, not only determining preferential flow directions but also modifying their storage capacity (Pacheco, 2002; Burbey, 2008; Bense et al., 2013). Lithological changes and fractures in volcanic rocks, on the other hand, modify hydrogeological properties of geological units. A fault can be a preferential conduit for vertical flow, i.e., a "leaky fault", when the damaged zone is well developed and is laterally sealed (Zeidouni, 2012). Fault zones can also behave as leakage areas between aquifers by juxtaposing aquifers that would otherwise be separated by impermeable layers.
Major faults can behave as flow barriers or preferential channels depending on the hydraulic properties developed during deformation history (MaClay and Small, 1983; Caine et al., 1996; Carreón-Freyre et al., 2005; Mayer et al., 2007; Delinom, 2009, Rafini and Larocque, 2012), or they can only separate units of different hydraulic conductivity (Allen and Michel, 1999; Mayer et al ., 2007); for instance, the vertical displacement of a fault can juxtapose permeable and impermeable layers in the direction perpendicular to the fault plane. In early models, faults were commonly considered as border conditions when assessing hydraulic parameters, even in stratified leaky systems (Rathod and Rushton, 1991).
The style of deformation and rupture of a fault zone strongly influences variations of its hydraulic properties. Caine et al. (1996) proposed four conceptual schemes for fault-related fluid-flow according to the distribution of conduits and barriers (localized and distributed) within fault plain. Anderson (2006) identified three essential hydraulic elements of a fault plane: (1) a low hydraulic conductivity core characterized by fault breccias, cataclastic rocks, and gouge; (2) an adjacent damaged zone characterized by an increase in the hydraulic conductivity caused by brecciation and fracturing and; (3) fresh unaltered rock with a characteristic hydraulic conductivity that can change in both sides of the fault because of the fault displacement.
A decrease in the hydraulic conductivity within a fault plane (flow barrier) can be associated with (Mayer et al., 2007; MaClay and Small, 1983): (1) cataclasis or grain size reduction; (2) juxtaposition of permeable and impermeable layers, displacements along the fault plane can decrease the possibility of flow through the fault and/or deviating flow along the fault; (3) rotation of plane and elongate detritus that became parallel to fault plane reducing the hydraulic conductivity in the orientation perpendicular to the plane; (4) presence of sedimentary materials with low hydraulic conductivity (e. g., clays) in the fault zone; and (5) chemical precipitation of mineral in the fault zone reducing permeability.
Furthermore, major faults often present associate or secondary planes and fractures that may cause contrasting hydraulic behaviors. In anisotropic media, each geological unit is represented by a hydraulic conductivity tensor considering three dimensional variations of hydraulic conductivity. In fractured rocks the tensor can align following the preferential orientation of fractures (Jourde et al., 2007).
Geology of the Study Area (Northwest of the Valley of Queretaro Aquifer, VQA)
The regional geology of the VQA has been extensively studied in the last decades (Trejo-Moedano, 1989; Valdez-Moreno et al., 1998; Aguirre-Díaz and Lopez-Martinez, 2001; Alaníz-Alvarez et al ., 2001, 2002; Carreón-Freyre et al., 2005; Aguirre-Díaz et al ., 2005; Xu et al., 2011). The Valley of Queretaro is a basin delimited by groups of N-S and NE-SW trending faults and volcanoes, located in the central part of the Trans Mexican Volcanic Belt (TMVB; Ferrari, 2000; Alaniz-Alvarez et al., 2002; Figure 1). The N-S trending west-dipping Central fault is the eastern limit of the regional Queretaro graben (Figure 1). The other major faulting family (trending NE-SW) produced a nearly orthogonal pattern with the N-S system that has resulted in a mosaic formed by horsts, grabens, and half-grabens (Alaníz-Alvarez et al ., 2001, 2002; Carreón-Freyre et al ., 2005; Aguirre-Díaz et al ., 2005; Xu et al ., 2011) with varying vertical displacements, in some areas up to 400 m. Both fault systems have been active at least since the Miocene (e. g., Alaniz-Alvarez et al ., 2001; Zuñiga et al., 2003; Aguirre-Díaz et al ., 2005) and both controlled the deposition of sediments and volcanic rocks in the VQA.
This study is focused on the northwestern part of the VQA (dashed square in Figures 1 and 2), a zone of groundwater recharge because of faulting (Conagua, 2003). The available information was compiled and integrated in a geological map with the hydrogeologic information of the VQA and surroundings. The local stratigraphy was established from the reinterpretation of well logs, 40Ar*/39Ar dating of magmatic rocks, and geologic mapping. The structural and stratigraphic setting of this part of the basin can be defined with sufficient detail and indicates that the geological evolution is more complex than hitherto recognized (Figure 2a). In this area, the Cenozoic volcanic and colluvial sequences cover partially the Cretaceous units that were uplifted by a shortening episode and thus are well exposed in the hanging wall. A schematic W-E geological cross section AA' was constructed using the lithological logs of water extraction wells available in the zone (Mompani II, El Nabo, UNAM, and El Salitre) (Figure 2).
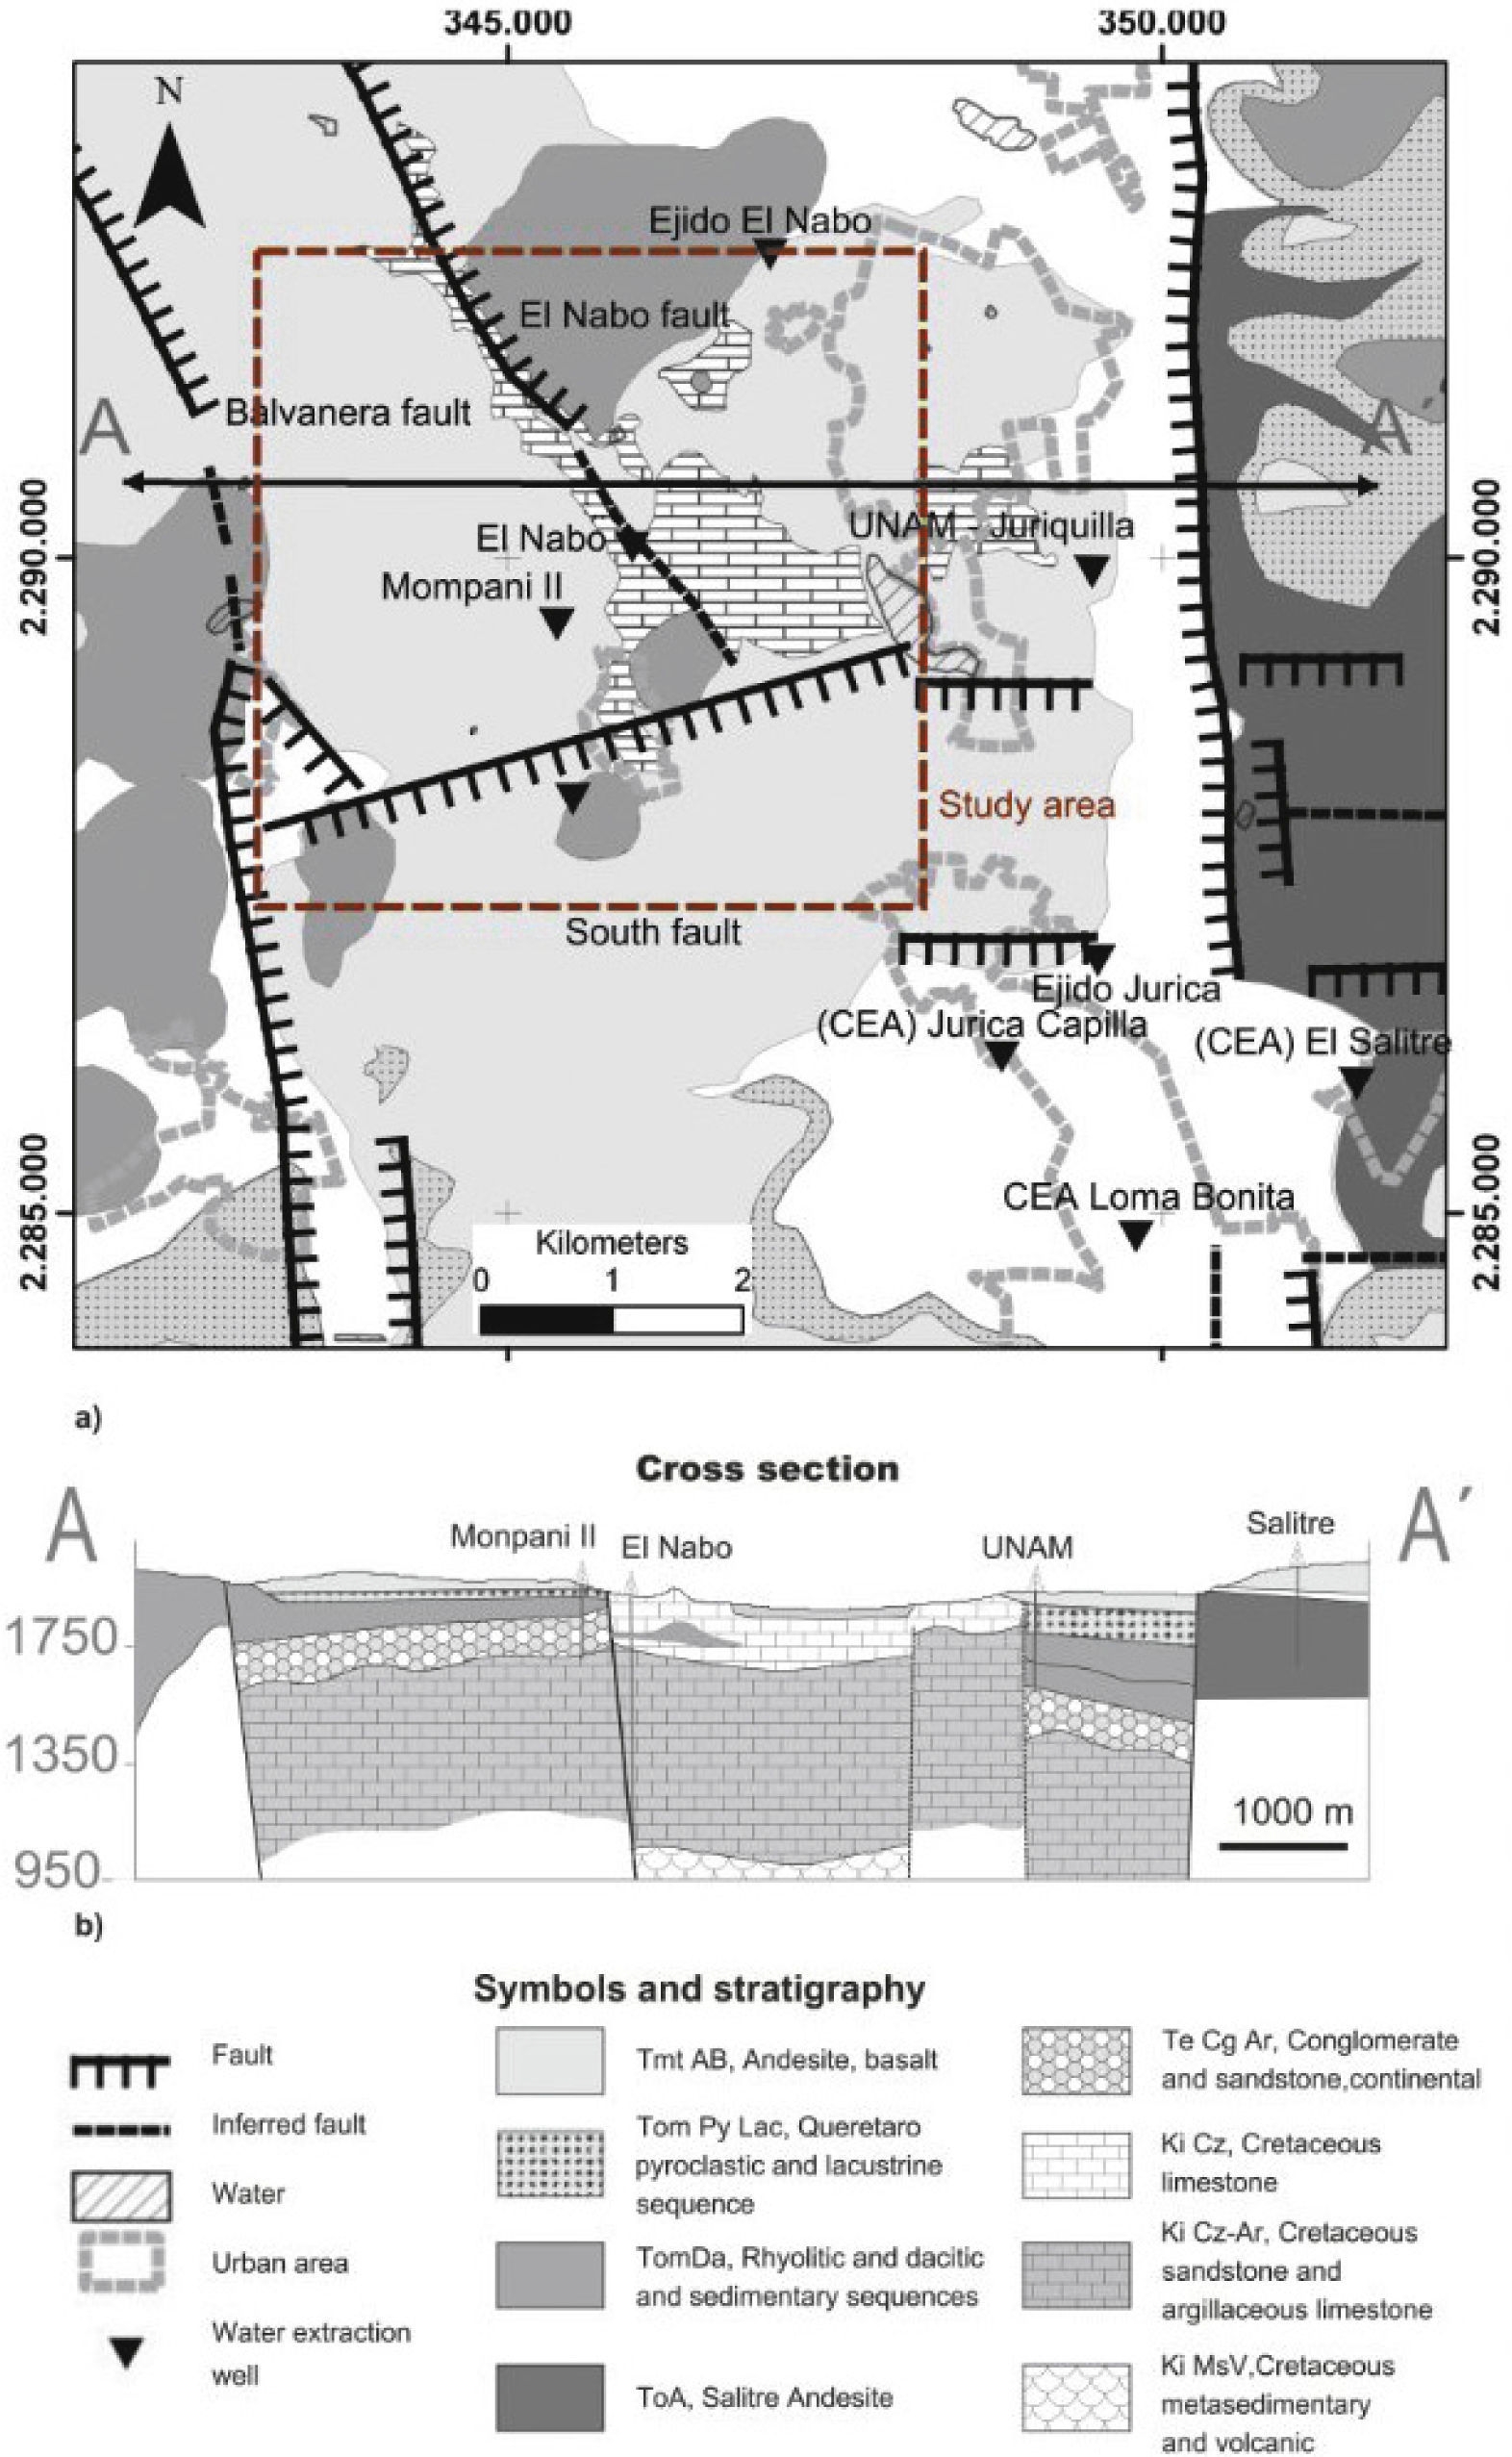
Figure 2 (a) Simplified geological map of the study area, the main structures considered in the model are the normal faults El Nabo, Balvanera and South. Logs of water extracting wells were projected to the A-A¿ section shown in (b). The main stratigraphic units are presented in the cross section.
The oldest sequence (Cretaceous) consists of volcano-sedimentary rocks, documented here for the first time in the Valley of Queretaro (Ki MsV, see below), a thick Albian limestone and shale sequence (Ki Cz, of 800 m thick), and a late Cretaceous shale and sandstone interbedded with argillaceous limestone (Ki Cz-Ar). The Cretaceous sequence is pervasively folded by shortening deformation.
The Cenozoic sequence consists of a continental sedimentary unit with predominance of conglomerates and sandstone (Te Cg-Ar), overlain by a volcanic sequence with pyroclastic and sedimentary interbedded deposits. The Cenozoic sequence is fractured and affected by extensional faults. The Te Cg-Ar layer of probable Eocene age is present at the Mompani II well (at a depth of 200 m), and at the bottom of UNAM-Juriquilla and El Salitre wells (Figure 3a). The volcanic rock sequence includes lavas such as the Salitre Andesite (ToA) and silicic domes (Tom Da; Juriquilla dacite; Alaniz-Alvarez et al., 2002) of the Oligocene and early Miocene. An intrusive body of Oligocene age (ca. 30 Ma) is exposed in the zone of Juriquilla within the study area (Figure 2a). The pyroclastic and lacustrine sequences in the Queretaro area consist of tuffs and other pyroclastic deposits of 80 m in average of thickness (Tom PyLac); and this unit includes the Ezequiel Montes Pumice, an important stratigraphic marker dated between 7.5 and 5.6 Ma (Aguirre-Díaz and López-Martínez, 2001). The coarse facies of this sequence (Tom PyLac) was the main hydrogeological unit exploited in the regional VQA, but is scarcely exposed in the study area, it is found in the upper part of the Mompani II log (Figure 3). Fissure basalts and lava flows (Tmt AB), ranging in age from 12 to 5 Ma (Aguirre-Díaz and López-Martínez, 2001) erupted from nearby volcanoes. The largest volcanic edifice, located 13 km to the NW from the studied area, is the La Joya Volcano ranging in age from 12 to 10 Ma (Valdez-Moreno et al., 1998).
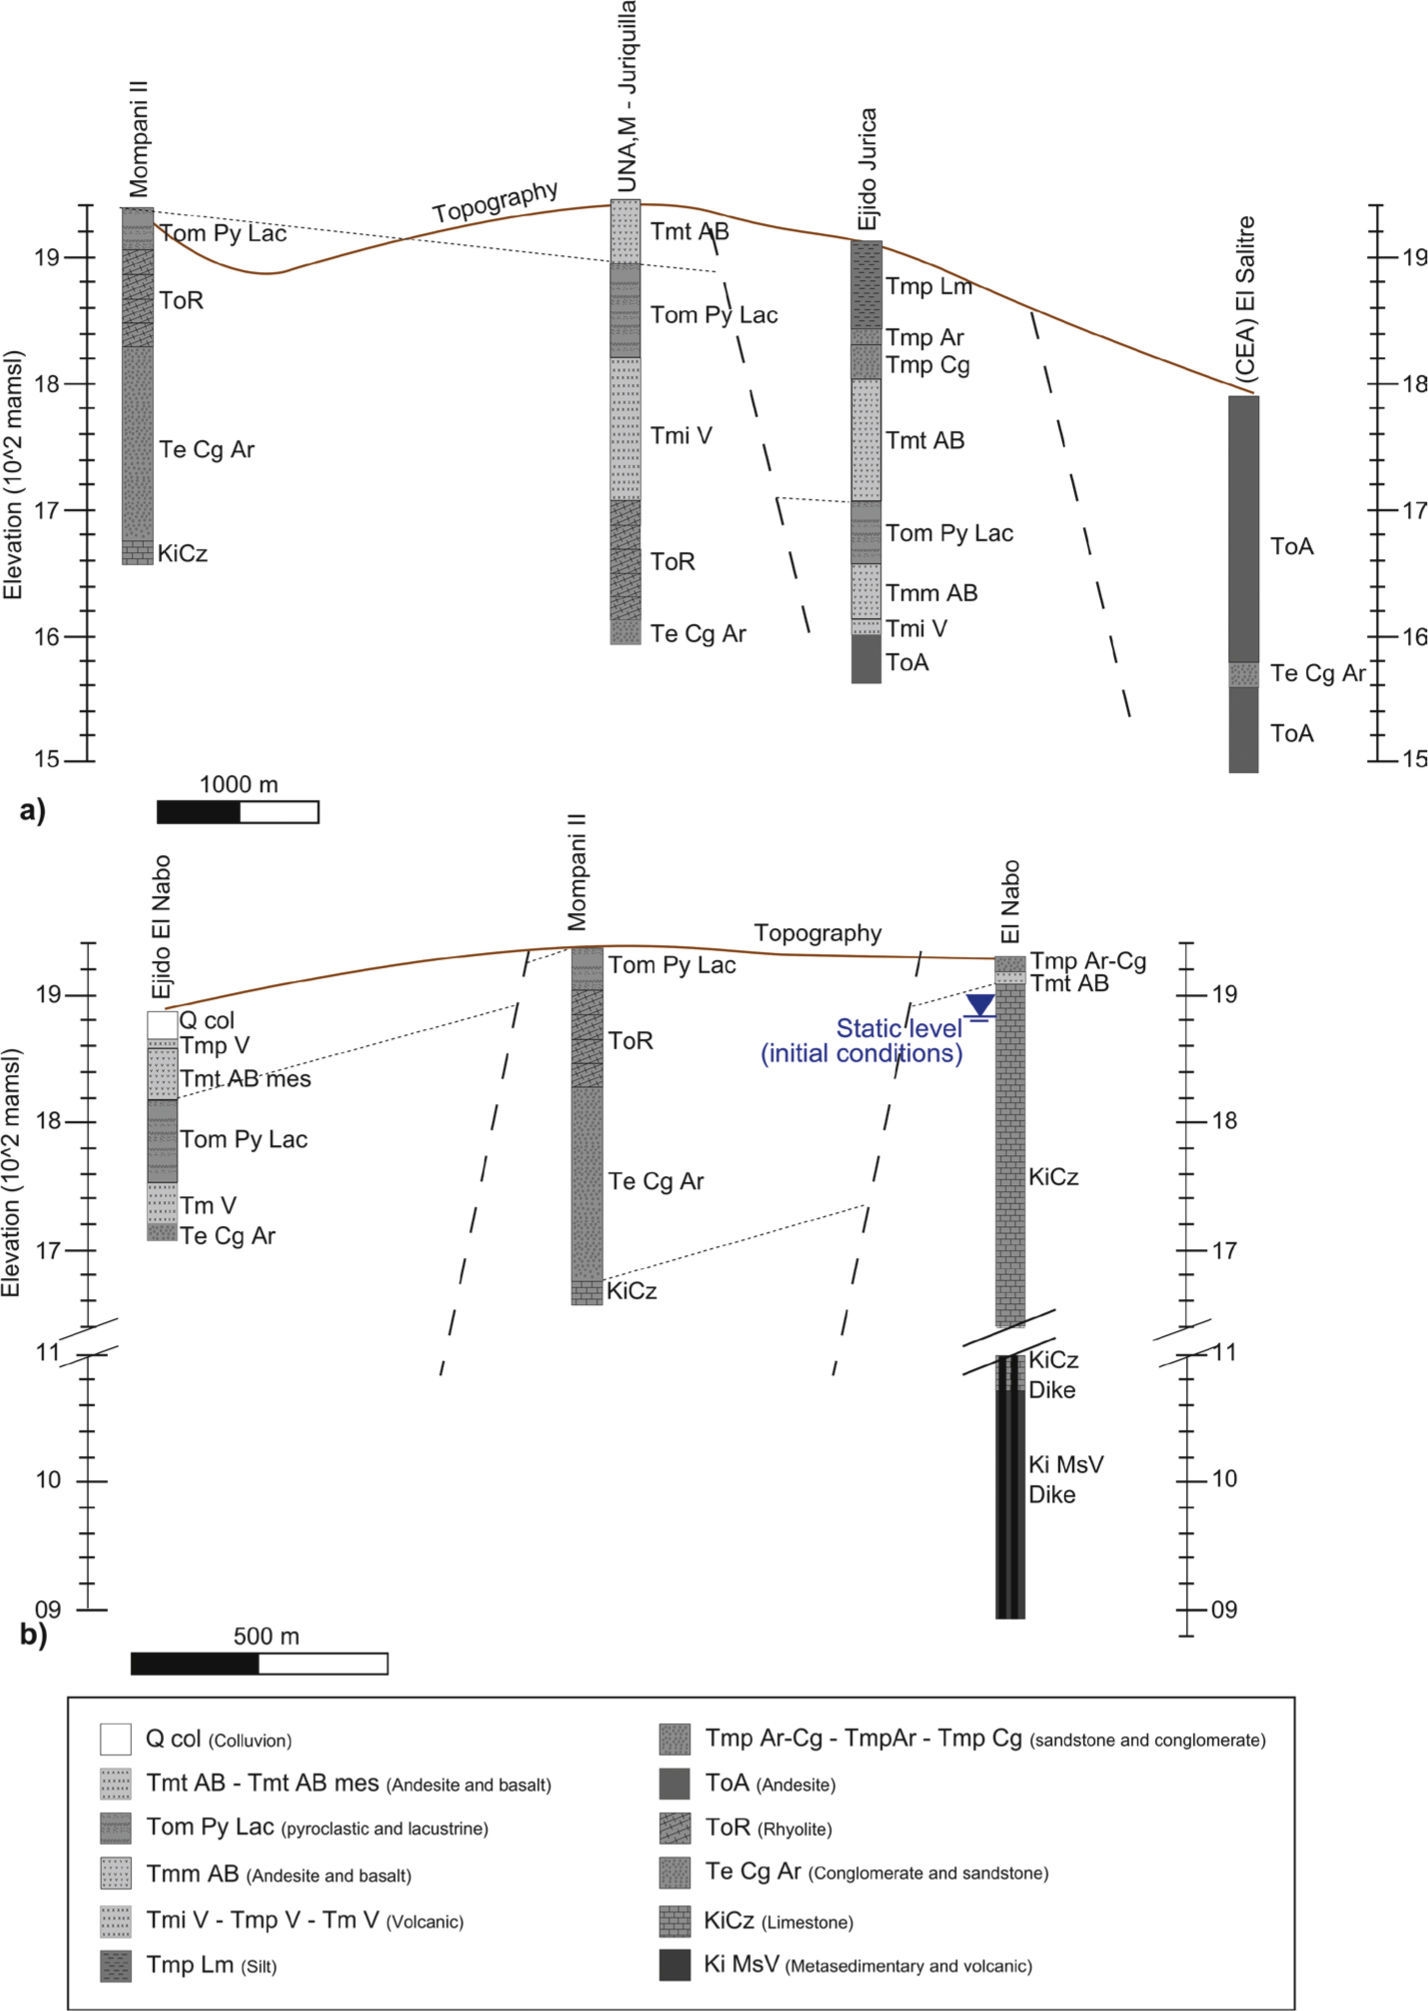
Figure 3 Stratigraphic correlation of the lithological logs of extraction wells used for the interpretation of the main structures and construction of the conceptual model. (a) Correlation of wells in the NW-SE direction including Mompani II, UNAM-Juriquilla, Ejido Jurica, and (CEA) El Salitre; (b) correlation in the N-S direction Ejido El Nabo, Mompani II, and El Nabo. The initial static water level in the El Nabo well is also shown.
The truncation and throw of the N-S trending extensional faults was inferred by the elevation differences among stratigraphic levels from the correlation of lithological logs presented in Figure 3. The vertical displacements are smaller than 200 m. From Figure 2b note that two additional buried faults nearby, and to west of UNAM well, were inferred in this work. Structurally, the study area is a block delimited by the major N-S trending Balvanera and El Nabo fault zones dipping to the northeast (Figure 4a). The South fault and other NE-SW trending fault segments delineate the limits of the block toward the south. Both faults systems have nearly vertical fault planes and their kinematics indicate dip-slip towards the center of the Queretaro Valley since Miocene time. These major faults include several parallel fault planes affecting areas with more than 50 m in width (Figure 4). Faults are partially exposed and their trace length was inferred by topography, field observations, and lithological correlations of well logs. The relative age of faulting in the region was analyzed in detail by Alaniz-Alvarez et al (2001); the older system corresponds to the South Fault that favors the emplacement of the Oligocene intrusive body. The Balvanera and El Nabo fault systems are younger and favor the Miocene volcanism through dykes emplaced along the faults planes (Figure 4). The El Nabo Fault is of particular relevance to this work, it is a nearly vertical fault partially exposed to the north of the study area where plateau lavas fill the hanging wall of the fault (solid line with thick marks in Figure 2a). Toward its southern part the fault is not clearly observed on surface but it can be inferred from the topographic relief and the interpretation of the stratigraphic records (dotted line in Figure 2a). A dyke emplaced along a fault plane parallel to El Nabo fault was observed at the surface northeastward of the El Nabo well (Figure 4b). All this information was integrated to constrain the numerical model.
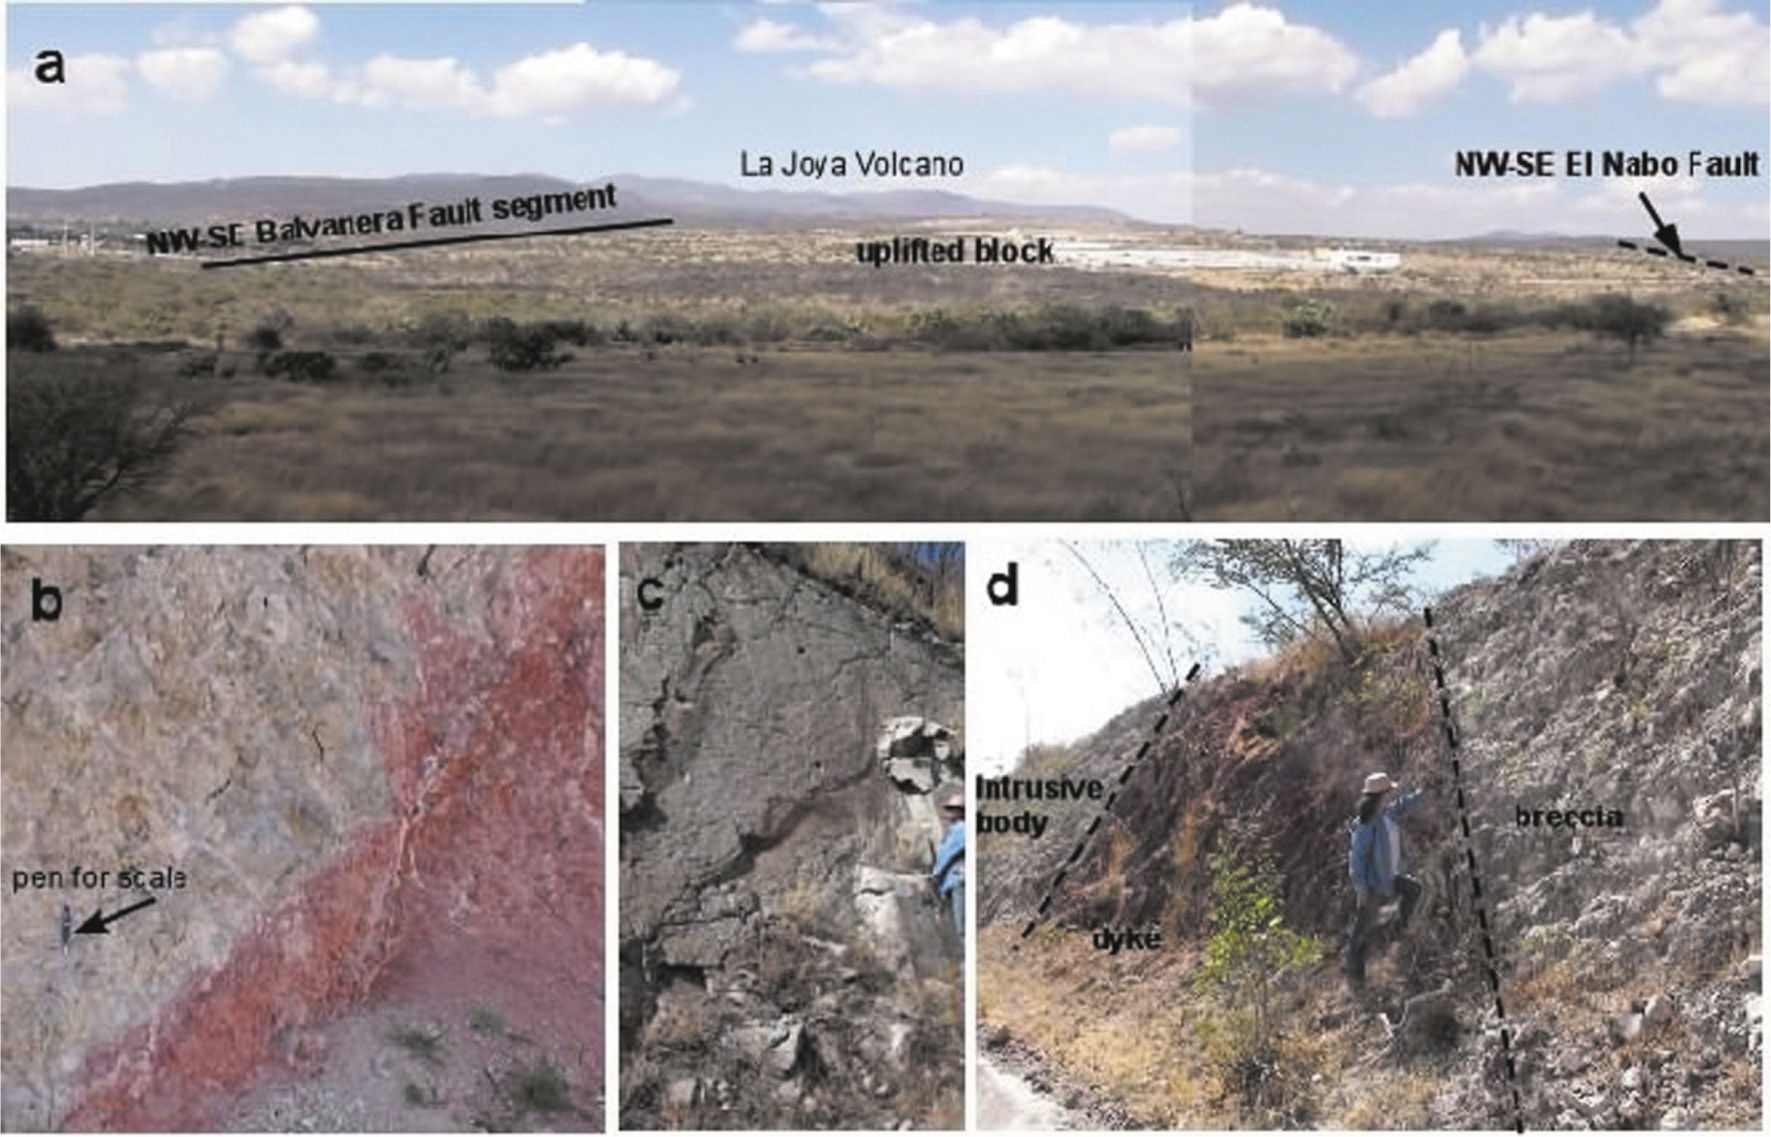
Figure 4 (a) General view to the NW of the study area, the escarp of the Balvanera fault can be observed, the trace of the El Nabo fault is inferred by a dotted line because it delimits NE side of the uplifted bock (horst). As reference the La Joya volcano is shown toward the NW of the study area; (b) close view in outcrop of the South Fault (pen for scale) showing the contact between the intrusive body at the left and evidence of hydrothermal activity; (c) outcrop of the intrusive body; (d) outcrop of a plane associated to the El Nabo fault zone, the contact with the intrusive body and the structure of a dyke with brecciated material are shown.
Methodology
Stratigraphic correlation
The conceptual model of the study area is based on geological units with contrasting hydraulic properties, granular and fractured rock layers, truncated by major faults and volcanic edifices/bodies that may interrupt or favor lateral flows. Carreón-Freyre et al. (2005) correlated the hydrogeological units with lithostratigraphic units to describe the VQA and proposed a conceptual model of multilayer aquifer with groundwater flow varying from local to regional. The stratigraphic correlation of lithological logs for the Cenozoic was based on the reconnaissance of an andesitic-basaltic unit of late Miocene age, named Tmt AB, as an index layer. For instance, as shown in the record of the Ejido Jurica well (Figure 3a) the Tmt AB layer commonly is overlaid by a Miocene-Pliocene sedimentary unit, named Tmp Cg-Ar-Lm, and underlied by an Oligocene-Miocene pyroclastic and lacustrine unit, named Tom PyLac.
The Cretaceous units are more relevant to groundwater flow in this area and include sandstone and argillaceous sequences, limestone rocks, and a volcano-sedimentary sequence. These units were found during drilling of El Nabo well, which is the deepest in the study area and is located within a block where Tertiary sequences are partially eroded (Figure 3b). The contrasting stratigraphy and the vertical difference in elevation of the Ki Cz unit from 1680 to 1100 masl among the Mompani II and El Nabo records separated by approximately one kilometer suggested the presence of the El Nabo Fault at this location.
Drilling of the first 600 m depth of El Nabo well initiated in 2000 at this time the production of water was approximately 6 l/s. Extended drilling in El Nabo well from 600 to 1000 m depth was performed in 2007, the production of the well increased dramatically to 47 l/s after drilling at 850 m depth, that coincided with a lithological change from limestone to a volcano-sedimentary sequence (volcanic rocks and limestone) bearing biotite minerals). Further evidence of the fault and its relevance to groundwater flow was obtained by the geochronological data of rock samples from the El Nabo well presented below.
Biotite age determination
In order to define the age of the basal volcanic unit, rock samples collected each 3 m during drilling from 800 to 1050 m depth were classified by the use of a 20x-40x stereoscopic magnifier, and some samples of interest were selected for thin section description. Biotite concentrates were selected for dating at depths between 850 and 950 m. These biotite concentrates were analyzed by the 40Ar*/39Ar technique at the Geochronology Lab in CICESE using a VG5400 mass spectrometer and a laser extraction system. The analytical details of the method can be consulted elsewhere (e.g., Cerca et al., 2007). Mineral concentrates were previously irradiated at the nuclear reactor of the University of McMaster in Hamilton, Ontario, Canada, using as monitor of irradiation two known-age samples of sanidine, FCT-2 of 27.84 ± 0.04 Ma and TCR-2 of 27.87 ± 0.04 Ma. All the experiments were made by step-heating by increasing the laser power from 0.2 to 8 watts and measuring the isotopic composition of argon released during each step. The reported age is calculated for each individual fraction and the integrated results adding individual steps in accordance to Hall (1981), and considering the corrections by discrimination, radioactive decay (Steiger & Jäger, 1977), the line background, and interference reactions from isotopes derived from Ca, Cl, and K. Results were grouped according to depth and size of the samples and are presented in a graph named age spectra. Correlation diagrams in which the relation (40Ar*/39ArK) is given by the inverse of the intercept of the line defined by the data and is equivalent to the age in Ma are presented in a supplementary Figure (S1).
Integration of conceptual and numerical models
The conceptual model resulting from the interpretation of lithological logs, geological mapping, analysis of samples, and isotopic data is shown in Figure 5 (a, b) . The wells integrated in the numerical model are El Nabo and Mompani II, 1100 and 250 m depth, respectively (Figure 5a). For the implementation of the numerical model, the volcanic sequences, sedimentary materials, and geological faults were considered as independent hydrogeological units; each one with a hydraulic conductivity tensor.
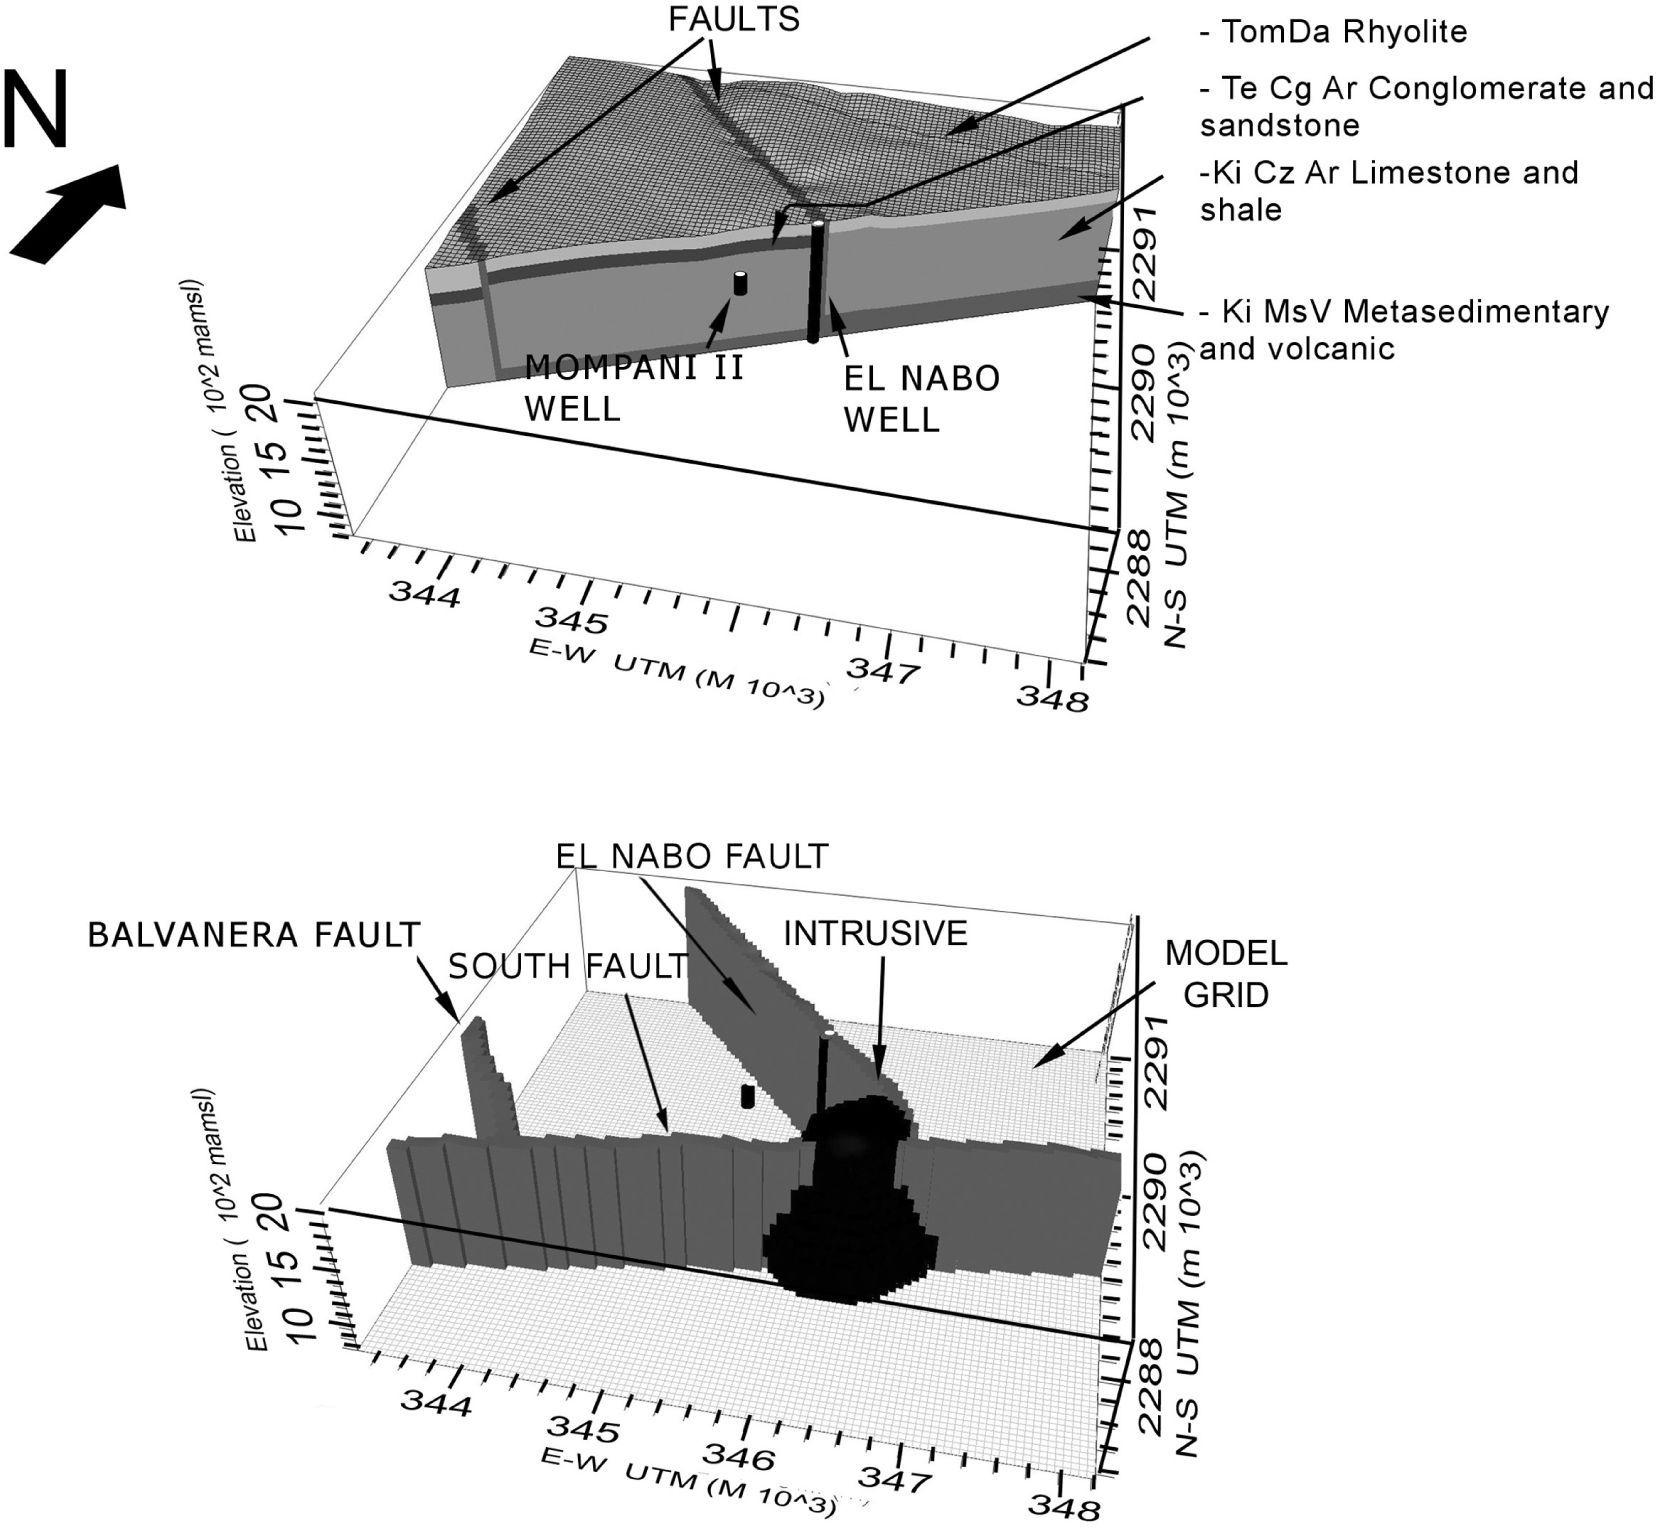
Figure 5 (a) Model box formed by an horizontal square grid of 25km2 and variable thickness layers. El Nabo and Mompani II wells were integrated in the model. Cells were grouped to represent hydro-stratigraphic layers with specific hydraulic properties. (b) Major geological structures in the model: (1) El Nabo fault-dyke, (2) Balvanera fault, (3) South fault and, (4) an intrusive body. The topographic surface is considered in the model.
Groundwater simulation was accomplished with the Visual-Modflow software (Schlumberger Water Services, Inc) and the Modflow 2000 code (Harbaugh et al., 2000). In order to represent the hydraulic behavior of the mapped geological structures the numerical model was built with 100,000 cells, distributed in a horizontal grid of 100 x 100 cells in the N-S and E-W direction, each one represents a square of 2500 m2. The model box is a square of 25 km2 with a top surface with an average elevation of 1945 masl reproducing the actual topography and a flat surface at the bottom of the model (800 masl). The model box was divided in 10 horizontal layers of cells with variable thickness from the surface, according to the topography, to reach a bottom flat layer. Cells with similar hydraulic behavior were grouped to represent the geological units included in the model considering stratigraphic sequences and major structures. According to their physical characteristics, spatial distribution, and thickness, four geological units were defined in the conceptual model and represented in the numerical model shown in Figure 5a:
TomDa-Rhyolite , this is the upper layer of the model, and groups the Cenozoic volcanic rocks including the volcanic and pyroclastic fractured sequences located above the piezometric level in the study area. These units, observed in the lithological records of the Ejido Jurica, UNAM-Juriquilla, and Ejido El Nabo wells, were not considered in the conceptual model because either they are located above the regional groundwater level (vadose zone) or are absent nearby the El Nabo well area (Figure 3). These units include: Late Miocene Andesites and Basalts (Tmt AB), Early Miocene Conglomerates and Sandstones Sandstones (Tmp Ar-Cg), and Quaternary Alluvium (Qal; Figure 2);
Te Cg Ar Conglomerate and sandstone , a sedimentary unit of conglomerate and sandstone found at the west of the El Nabo fault, was represented by a dark layer shown in the model of Figure 5a;
Ki Cz Ar Limestone and shale , this unit includes Ki Cz and also the Ki Cz-Ar of sandstone and argillaceous limestone for modeling purposes, and;
Ki MsV Metasedimentary and volcanic (Figure 5), located at the bottom of the model, corresponds in nature to the Cretaceous volcano-sedimentary unit (Ki MsV).
Faults are represented by groups of 50 m width vertically aligned cubic cells with specific hydraulic conductivity (gray cells in Figure 5b). The massive intrusive/subvolcanic body of 30 Ma is represented by a group of cells with a dome shape in the located central part of the model (black cells in Figure 5b). Major geological structures were considered as four individual units in the model: (5) the El Nabo Fault , (6) the Balvanera Fault , (7) the South Fault and, (8) the intrusive body placed in the lower part of the model (Figure 2 and Figure 5b).
Faulting and the intrusive body are thought to greatly influence groundwater by channelizing or arresting flow, or by interrupting the lateral continuity of the hydro stratigraphic units, such as the conglomerate and sandstone unit (Te Cg-Ar) . Truncation by faulting was suitable represented because each geological unit was composed by independent cells.
Once designed the geometry of the model, the initial and border conditions were established considering regional variations of the piezometric surface interpolated from 2004 and 2006 measurements (Figure 6). Previous work by Carreon-Freyre et al. (2005) indicated a regional gradient in the groundwater flow with a nearly north to south direction in the VQA. Regional piezometric were interpolated by krigging of the data from 40 water extraction wells located in the VQA, systematically monitored by the local agency of water (Comisión Estatal de Aguas de Querétaro , CEAQ) since 1996 (Carreón-Freyre et al ., 2005). The interpolations show a persistent regional gradient with an approximate North-South trending. The wells located in the study area are El Nabo and Mompani II (Figure 1 and Figure 5a). A steady state numerical simulation was performed to establish the initial and boundary conditions (Figure 7b). Boundary effects were minimized by leaving a minimum radius of 2000 m from each well to the model borders.
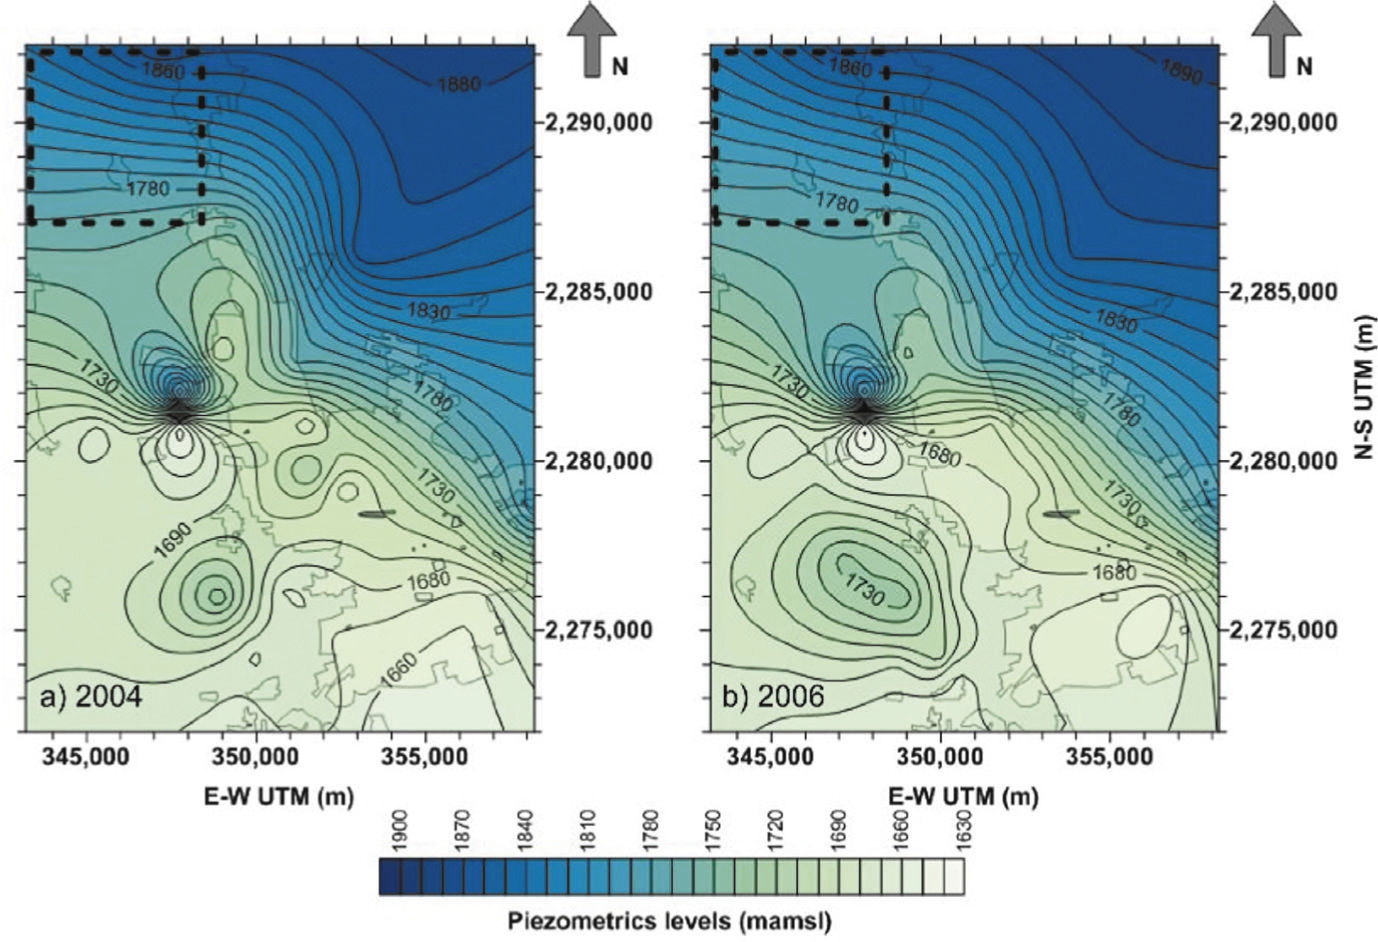
Figure 6 Piezometric levels measured in the Queretaro Valley for (a) 2004 and (b) 2006. The 2006 piezometric levels were used as initial condition for the model. Because the North-South hydraulic gradient, shown in the dashed square (modeled area), is persistent during 2004 and 2006 we considered steady state conditions.
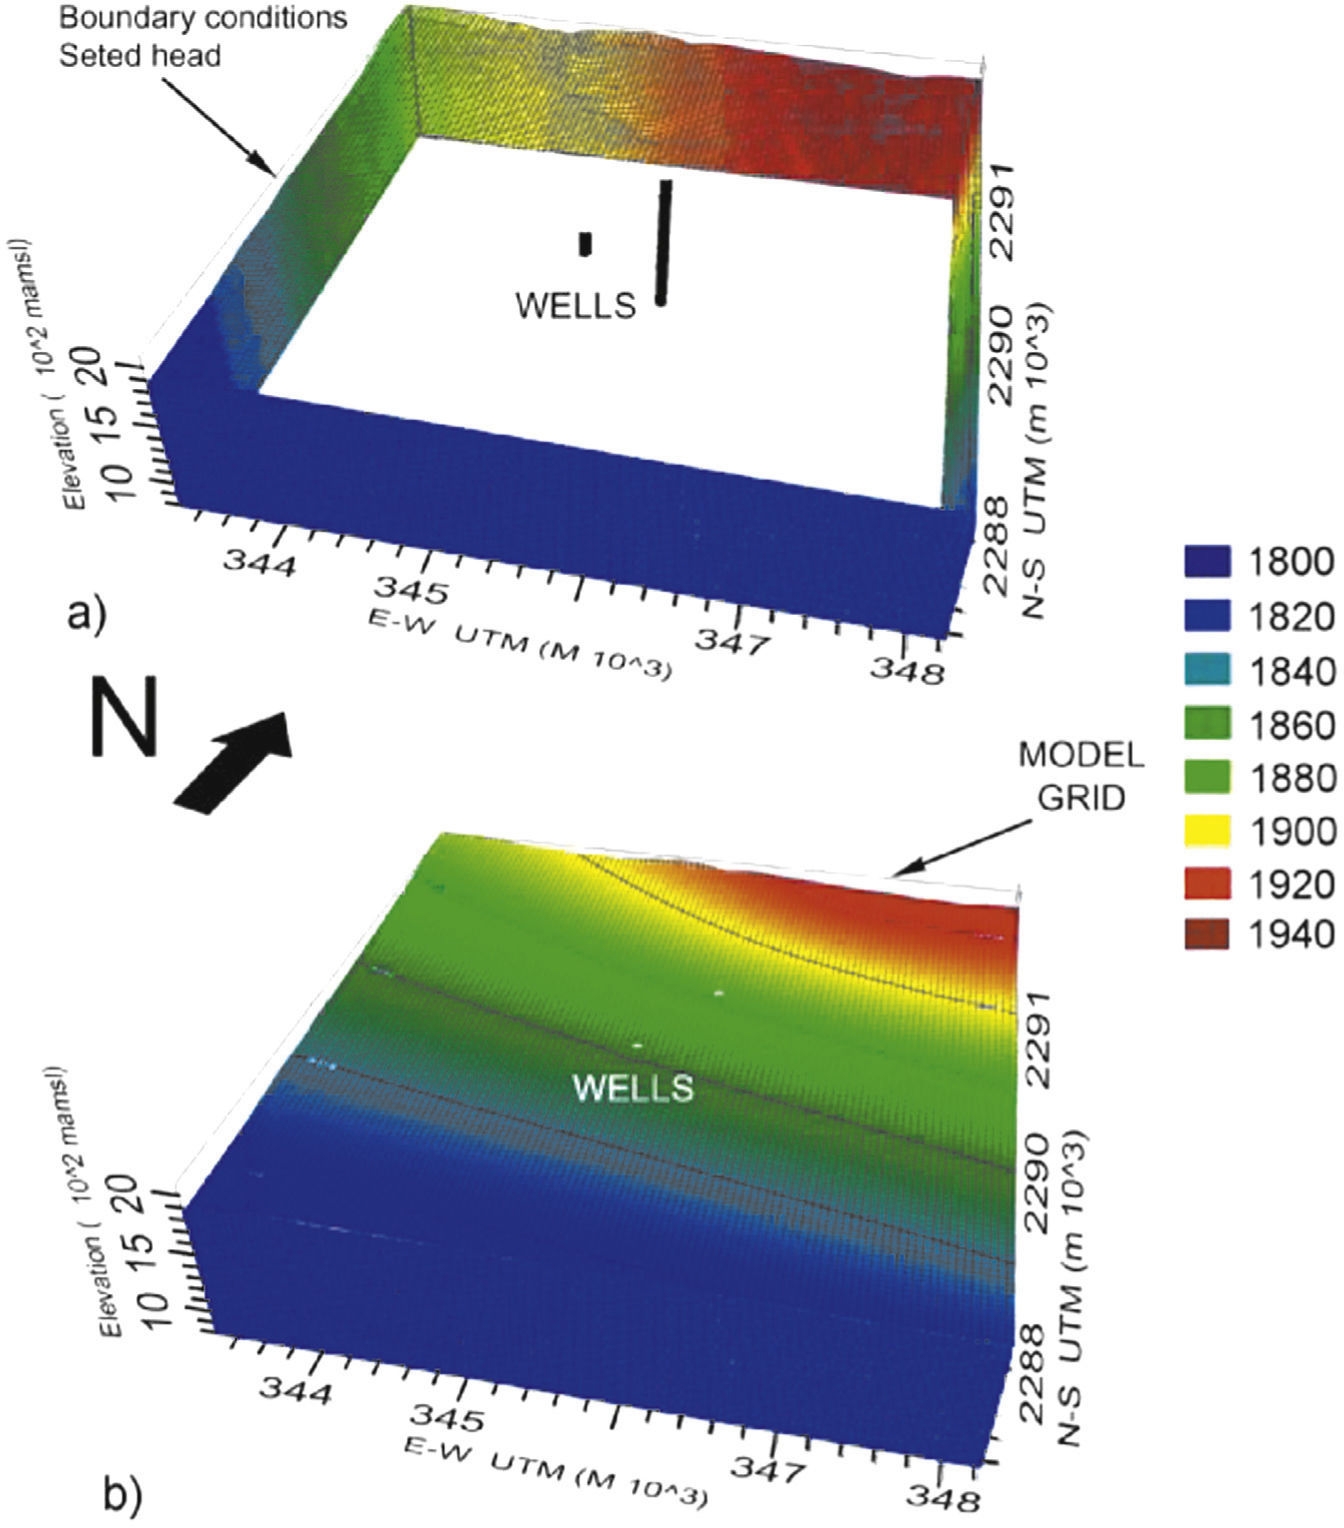
Figure 7 Piezometric conditions shown in the model box with (a) border and (b) initial conditions after the steady state measured in 2006 (see figure 6b).
Simulation of hydrodynamic conditions using the numerical model
A numerical simulation was performed to assess the hydrodynamic behavior of the system by the use of partial results of a pumping test. In the computational experiment the hydraulic properties were adjusted to correlate calculated and measured drawdown in the pumping and in one observation well.
A 260,000 s (72 hour) pumping test performed in the El Nabo well was simulated using the implemented numerical model. The location of the pumping test area is shown in Figure 2; the data record (water level and temperature) was made by a CTD Diver (Schlumberger ) datalogger. This well is the single one in the region with about 1000 m in depth and therefore it was not possible to locate any observation well. The Mompani II well is located 1000 m to the SW, with a depth of 250 m. Because of the presence of the El Nabo Fault between the two wells no change in the hydraulic head during the pumping test was recorded at the Mompani II and thus, we assumed that groundwater flow in both wells were independent (possibly local and regional systems).
To accomplish the simulation, the hydraulic conductivities of the model and measured drawdown were closely fitted. We used a segment of the pumping test to simulate transient conditions generated by the pumping test. Continuous measurements of drawdown and temperature every 15 s are presented in Figure 8 (blue and green line respectively); blue squares indicate samples from the continuous measurements used for simulation. Because of the well depth only a part of the pumping test could be considered for adjustment. The first 10,800 s data (3 hours) were not considered because the pumping rate could not be maintained stable during this period and/or a well storage effect should be considered (Allen and Michel, 1999), the same issues were considered for the interpretation of the recovery data.
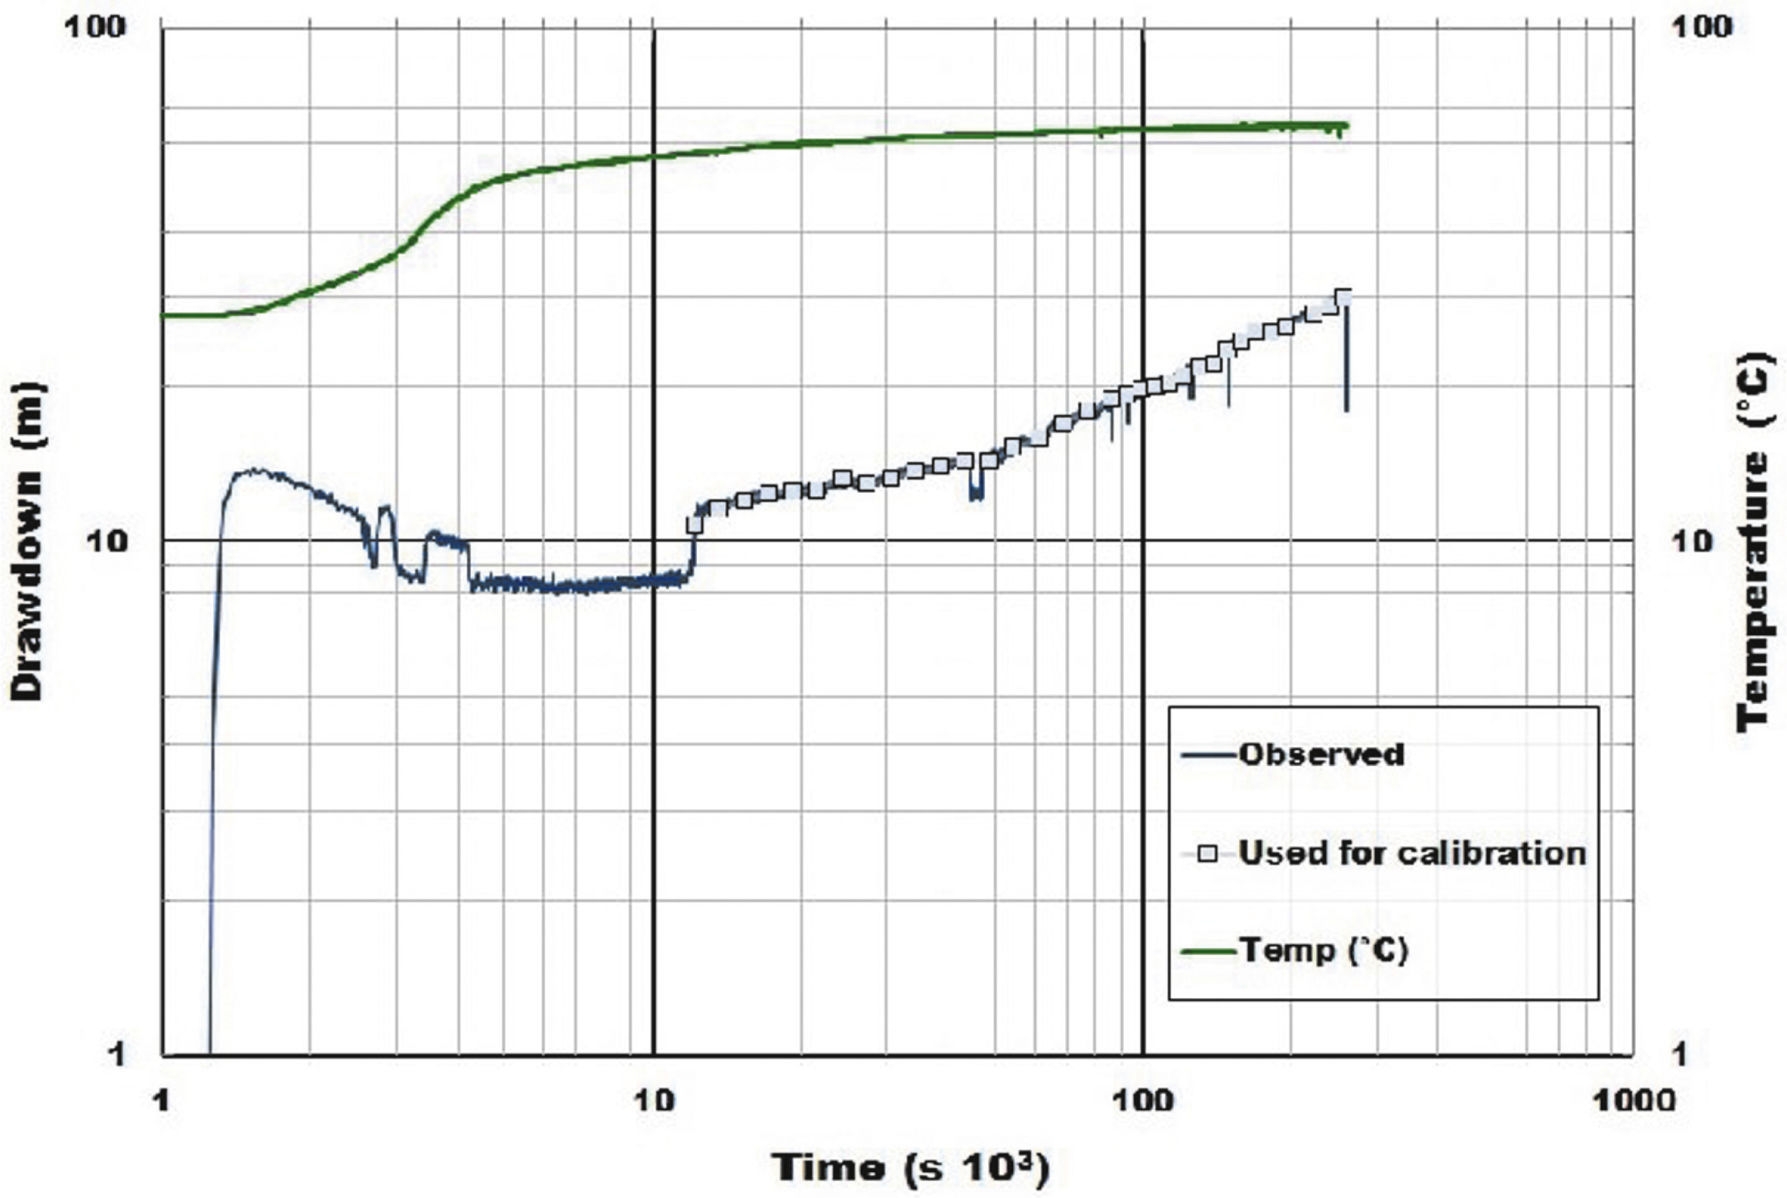
Figure 8 Drawdown measurements collected during the El Nabo pumping test. Blue line indicates continuous datalogger measurements, blue squares the sampled points for calibration. Green line indicates increasing temperature in the extracted water.
Simulated and observed drawdown in the segment between 10,800 and 250,000 s (3 and 69 hours) of the El Nabo test were fitted by adjusting the hydrogeological properties of the main units (e.g., Allen and Michel, 1999). The estimation of these properties was achieved using the PEST (Parameter Estimation Software ) algorithm (Harbaugh et al., 2000; Doherty, 2005) trough Visual-Modflow. The finite differences Modflow algorithm solved groundwater flow by adjusting hydraulic conductivities in three perpendicular directions, corresponding with the orientation of the grid to North-South, East-West, and vertically for this study case. The initial value of hydraulic conductivity (K) was established at 1e-04 m/s, corresponding to reported values for massive and fractured rocks (Walton, 1970; Ingebritsen et al., 2006; Zoback, 2007).
The best fit of the observed and calculated drawdowns was achieved by using the hydraulic conductivities (K) values presented in Table 1, along two directions: horizontal E-W and vertically. The North-South values of K remained fixed at the initial value. The sensitivity values for the obtained hydraulic conductivities (Table 1) of the model vary with the distance between the geological units/faults and the pumping test zone. High sensitivity means a high influence of the geological unit in drawdown. The "limestone and shale" and "El Nabo fault" units show the highest sensitivity values (Table 1b). The high values in the El Nabo Fault are due to the fact that the pumping well is located along this fault. The lower obtained sensitivities correspond to the Balvanera and South faults, meaning that the conductivity values of these units did not affect the calculated drawdown.
Table 1 (a) East-West and vertical hydraulic conductivities obtained from simulation. (b) Table of sensitivity variability for PEST analysis, higher sensitivity values of the model are related to the El Nabo fault. See text for details.
The results of the pumping test were analyzed by the derivative of the data obtained by applying the fixed-end-point method (orange line) proposed by Bourdet et al. (1989) (orange line in Figure 9). The use of the derivative allows analyzing in detail pressure changes in drawdown plots (Bourdet et al ., 1989; Spane and Wurstner, 1993; Tiab, 2005). The derivative was smoothed by the use of the third point before and after the point of interest to reduce the sample rate noise. The intersection between dyke/fault and the El Nabo well was analyzed by the semi-analytical solution of Butler and Liu (1991).
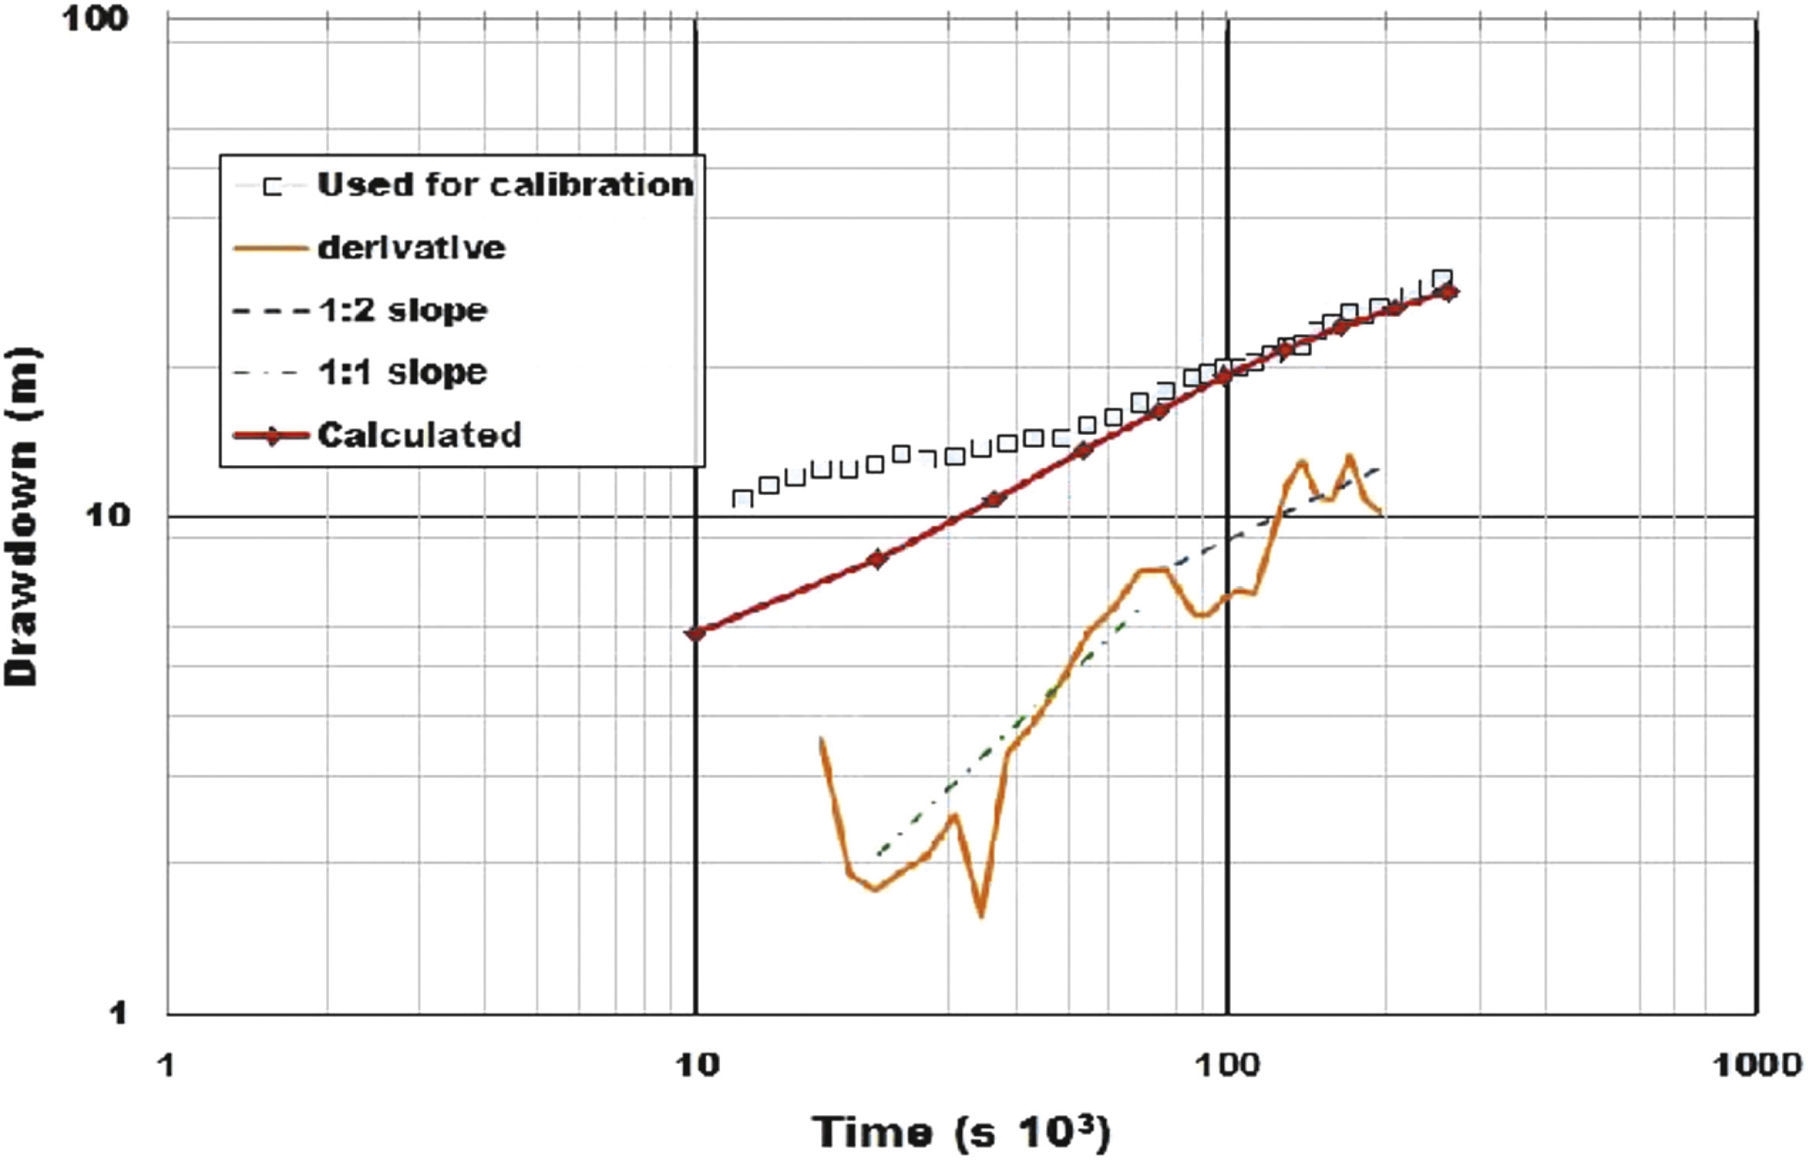
Figure 9 Measured drawdown during the pumping test at El Nabo (blue squares) and calculated curve using the implemented model. The derivative of the data obtained by applying the fixed-end-point method (Bourdet et al., 1989) is presented in a orange line. Derivative drawdown was analyzed by the semi-analytical solution of Butler and Liu (1991) obtaining 1:2 and 1:1 slopes.
Discussion of results
The implemented model allowed representing the faulted system of the study area by the hydraulic conductivities assigned to specified geological units, including faults. In order to constrain the overall flow conditions regional measurements of hydraulic heads and geological observations were integrated.
Geological constraints for the imple-mentation of the model
The Cretaceous sequence drilled in El Nabo well, composed by a limestone and shale unit (Ki Cz-Ar) that overlies a volcano-sedimentary sequence (Ki Mvs), was of the most importance to establish the geological constraints of the model. The volcanic character of the basal volcano-sedimentary sequence was interpreted from the drilling samples and was confirmed by the isotopic ages. The overlying limestone and shale unit is more than 800 m thick and is inter-bedded both with sandstone or clay. In nearby superficial outcrops this unit is deformed by folding and contains calcite veins and fractures. Rock samples obtained from depths below 850 m at the El Nabo well of the volcanic sequence contained a large quantity of biotite. Differences in the size and aspect of biotite defined two size populations: (1) between 425 and 710 μm and (2) between 250 and 425 μm. The age spectra obtained for both sizes confirms that they correspond also to two different age populations.
Figure 10a shows the age spectra for the biotite population 1 indicating a Miocene age. The weighted average for argon fractions was made by considering the consecutive fractions with greater radiogenic argon content and more than 10% of the total 39Ar released. A representative age of t = 9.5 ± 0.1 Ma was selected from the weighted average of 13 fractions from different experiments in the age spectra diagram. This biotite population is characterized by a ratio 37ArCa/39ArK ≤ 0.5. The correlation diagrams obtained for these samples (Figure S1) show two isochron lines also converging at an age around 9.5 Ma. The Andesitic lava flows (Valdez-Moreno et al., 1998) cover most of the study area and have the same Miocene age obtained for biotite 1 population, the coincidence in age of the lavas and the biotite sampled at depth strongly support the interpretation that the lavas were feed by dikes emplaced along faults.
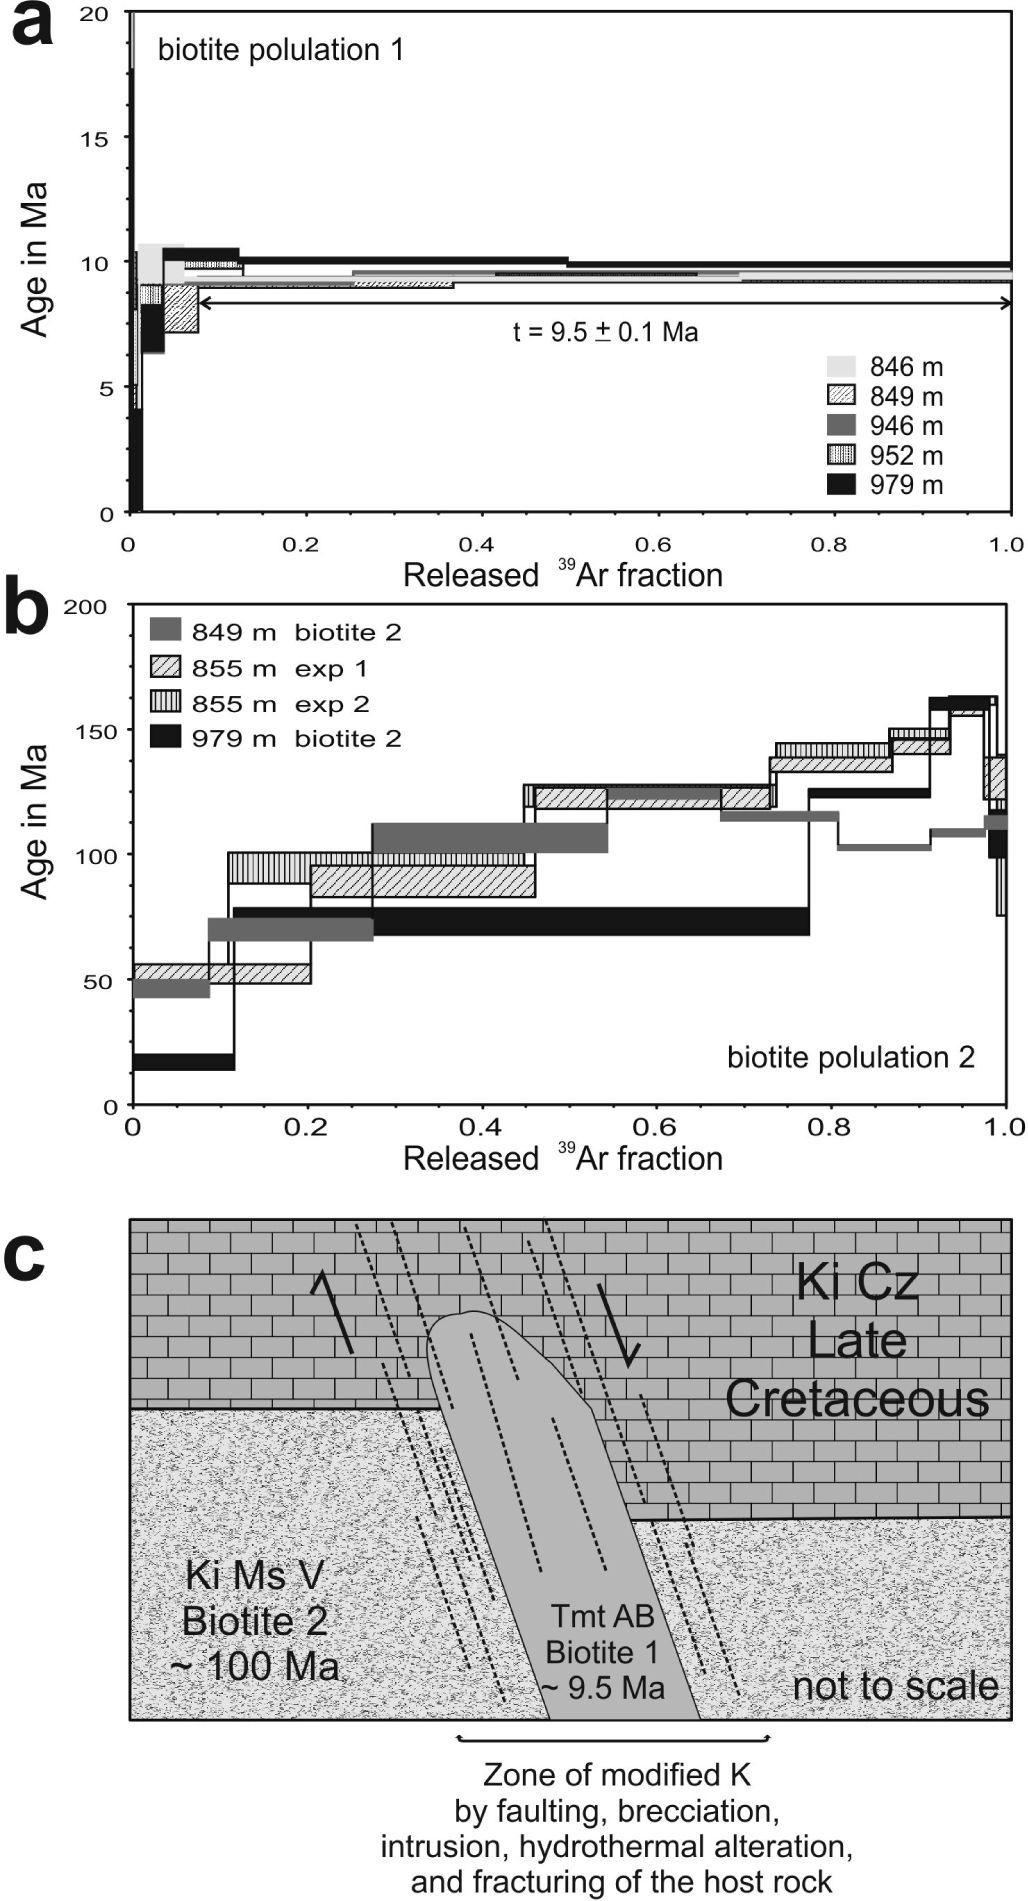
Figure 10 (a) 40Ar/39Ar* age spectra obtained for the biotite population 1 (small size) collected at different depths between 846 and 979 m in El Nabo well. The age obtained for this population is interpreted as evidence for a Miocene dyke intrusion. (b) 40Ar/39Ar* age spectra obtained for the biotite population 2 collected at the same depth interval of population 1. Although a reliable age cannot be assigned to the samples, a minimum age of 100 Ma is interpreted for the volcano-sedimentary sequence hosting the Miocene intrusion, (c) schematic section showing the intrusion of the volcanic dyke (Tmt AB, 10 Ma) within the Cretaceous sedimentary and volcanic units (host rocks: Ki Cz and Ki Ms V) that changes dramatically the hydraulic conductivity of the system by brecciation.
The biotite population 2 (Figure 10b) yielded older ages of ∼100 Ma with age spectra diagram indicating a severe argon loss. A reliable age cannot be obtained but the sequence is older than the minimum age obtained. This behavior was reproduced in the 855 m depth Biotite in duplicate experiments. A higher ratio of 37ArCa/39ArK > 0.5 compared with biotite population 1 clearly indicates a different composition. Because of the different isotopic behavior of these samples the biotite populations were plotted separately in the correlation diagram (Figure S1), in which the equivalent age is shown in the abscissa axis. The correlation using the fractions from 3 to 6 of the 1st experiment and the fractions 3 to 8 of the duplicate experiment in the biotite 2 population also indicates an age of ∼100 Ma, for the Ki Ms V rock sequence.
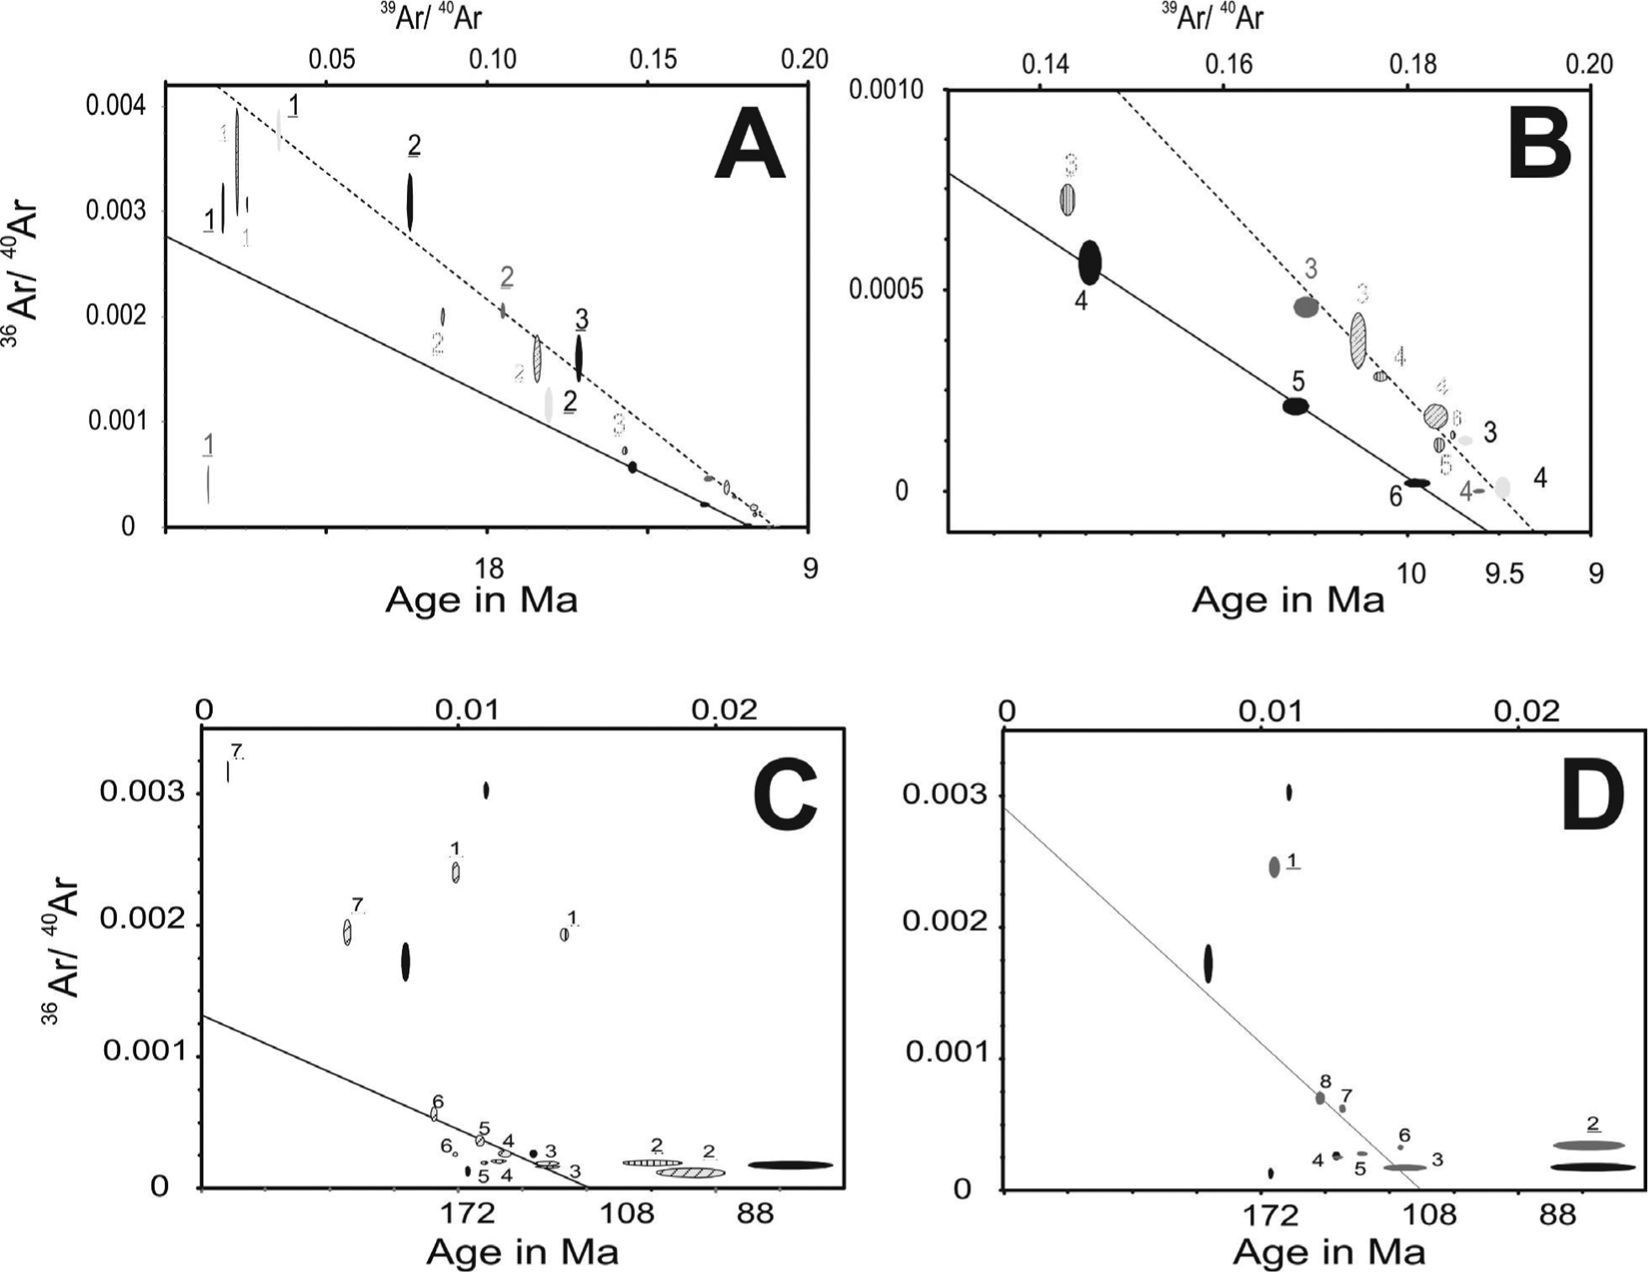
Figure S1 Correlation diagrams obtained for samples for Biotite Population 1 and 2. Isochron lines (A and B) yield an age around 9.5 Ma for samples of Biotite Population 1; whereas Biotite Population 2 (C and D) converge at an age around 100 Ma.
The documented difference in age of the biotite populations strongly supports our interpretation of the presence of a Miocene magmatic dyke intruding the Cretaceous sequence as shown in the schema of Figure 10c. The presence of this fault has important implications in groundwater flow by the increasing of the hydraulic conductivity within the fault plane that was observed during drilling.
It has been documented that dikes open weakened fractures to conduct magma toward the surface and during their emplacement they can cause further brecciation of the fractured zone and the increase of hydraulic conductivity (Zoback, 2007; Anderson, 2006). Beside the presence of the dike, further evidences supporting the circulation of hydrothermal fluids along the fault include the presence of hydrothermally altered calcite veins in exposures and in drilling samples of the El Nabo well (Figure 4b). Present day hydrothermal activity along the fault was confirmed by the increase from 25 to 63 °C in the temperature records during pumping test (green line, Figure 8).
In order to consider the role of major faults in groundwater flow we integrated the El Nabo, Balvanera and South faults in the model. El Nabo and Balvanera are sub-parallel normal faults with NW-SE orientation (panoramic view, Figure 4a). The Balvanera Fault has a throw of more than 200 m after the Miocene lavas emplacement. The El Nabo Fault is located in a block delimited by the regional graben faults as shown in the cross-section of Figure 2b. Several faults and fractures with similar orientation were observed around the zone of the El Nabo well. The Cretaceous sedimentary sequences (Ki Cz-Ar) have a low hydraulic conductivity as shown by the low flow rate measured in the El Nabo well above 800 m depth (6 l/s). Nevertheless, flow rate increased to 47 l/s when drilling intersected the El Nabo Fault and dike at 850 m depth. We infer that the dike caused brecciation, fracturing, and hydrothermal alteration of the host rock and consequently an increase in the hydraulic conductivity. Evidence of other dikes emplaced on the El Nabo Fault area affecting other stratigraphic levels was observed in exposed parallel fault planes. For modeling purposes, the Balvanera Fault features are assumed to be similar to the El Nabo Fault and was calibrated as an independent unit.
The exposed plane of the older age South Fault (Figure 4b) contains open fractures filled with sediments and calcite that precipitated by the circulation of hydrothermal fluids. The South Fault favored the location of the Oligocene sub-volcanic body (30 Ma, TomDa) of silicic composition (Alanis-Alvarez et al ., 2002) observed as a dome structure at the surface (Figure 2). Given its large spatial dimensions this structure was considered as an individual unit in the numerical model (Figure 5b).
The geological evidences suggest that groundwater flow through faults is significant in the study area: thus, the model integrated an increase of conductivity along the El Nabo fault.
Assessment of groundwater flow in faulted and high heterogeneous areas
The numerical model was constrained by the results of the pumping test in El Nabo well. The record of the test was sub-sampled and the obtained drawdown plot is presented in Figure 9 (blue squares) along its derivative (Bourdet et al., 1989). Considering an infinite linear strip embedded in a host material (matrix) with differing hydraulic properties Butler and Liu (1991) presented derivative curves with slopes varying from 1:2 and 1:4 for a case in which hydraulic conductivity is much larger than the host material (matrix). In their analysis these slopes corresponded to an initial linear flow within the strip that changed to bilinear flow when the flow from host material contributes to discharge. The slopes obtained from the drawdown derivatives of the El Nabo well pumping test are shown in Figure 9; a slope 1:1 (green dashed line) for the 20,000-70,000 s (5-19 hour) interval and a slope 1:2 (black dashed line) for the last part of the data. The first slope (1:1) corresponds to the primary flow drawdown that may be explained by two conditions: (a) groundwater flow contributed by the limestone unit presenting high K values in the E-W direction and (b) is enclosed within the fault walls (Table 1) or, (2) non lineal flow inside the fault walls and constrained by the regional gradient, which magnitude is large enough to oppose flow toward the well.
The 1:2 slope may be related either to discharge of a lineal regional flow within the El Nabo Dyke/Fault (i.e. strip unit, Butler and Liu, 1991) or a new source of regional flow. Support evidence of the contribution of a hydrothermal deep groundwater flow system through the fault was provided by the increase in temperature while pumping (25 to 63 °C, green line in Figure 8). The initial increase of temperature in a time interval of 83 minutes suggests mixing of local fresh groundwater and hydrothermal flow, with the presence of a preferential conduct through the magmatic dyke/fault.
The calibrated hydraulic conductivities (obtained using PEST software) were used to simulate the pumping test in the numerical model (red line; Figure 9). The wellbore storage may have caused the rapid initial drawdown of the El Nabo pumping test (the well is more than 1000 m depth and 6 inches in diameter). Time required for pumping stabilization (10,000 s, or approximate 3 hours, Figure 8) was not considered in the model, drawdown initiated from a relative zero value. A pseudo-steady flow regime observed in the 10,800-35,000 s (3-10 hour) intervals (Figures 8 and 9) was not completely adjusted by the calculated drawdown. From 20 hour (75,000 s) the numerical solution converges with the data and the model results are better fitted (Figure 9). In spite of the initial differences, we consider that model curve captures the overall behavior of the pumping test suggesting a similarity of hydraulic behavior between model and test.
The model allows discussing the contribution of each geological element in the overall hydraulic behavior of the system. Faults were considered as vertical planar structures with varying hydraulic conductivities according to the E-W or vertical groundwater flow direction. The block model of Figure 11 summarize the main groundwater flow results using the K values presented in Table 1, and shows the piezometric levels reached at the end of the pumping test simulation. Colors indicate piezometric levels, which range from 1925 in the north area to 1820 masl toward the south. The higher gradient is obtained toward the east of the El Nabo Fault . Arrows, indicating flow directions, show clearly that major structures (El Nabo and South faults) favor ground-water flow patterns along planes and also delimit compartments with differences in hydraulic behavior. Field observations show that the hydraulic interaction of the fault with the El Nabo well starts at 850 m of depth and the presence of hydrothermal groundwater can be interpreted in terms of ongoing deep lateral flow facilitated by the heterogeneous permeability within the fault-zone probably due to the dyke intrusion (López and Smith, 1995; Lopez and Smith, 1996). Horizontal flow predominates in the model while the flow patterns deviate along the geometric boundaries of the intrusive body, interrupting the connection between El Nabo and South faults, and following the regional N-S gradient.
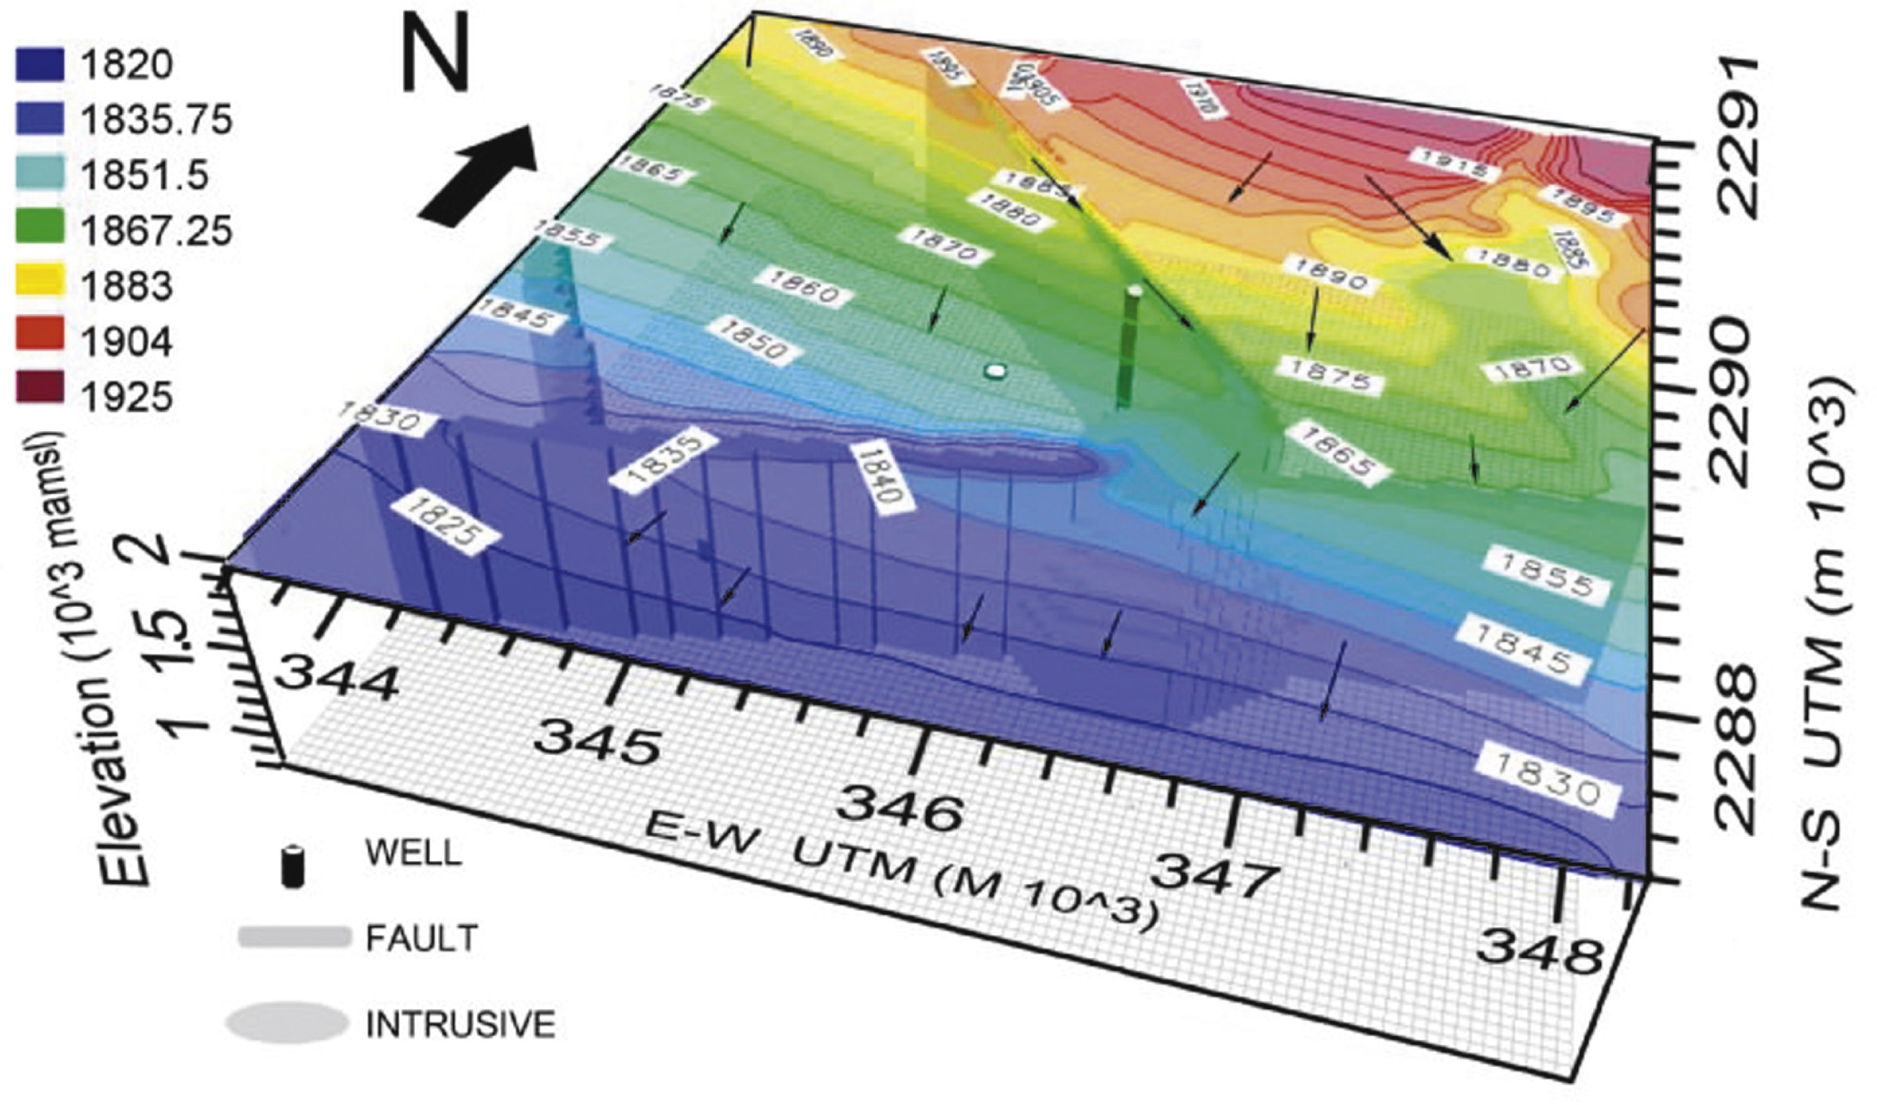
Figure 11 Model box of the study area presenting drawdown elevations and groundwater flow vectors after simulation of El Nabo pumping test using calibrated of hydraulic conductivity values shown in Table 1. Faults act as flow channel interfering with the regional flow gradient and compartmentalizing the aquifer system. Arrows show the direction and sense of flow. The large intrusive dome modifies flow in the fault. The El Nabo fault-dyke exerts a major influence in groundwater flow.
Figure 12 shows one horizontal and two vertical cross sections (in the E-W and N-S directions) of the model (Figure 11) that allow to analyze the influence of major structures (El Nabo and South faults and the intrusive body) in groundwater flow patterns. In the horizontal cross section at 1400 masl of Figure 12a the northern segment of the El Nabo Fault act as a barrier by interrupting groundwater flow from north to south within the limestone and shale unit, also shown in the vertical BB' profile (Figure 12c). The hydraulic head observed at 1900 m north from the El Nabo fault decreases to 1840 m in the southern block. In the East-West cross section (AA¿ in Fig. 12b) the color scale indicates a difference in piezometric elevations of 40 m at both sides of the fault. In the model the regional gradient is interrupted by the El Nabo Fault that acts as a lateral flow barrier in the east-west direction, the vertical equipotential lines indicate vertical flow within the fault. The NE-SW orientation of the South Fault seems to favor channelized lateral flow towards the SW along the main fault plane. The South Fault yielded the highest K value in the horizontal E-W direction (Table 1). The model is not sensitive to this structure and this high value may be an artifact produced in the model by the equalization of drawdown and regional gradient. However, field data suggest also a higher K for the South Fault than for El Nabo Fault .
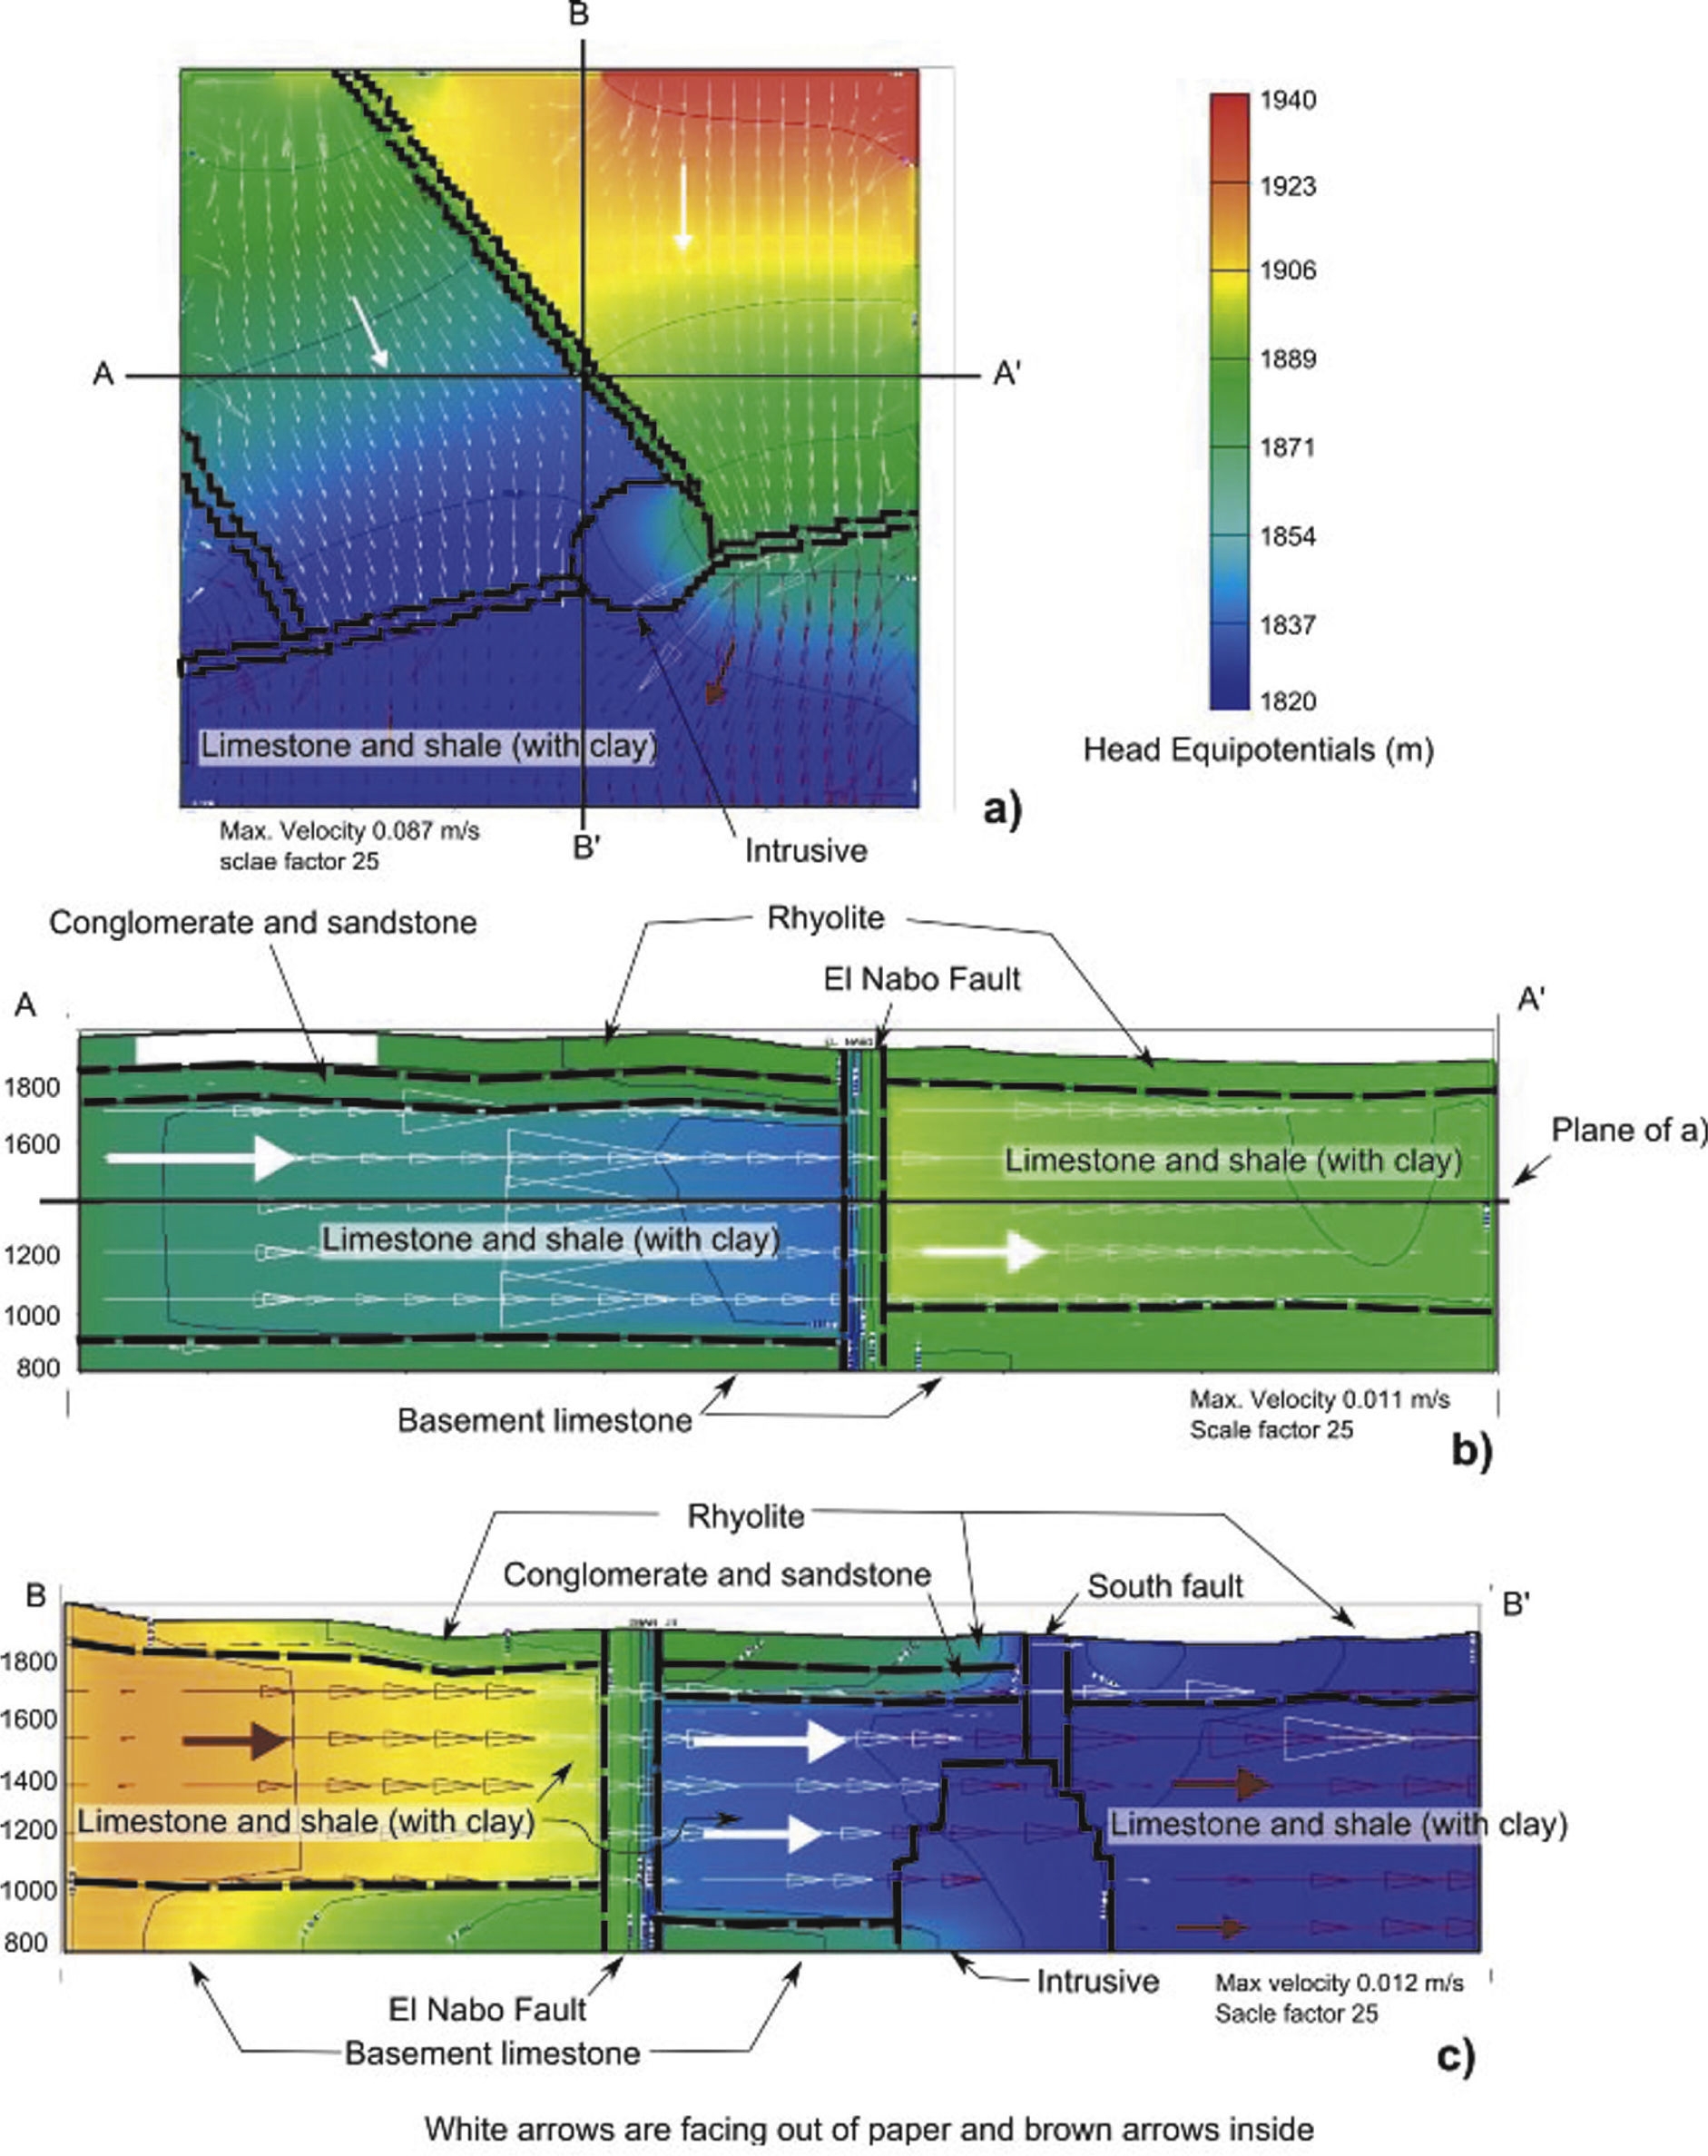
Figure 12 Horizontal and vertical sections of the model box are presented in Figure 11. Colors indicate variation of piezometric heads from 1940 to 1820 masl. (a) Horizontal cross section at 1400 masl (location shown in Figure 12b), the black lines represent the analyzed faults walls and intrusive body. (b) and (c) are two cross sections of the model box in the NS and EW directions respectively.
The 1:2 slope of the derivative curve (orange line, Figure 9) was interpreted as lineal flow within a high permeability channel with semi-permeable walls, interpretation consistent with the presence of El Nabo Fault-Dyke (Figure 12 b, c). The semi-permeable walls condition in the model is represented by the equipotential lines at both sides of the faults. Smooth gradients within the stratigraphic units increase when crossing the fault indicating a high hydraulic gradient but with flow continuity. The limestone and shale unit also show hydraulic continuity with the fault to the west; whereas in the eastern part have a higher elevation suggesting a greater water contribution from the fault (Figure 12c).
Given that only one observation point could be considered, the El Nabo well is the deepest well drilled in the Queretaro area with most of the well depths about 300 m, analysis of representativeness of the obtained hydraulic conductivity was not possible to do. Nevertheless, the information yielded by the pumping test was useful for the calibration of the numerical model allowing simulating groundwater flow in the study area.
In summary, this work attempts to highlight the importance of integrating an accurate geological setting to understand groundwater flow dynamics in models of faulted aquifers in particular in cases were piezometric levels decrease constantly.
Fault zones in the study area have more than 50 m in thickness and several fault planes were observed where high and low K segments may coexist. Because the style and relative age of faulting determines variations in its hydraulic properties we consider that in faulted and deep aquifers (more than 200 m depth) the assessment of the overall flow dynamics is as, or more, important as obtaining specific hydraulic properties of the hydro-stratigraphic units.
Field evidences of present day hydrothermal water circulation within fault planes in the study area and the model results allow proposing that faults collect groundwater flow and explain the flow rate increase to 47 l/s at El Nabo Fault . Moreover, the Cretaceous sedimentary sequences show an overall low hydraulic conductivity. The magmatic dikes caused brecciation, open fractures, and hydrothermal alteration of the Cretaceous host rock and consequently enhancing its hydraulic conductivity (e.g., Zeidouni, 2012;Table 1). The South fault system favored the emplacement of the Oligocene intrusive body. Field observations suggest that this fault also favored fluid-flow over time along open fractures partially filled with sediments and secondary fault planes in a zone more than 50 m in width. We have observed precipitation of calcite in fractures (Figure 4b), and probably infiltration of superficial water. Correspondingly, after the simulation the higher K values obtained in the East-West direction of the South Fault allowed the hydraulic continuity of the system, according with the regional gradient (Figure 11).
Conclusions
Implementation of the geological structure in a numerical groundwater flow model, along with the estimation of hydraulic conductivities by a pumping test, produced relevant information about flow dynamics in the faulted aquifer system at the north of the Valley of Queretaro. This methodology can be applied to study groundwater flow in other areas of the Queretaro Valley and elsewhere in central Mexico, where water is extracted from depths greater than 200 m and high uncertainty exist about the influence of major structures in groundwater flow conditions.
The study area is a block delimited by faults where the older geological units in the Queretaro Valley are exposed. Considering faults and truncation of hydrostratigraphic units in the sequence leaded to the reconnaissance of compartments in the aquifer system also reproduced in the model. The identification of groundwater flow patterns through the aquifer when modeling drawdown was consistent with measured piezometric levels. The derivative analysis of the pumping test suggests the presence of two different groundwater flow systems: (1) a flow, with slope 1:1, related to the limestone and shale sequence and, (2) a regional linear flow, with slope 1:2, transporting water through faults.
The numerical model along with the drawdown field observations allowed estimating relative values of hydraulic conductivity for eight geological units (Table 1). As expected, the model is sensitive to the fault located near the El Nabo well (Figure 1). Of importance to the study is the presence of volcano-sedimentary sequences below thick limestone units. Isotopic dating confirmed the presence of a Miocene magmatic dyke emplaced along the El Nabo Fault. Both the Balvanera and El Nabo fault systems favored the emplacement of Miocene volcanism through dykes along the faults planes (Figure 4). The presence of the fault-dyke was corroborated with stratigraphic correlation of a well log, and the results confirm its relevance to modify groundwater flow. The increased high flow rate in the El Nabo well pumping test (47 l/s) is an evidence of the high influence of the dike that allows groundwater to flow through the fault.
The obtained values agree with the conceptual model but connectivity between major faults cannot be evaluated only by the analysis of pumping tests. The numerical model allowed exploring the relevance of geological structures in the simulation of groundwater flow (Figures 11 and Figure 12). In particular, the model results highlight how faults and intrusive bodies emplaced along faults modify groundwater flow by changing hydraulic properties and consequently flow direction. The model allowed improving the interpretation of the pumping tests. Numerical modeling is useful for a better understanding of complex aquifer systems that cannot be evaluated by analytical methods.

