


 nueva página del texto (beta)
 Inglés (pdf)
 Artículo en XML
 Referencias del artículo
 Enviar artículo por email
 Citado por SciELO
  Similares en
SciELO
Similares en
SciELO 
 Permalink
Introduction
The study of the remanent magnetism recorded in rocks is the basis for constraining important problems in plate tectonics and paleogeographic reconstructions at different time scales. Paleomagnetic poles are often used to determine past location of continents. Reliable reconstructions of geological terrains cannot be obtained from poorly defined paleomagnetic poles, no matter how many sites are used. Precisely defined reference paleopoles (Besse and Courtillot, 2002) are crucial to produce robust paleocontinental reconstructions.
The Parana Magmatic Province and surrounding volcanic areas, including the Ponta Grossa Dikes have been subject of many paleomagnetic studies (Ernesto et al ., 1990, 1996, 1999; Raposo et al ., 1995; Raposo et al ., 1998; Alva-Valdívia et al ., 2003; Mena et al ., 2006). However, the paleomagnetic pole positions obtained in these studies present unusually high dispersion, which probably do not reflect the true characteristics of the Earth's magnetic field for the time interval of ∼140-120 Ma. As discussed by Alva-Valdivia et al . (2003), the apparent high scatter in paleomagnetic pole positions may be due to unrecognized tectonic disturbances (see also Ernesto et al ., 1990).
On other hand, the fine scale characteristics of the geomagnetic field during the Cretaceous is of great interest in understanding the long-term evolution of the geomagnetic field, related to the constant polarity superchron, the polarity reversal frequency patterns and paleosecular variation. The fluctuation of earth's magnetic field elements is closely connected to conditions in the Earth's liquid core and at the core-mantle boundary. Paleomagnetic data provide an invaluable source of information on the Earth's liquid core and deep interior.
There are two clear intervals in the geological past when the Earth's magnetic field remained with constant polarity for a considerable length of time: from about 125 to 84 Ma the polarity was normal (so-called the Cretaceous Normal Superchron-CNS) and from about 310 to 260 Ma the polarity was reversed (so-called the Permo-Carboniferous Superchron-PCRS). During the last decades, many investigations were devoted to study the morphology of the earth's magnetic field during the Cretaceous (Biggin et al ., 2008). Namely, most important question is related to the variability during and around the CNS. The particularity of this interval (125 to 84 Ma after Cande and Kent, 1995 and Tarduno et al ., 2002) is that Earth's magnetic field did not reverse polarity. Knowledge of the geomagnetic field behaviour just prior to CNS is patchy and largely unknown. Thus, more accurate paleomagnetic studies giving information about the past behavior of the geomagnetic field are strongly needed.
High quality paleomagnetic reference poles are required to distinguish true polar wander effects from relative hotspot motion, and to constrain major geodynamic events (Torsvik et al ., 2002; Somoza and Zaffarana, 2008). Major tectonic events characterize the mid-and late Cretaceous, with the final stages of Gondwana breakup, volcanic plateau emplacement and fast seafloor spreading rates (e.g., Taylor, 2006; Seton et al ., 2009).
The present study is aimed to determine precise Early Cretaceous paleomagnetic pole positions for stable South America, and contribute to the study of the fluctuations of the Earth¿s magnetic field just prior to the Cretaceous Normal Superchron. A preliminary paleointensity study was already reported from the Ponta Grossa dikes, analyzing 3 sites with 11 samples (Cejudo et al ., 2009). The present study expands on the initial reconnaissance study, based on 335 standard paleomagnetic cores belonging to 29 dikes.
Geological Setting and Sampling
The Parana-Etendeka area represents one of the largest known continental flood basaltic provinces. It is constituted of volcanic and sub-volcanic rocks, with the majority being tholeitic basalts and andesites with subordinate rhyolites, covering an area of around 1.2 × 10⁶ km2 in southern Brazil (mainly), northern Argentina, Uruguay and Paraguay. Based on available radiometric data, it appears that these huge magmatic eruptions occurred between 133 and 132 Ma (Renne et al ., 1992, 1996).
Intra-continental volcanism that crop outs around the basaltic traps at the present time is younger, and comprises basaltic and andesitic dikes. The most important mafic dike swarms in Brazil occur in the Ponta Grossa (PG) region (Figure 1) and are associated with the flood basalt suites of the Paraná basin (Piccirillo et al ., 1990; Brandt et al ., 2010). The region is cut by hundred of dikes, predominantly basaltic and andesitic composition. There is now a general agreement that PG dikes were probably feeders of the stratovolcanoes built in northern Paraná (Sial et al ., 1987). Renne et al . (1996) reported a comprehensive geochronological study provided numerous 40Ar/39Ar high quality plateau ages. The age-probability distribution for the dominant pulse (131.4 ± 0.4 to 129.2 ± 0.4 Ma) shows a pronounced peak at 130.5 Ma. Thus, Ponta Grossa dikes are younger than the southern Paraná Magmatic Province lavas, which occurred at 133-132 Ma (Renne et al. , 1996).
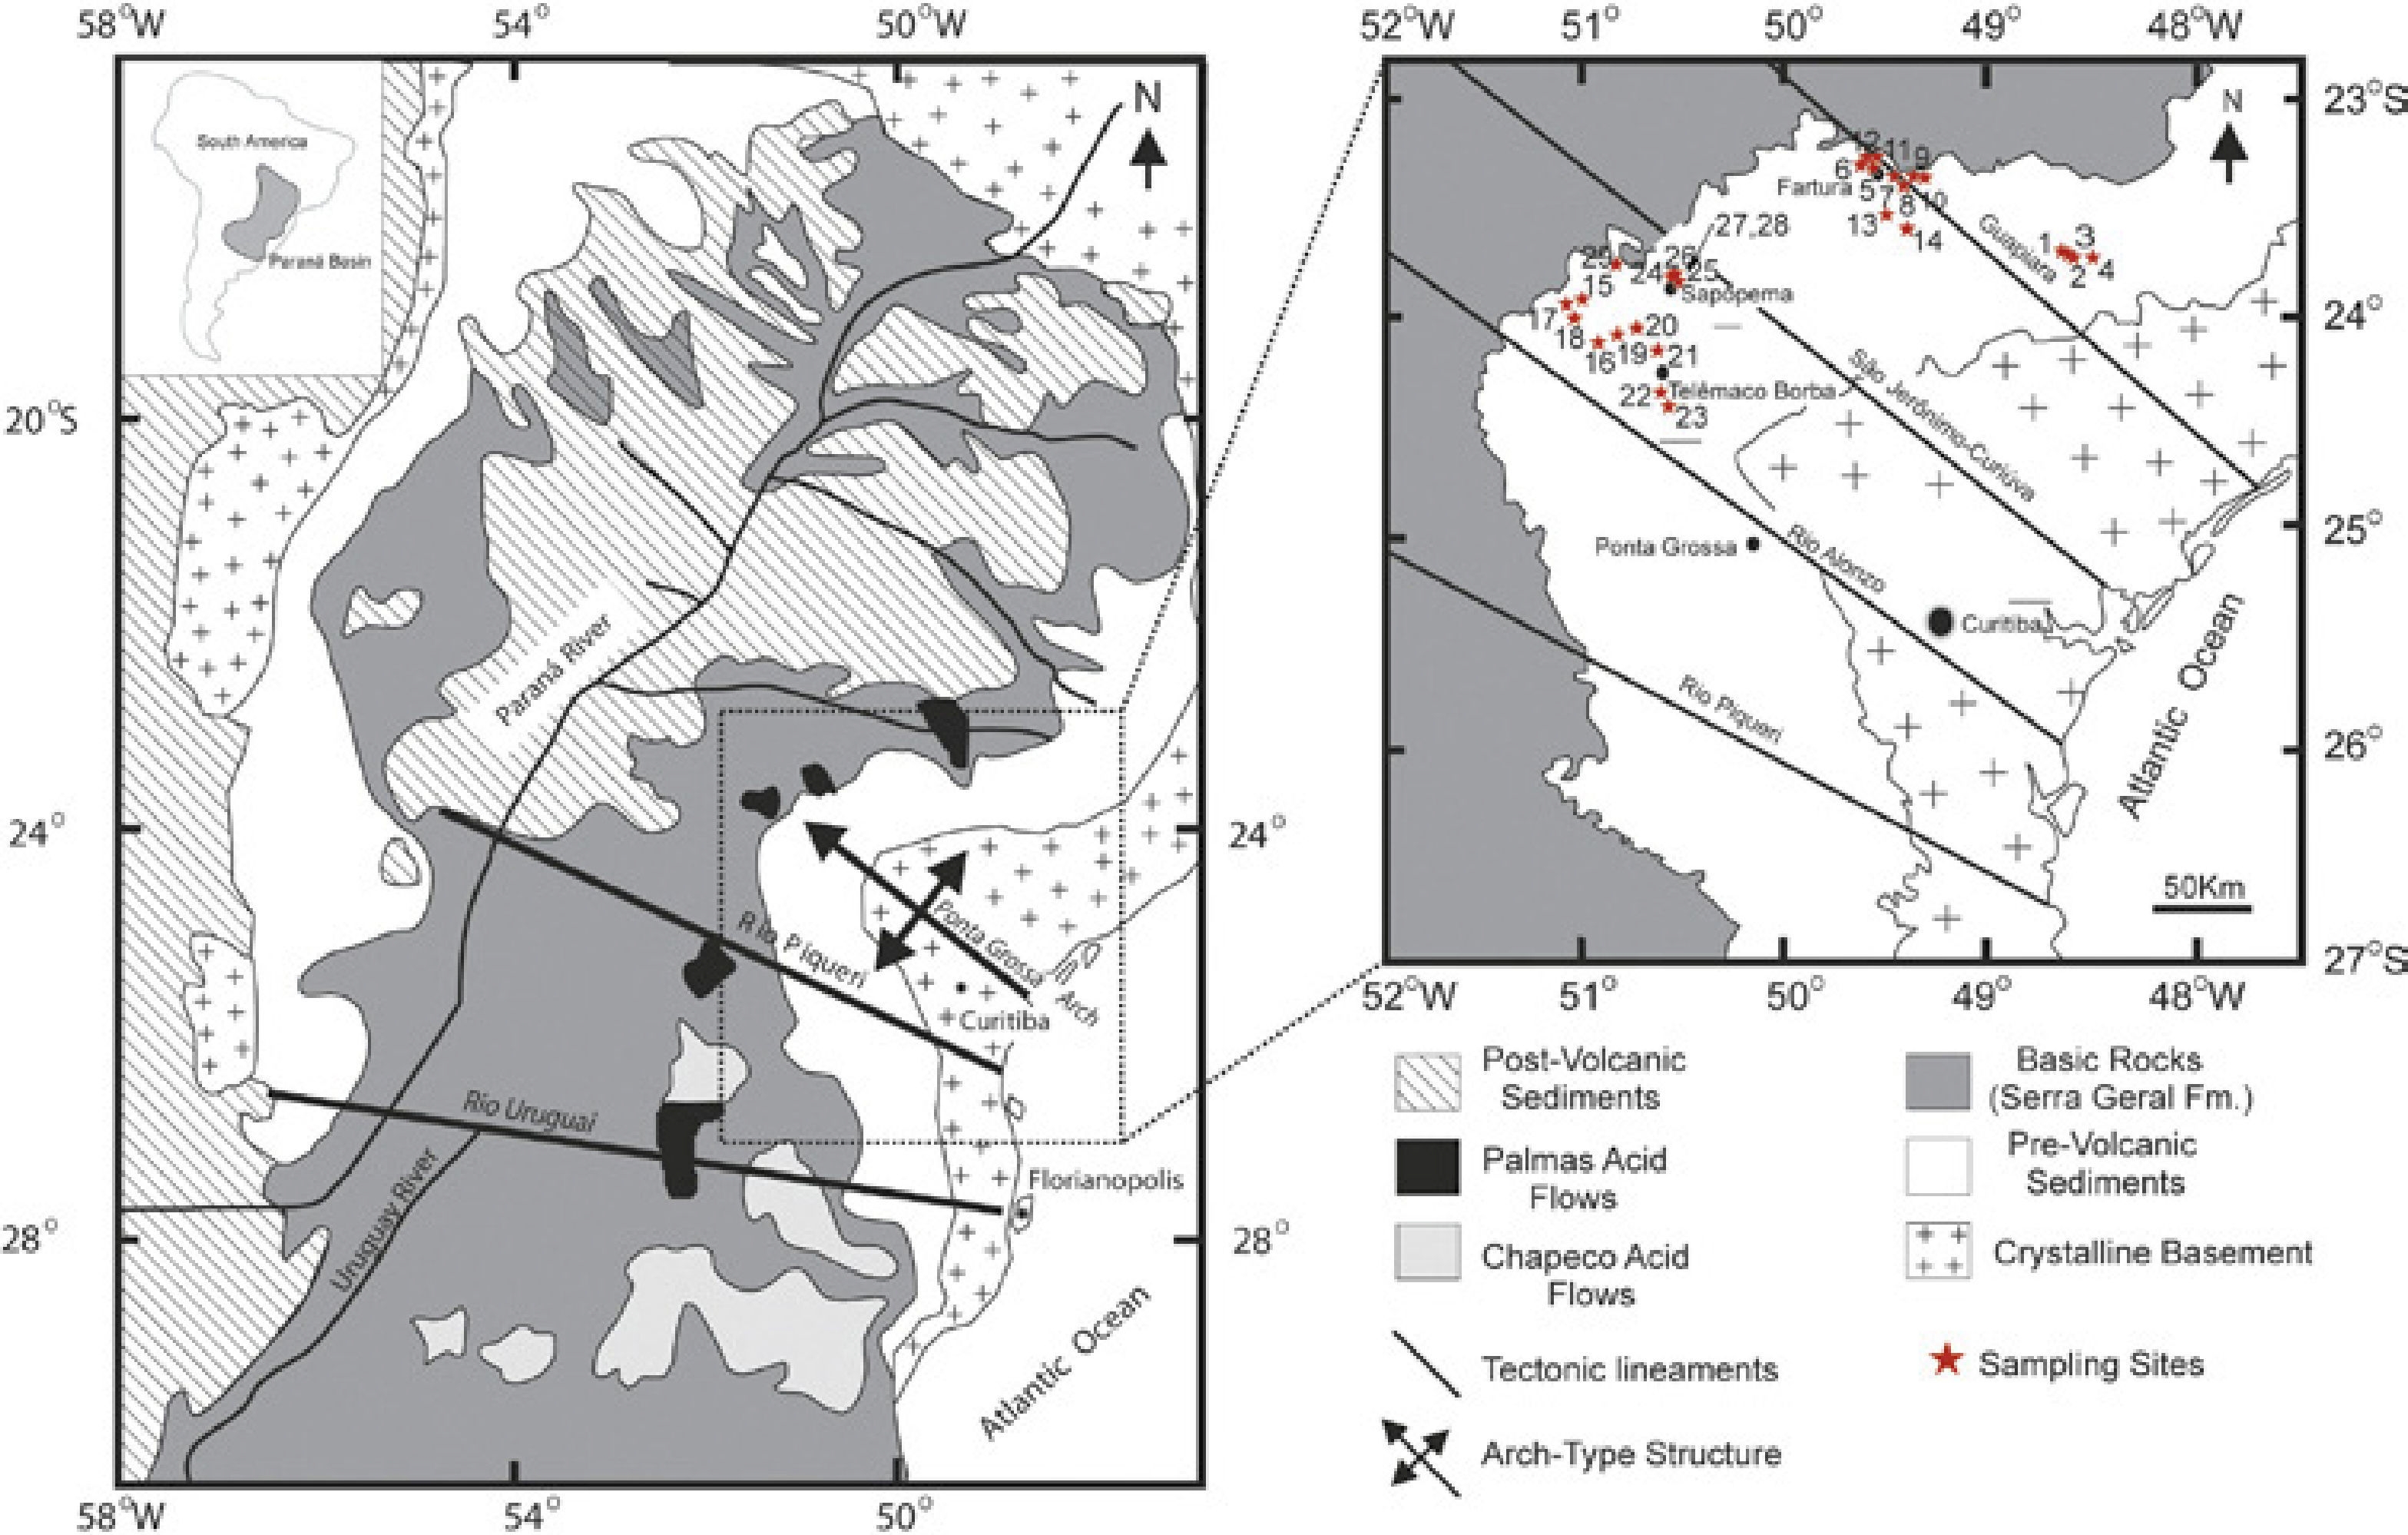
Figure 1 Simplified geologic map of Southern Brazil showing the location of studied sites (adopted from Brandt et al., 2009 and Cejudo et al., 2009).
We obtained 235 standard paleomagnetic cores belonging to 29 sites distributed along road outcrops in Ponta Grossa region, Southern Brazil (Figure 1). The samples were distributed throughout each dike both horizontally and vertically. In general, samples were obtained at least 30 cm distance from the dike edge (when possible). Cores were obtained with a gasoline-powered portable drill, and then oriented in most cases with both magnetic and sun compasses.
Laboratory Procedures
Magnetic experiments were carried out to find out the carriers of remanent magnetization, to estimate their domains states and grain sizes and to obtain information about their paleomagnetic stability. From each of the 29 studied dikes, one sample was selected for these experiments, which included the measurement of low-field susceptibility versus temperature (k-T) curves, the determination of hysteresis parameters and the measurement of isothermal remanent magnetization (IRM) acquisition curves. All hysteresis measurements were carried out with the AGFM-Micromag apparatus, while continuous thermomagnetic curves were obtained using Bartington susceptibility bridge equipped with furnace.
Thermomagnetic curves were measured in air, heating the samples up to 600 °C and cooling them down to room temperature. Curie points (T) were determined using the Prevot (1983)'s method. The most representative behaviour is reported on Figure 2a. It displays irreversible curves with a single ferromagnetic phase with a high Curie temperature near 550 °C, which corresponds to low-Ti titanomagnetite or slightly Alor Mg-substituted magnetite. We considered a curve to be reversible if the difference between initial magnetization before heating had started and final magnetization after cooling had been completed was less than ±10%.
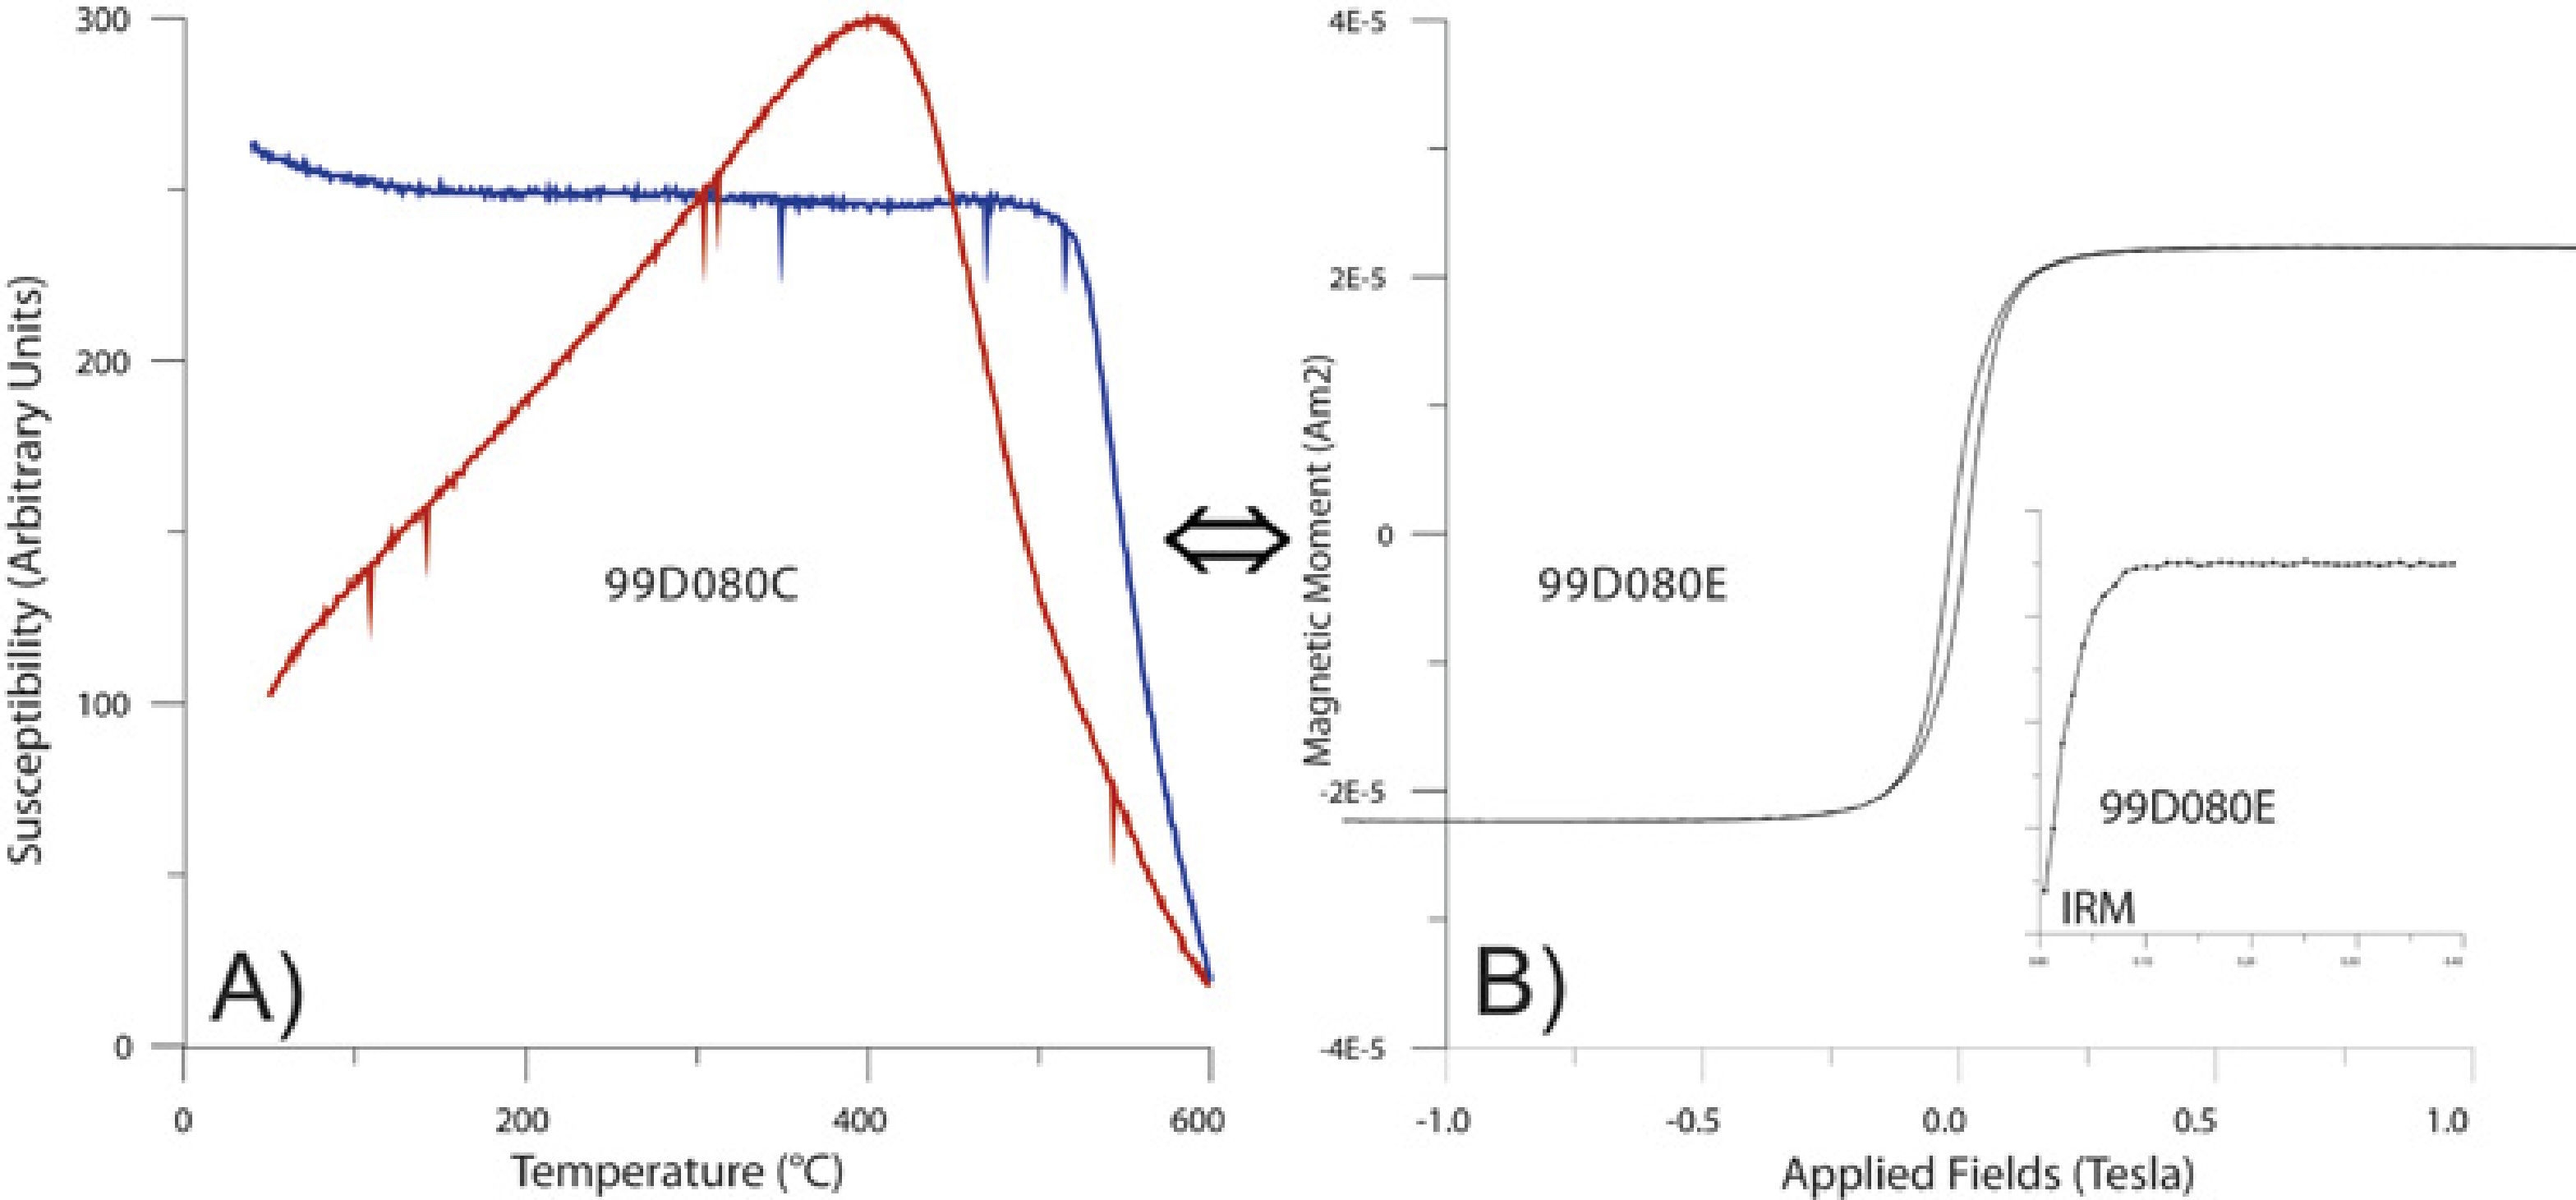
Figure 2 a) Susceptibility versus temperature (in air) curve of representative samples. b) Typical examples of hysteresis loop (corrected for dia/paramagnetism) of small chip samples from the studied volcanic units and associated IRM (isothermal remanent magnetization) curve.
Hysteresis parameters J (saturation magnetization), J (saturation remanence), H (coercivity) and H (coercivity of remanence) were obtained from hysteresis (Figure 2b) and backfield curves. Analysis of the measurements was performed with the RockMagAnalyzer 1.0 software (Leonhardt, 2006). The obtained values point that studied samples can be match to the PSD (pseudo-single-domain) magnetic grains. This behavior might be also explained by a mixture of single-domain (SD) and multi-domain (MD) particles (Dunlop, 2002). IRM acquisition curves (Figure 2b) show that more than 95% of saturation magnetization (SIRM) was reached with applied fields of less than 150 mT. Thus IRM measurements point to low-coercivity phases as main remanence carriers.
Remanent magnetization measurements were performed at the 'Laboratorio Interinstitucional de Magnetismo Natural' in Campus Morelia (UNAM) with a spinner JR6 (nominal sensitivity ∼10-9 Am2) magnetometer. Most of samples were cleaned by means of alternating field demagnetization using a LDA-3 demagnetizer, with 95 mT as maximum fields available. Eleven sites displayed a single paleomagnetic component (Figure 3, samples 99D015A), whereas in the remaining ones a viscous present-day normal-polarity overprint could also be observed that was easily removed (sample 99D010B). Some dikes however yielded relatively strong secondary components (sample 99D115A), which were removed after applying around 60 mT alternating fields. The origin of this overprint is probably related to hydrothermal alteration.
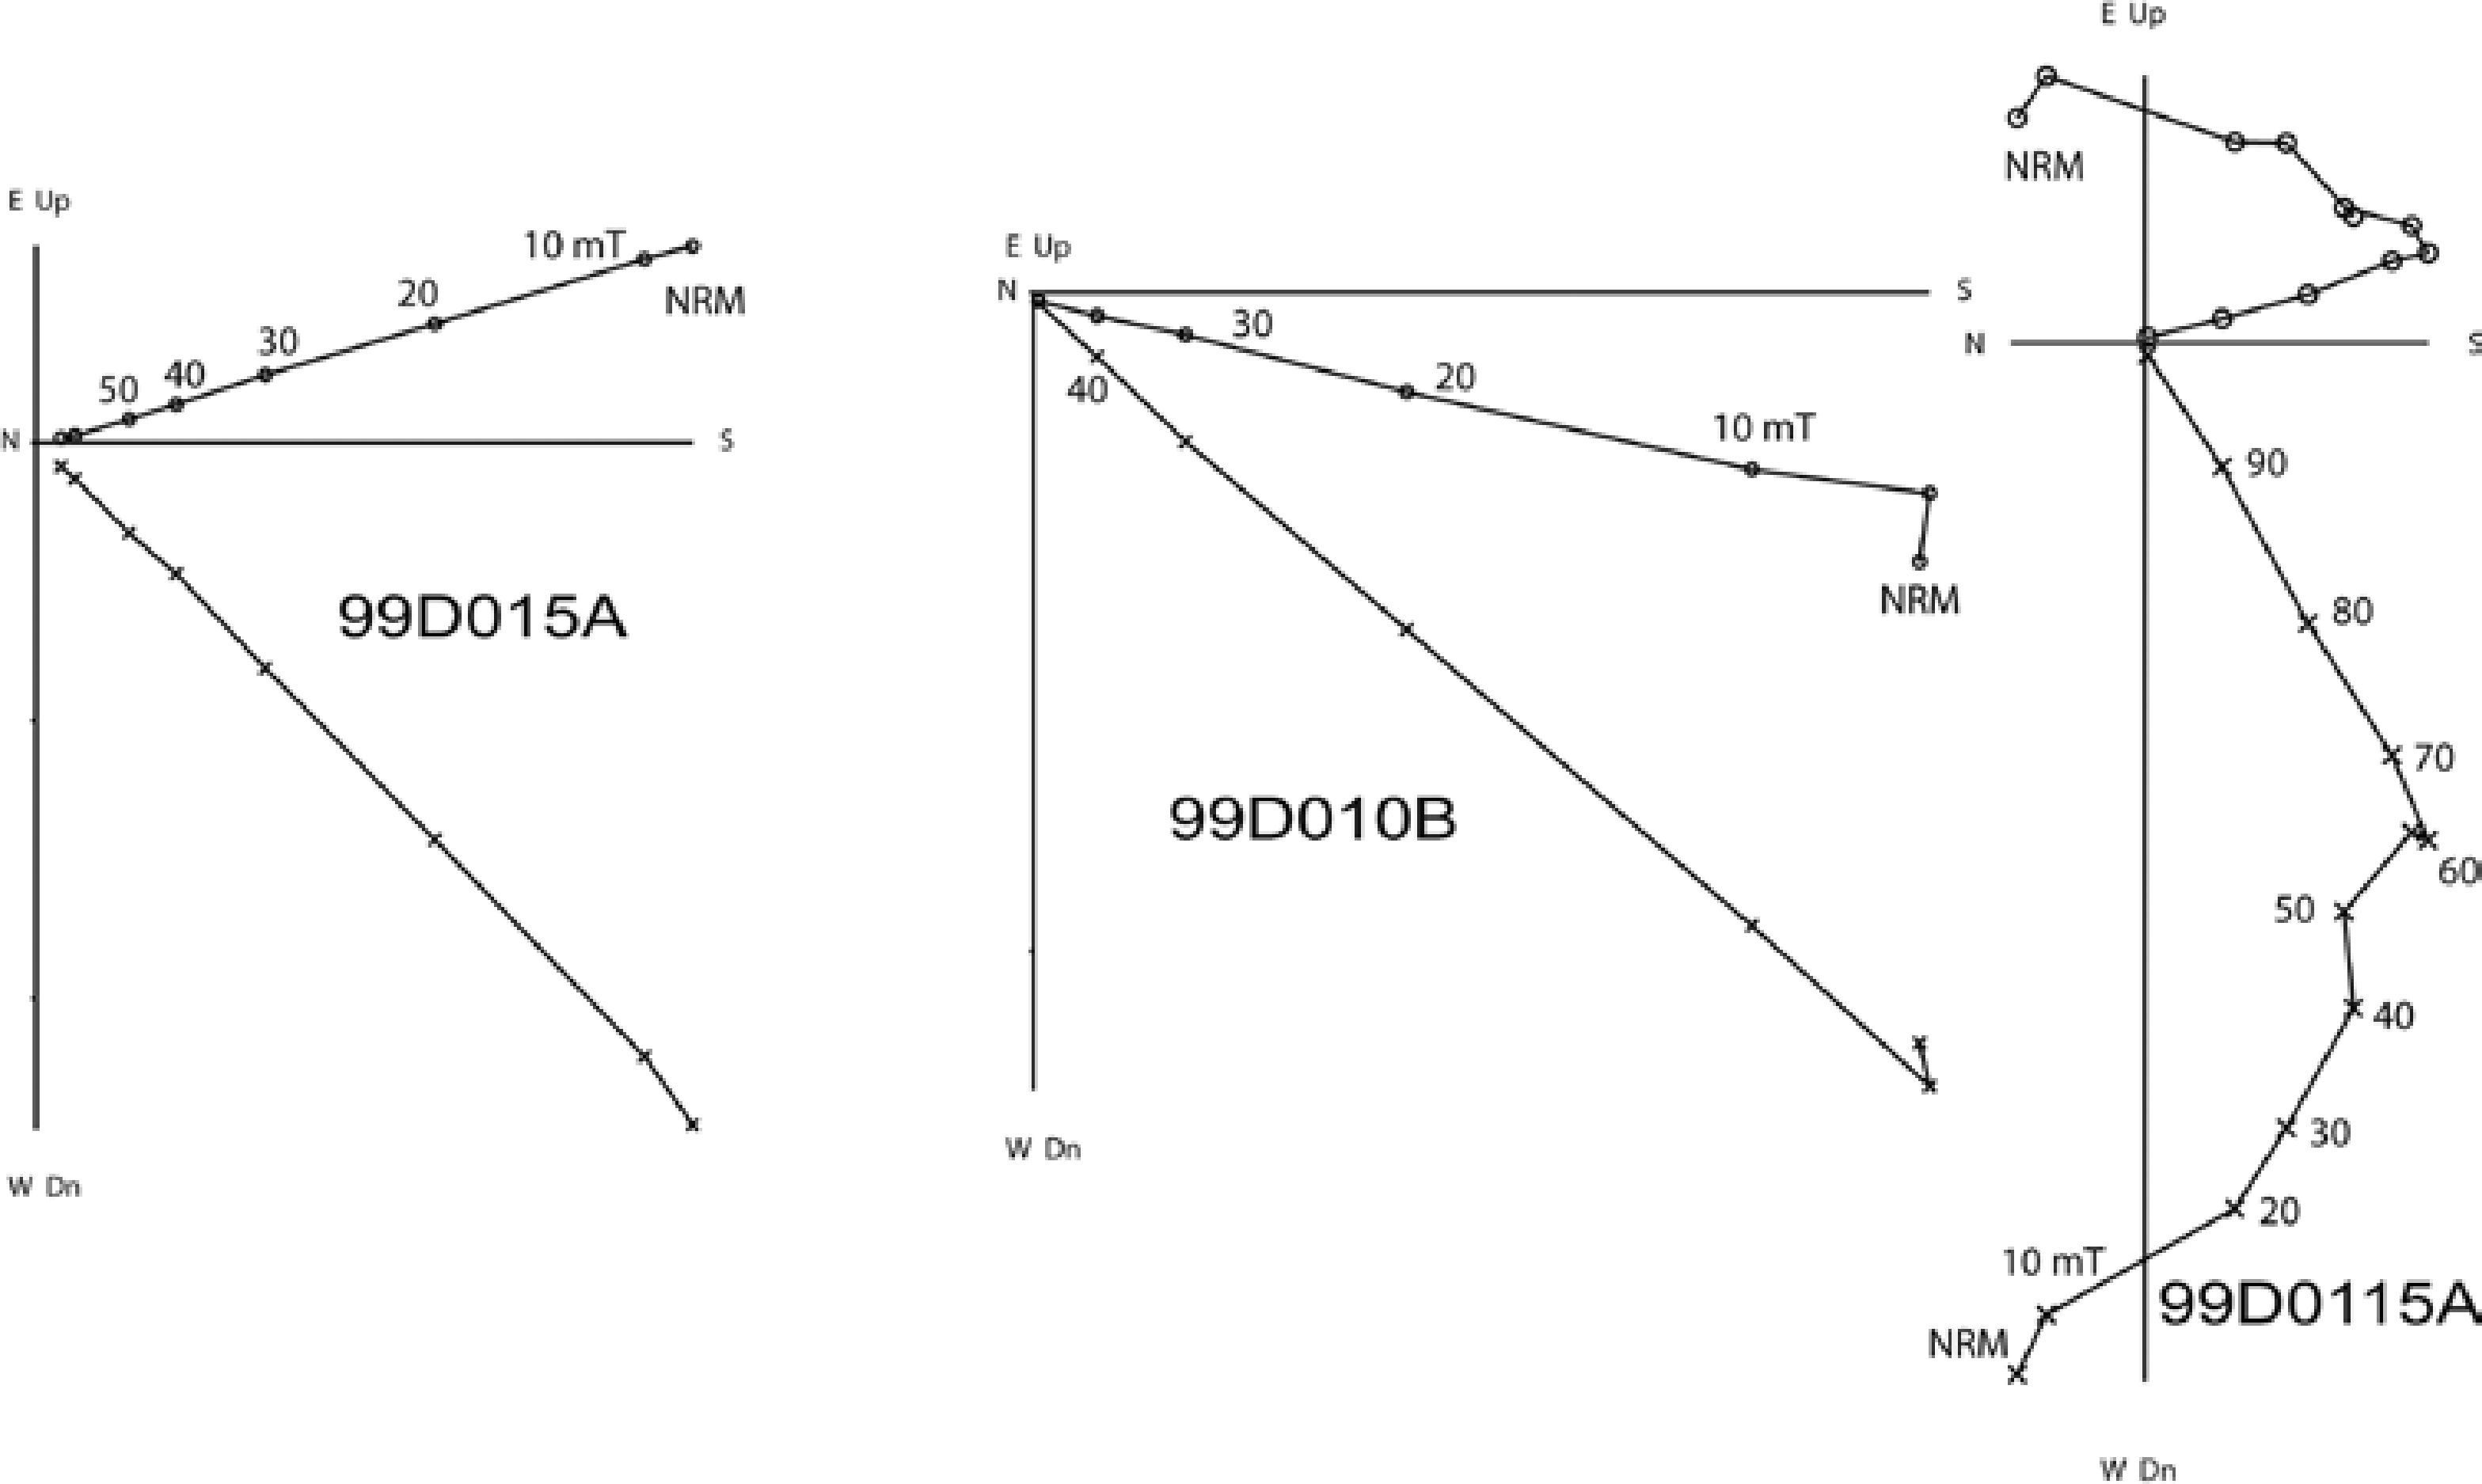
Figure 3 Orthogonal vector plots of stepwise alternative field demagnetization of three representative specimens.
Table 1 Paleomagnetic results of studied samples. D, I : declination and inclination of the site mean directions; N is number of specimens used; k and a95 are Fisherian statistical parameters; VGP Long, VGP Lat : longitude and latitude of the virtual geomagnetic poles.
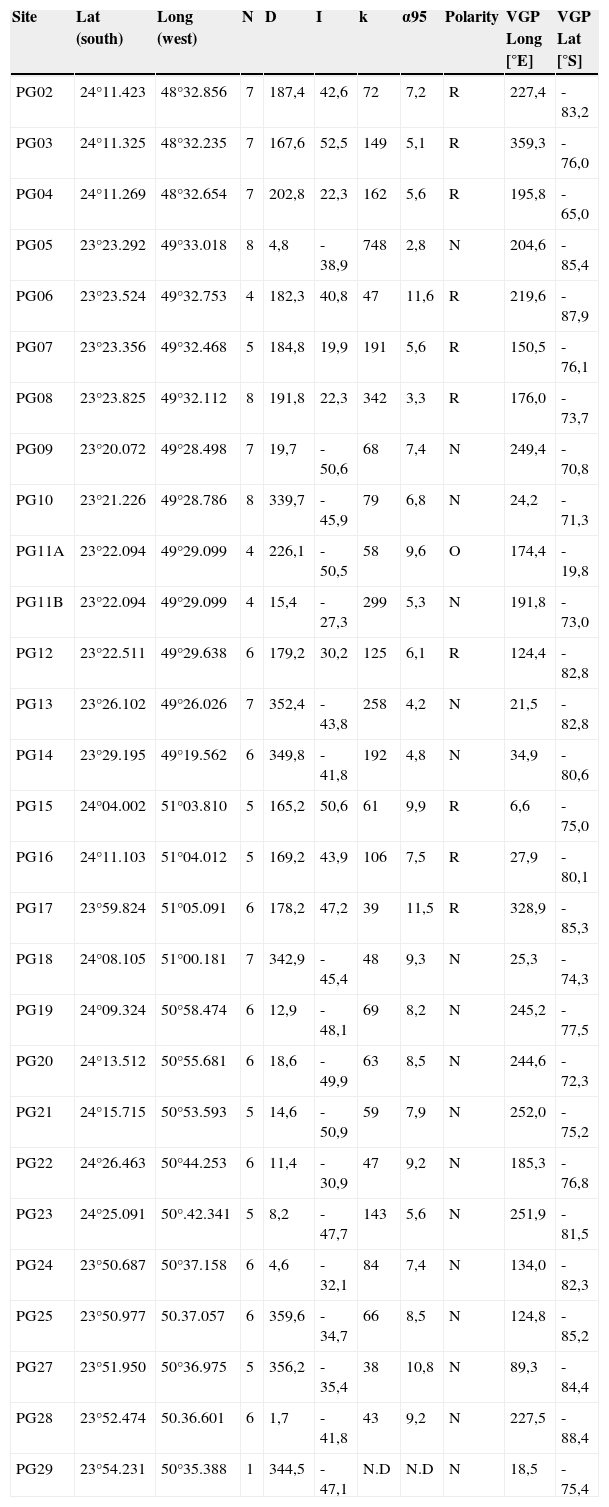
The direction of the characteristic magnetization (ChRM) was determined by the least squares method (Kirschvink, 1980), with 4 to 9 points being taken for the principal component analysis. The directions obtained were averaged by volcanic unit and the statistical parameters calculated assuming a Fisherian distribution.
Main Results and Discussion
17 sites show normal polarity remanences, 10 sites show reverse polarities and one site have an outlier oblique direction, with negative inclination, separated 79° of the mean normal direction (calculated before exclude it; Figure 4). The mean paleomagnetic direction for the normal polarity sites is I = -42.6°, D = 2.2°, k = 46.9, a =5.3°, N = 17 (k is precision parameter and N number of sites), while reversely magnetized sites give a mean direction with I = 37.8°, D = 182.2°, k = 27.62, a95 =9.3°, N =10. The reversal test as defined by McFadden and Lowes (1981) is accepted at the 95% confidence level and the reversal test from McFadden and McElhinny (1990) is positive with classification B (gc = 9.58°; go = 4.8°). This ensures that the secondary remanent magnetizations were successfully removed and the sampling adequately averaged the palaeosecular variation.
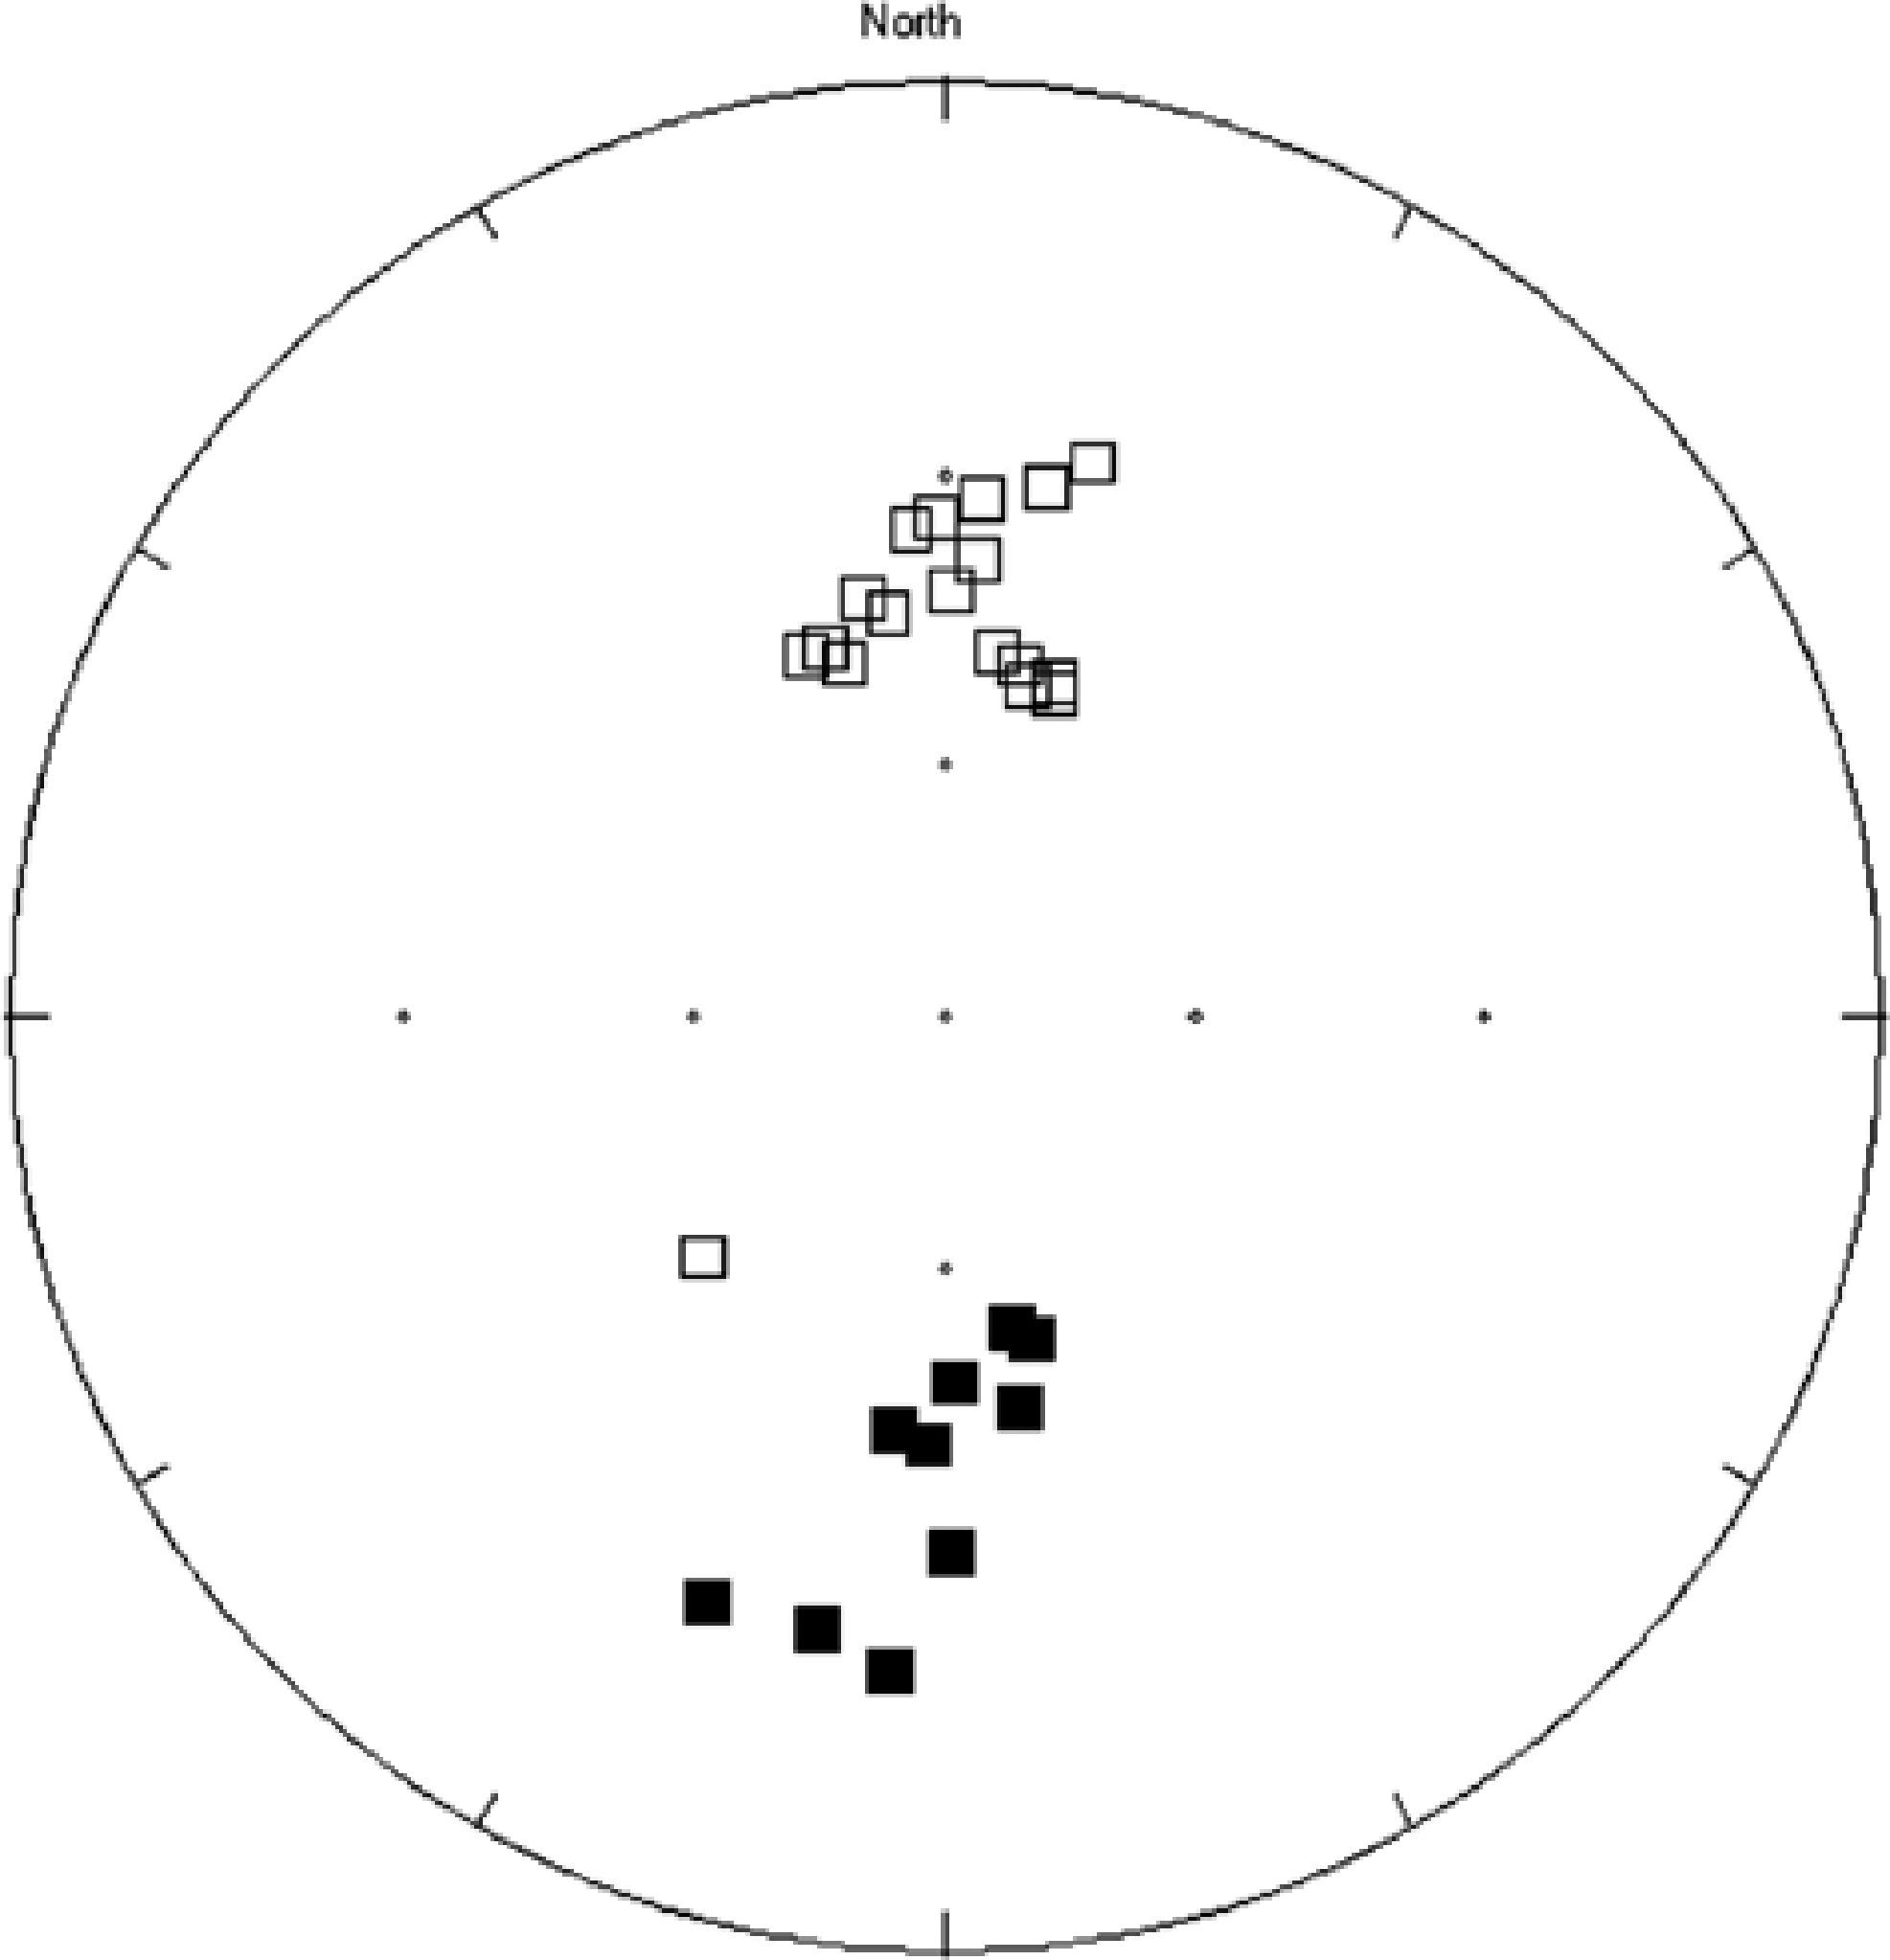
Figure 4 Stereoplot for site mean paleodirections corresponding to all 28 sites where reliable results are obtained.
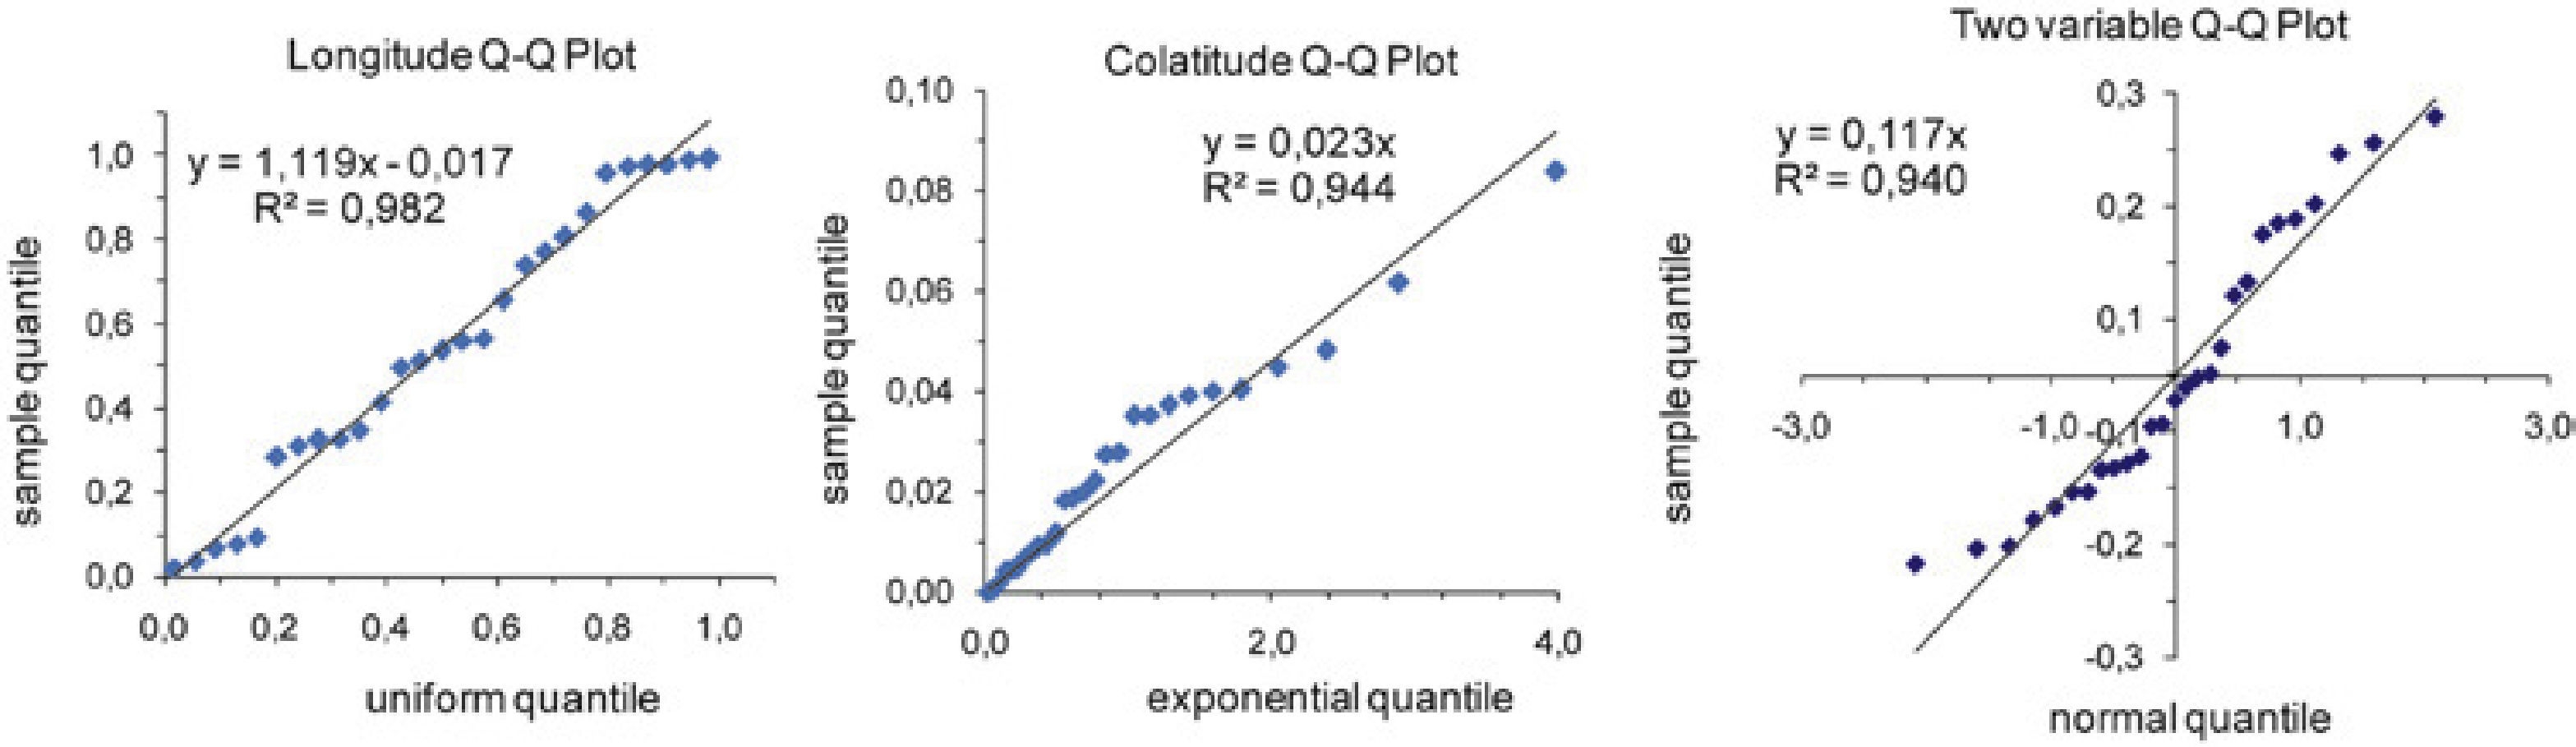
For both sets, the quantil-quantil (Q-Q) plot for declinations using the uniform model is approximately linear, passing through the origin with a slope near 45° (Figure 5). The Q-Q Co-Inclination plot with exponential model is also linear, with a slope that gives an estimated k = 58.82. The Q-Q plot for two variables is approximately linear, passing through the origin and with a slope that give an estimate k = 42.16. The three k estimate values are statistically undistinguishable at 95% level using an F-test. These graphical tests suggest that the underlying distributions are fisherian.
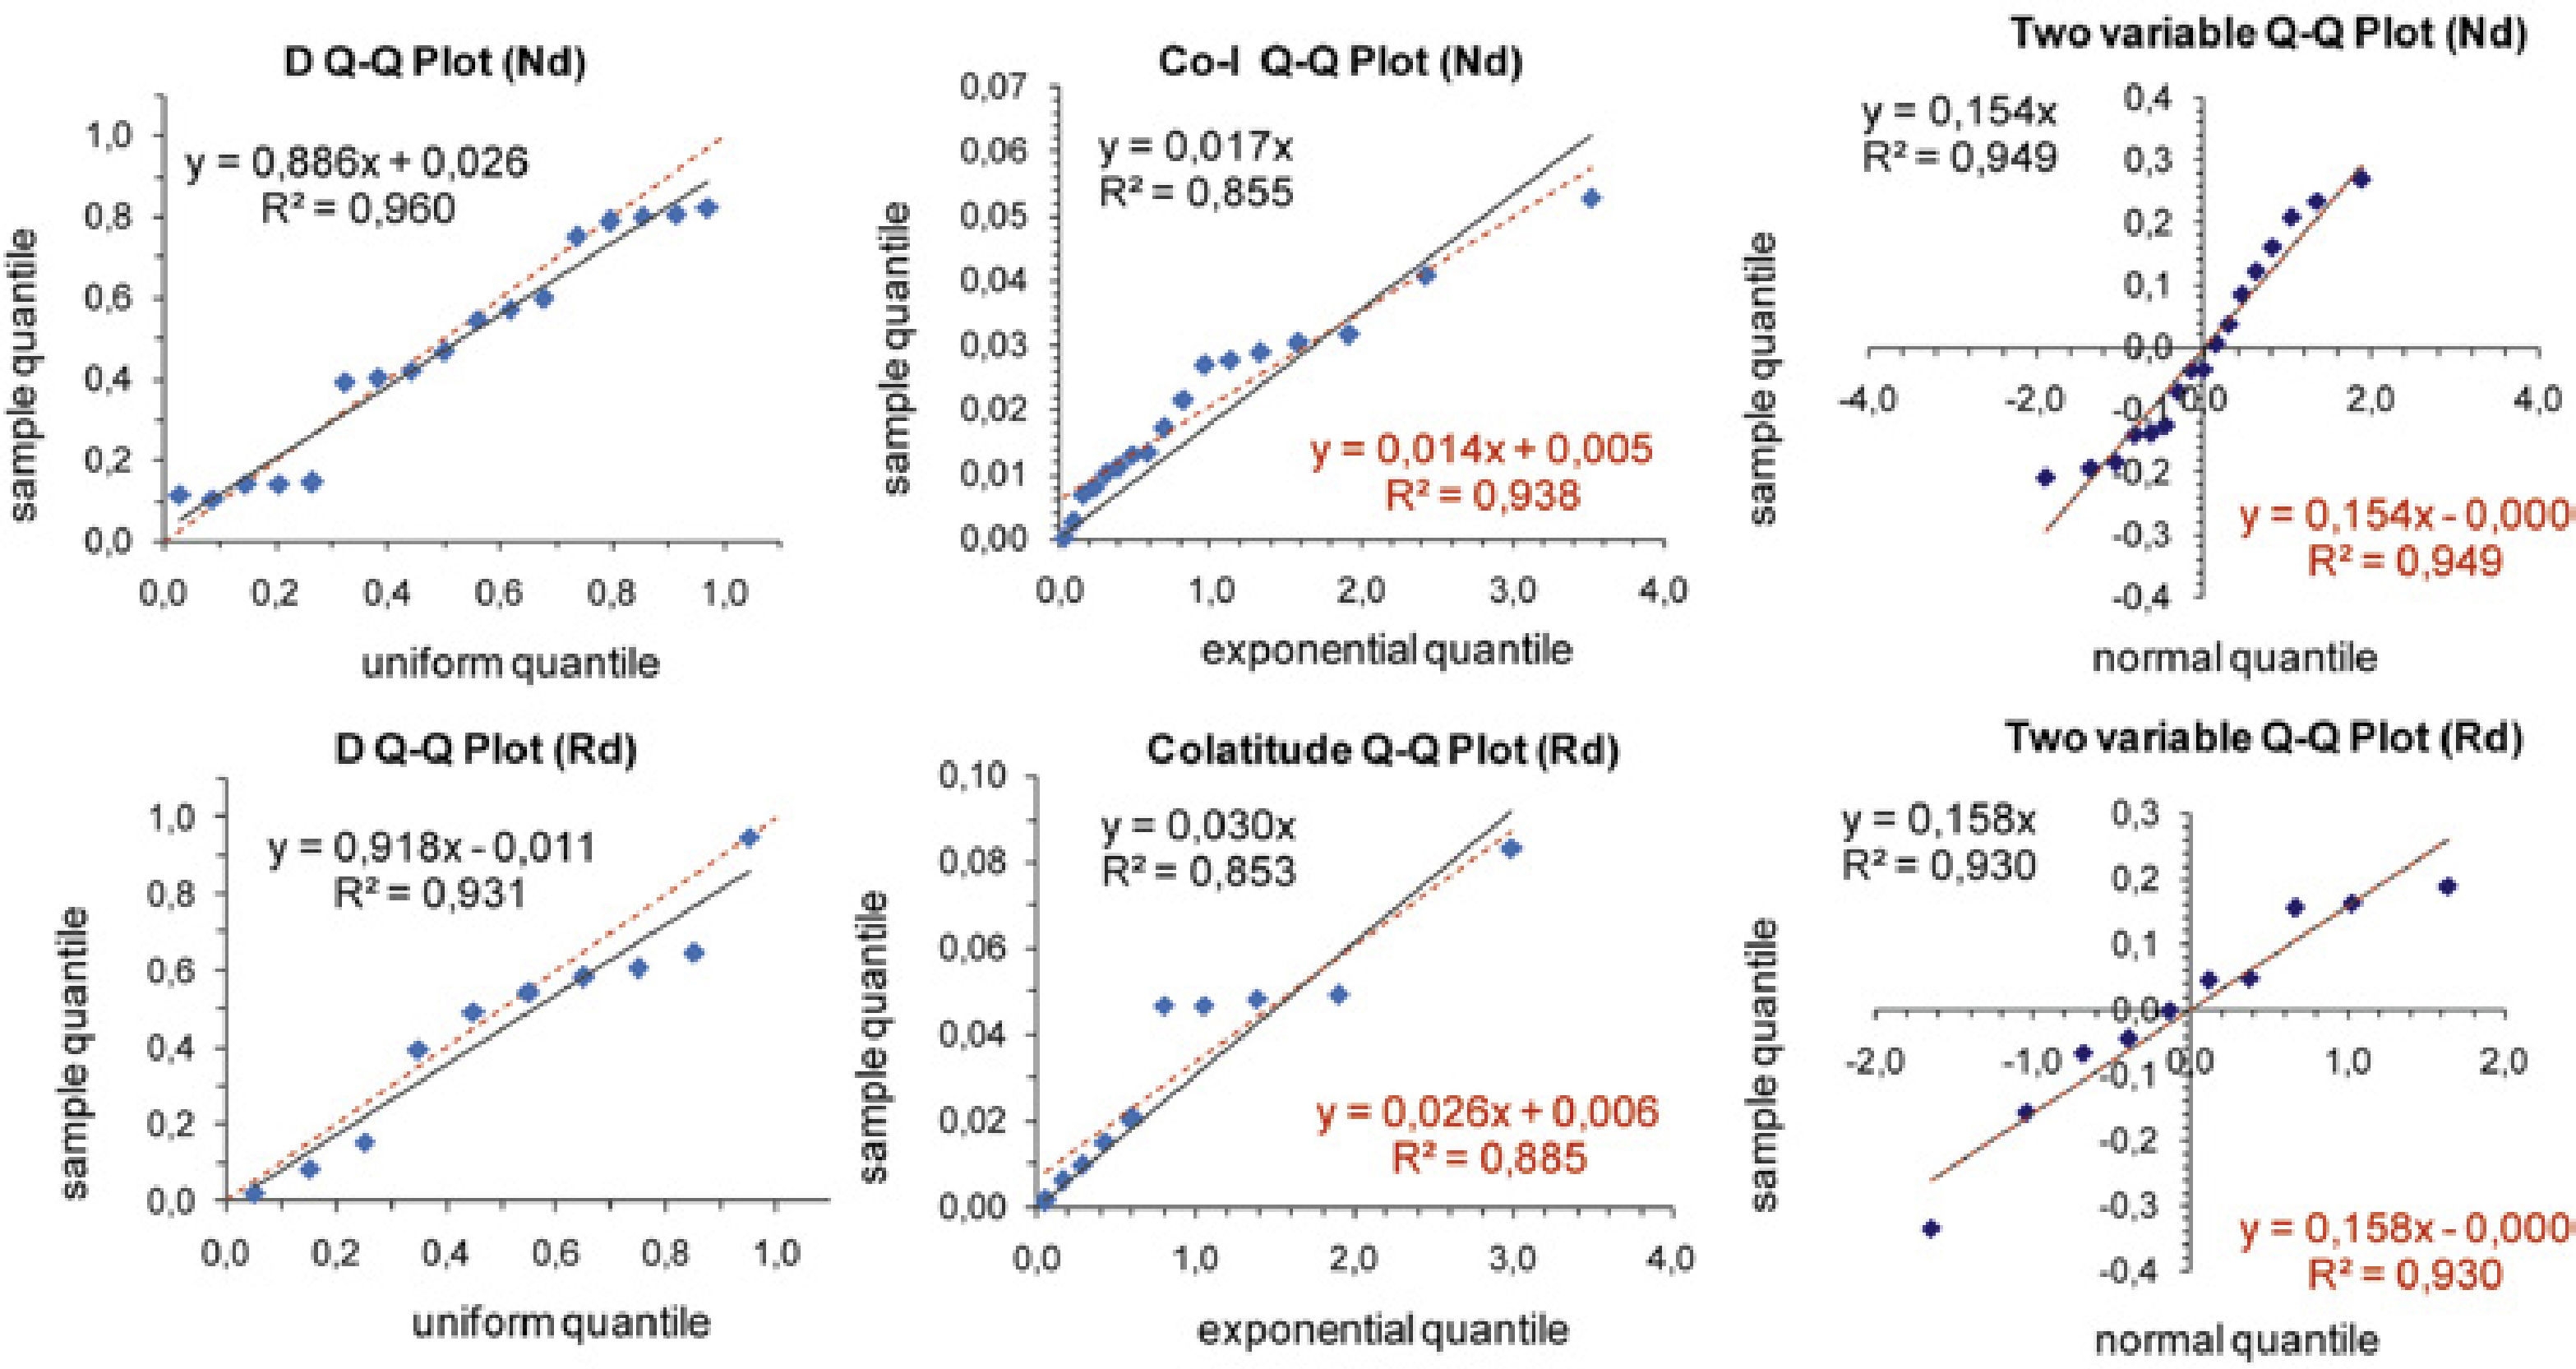
Figure 5 Probability plots for checking goodness of fit of the paleodirections to the Fisher distribution.
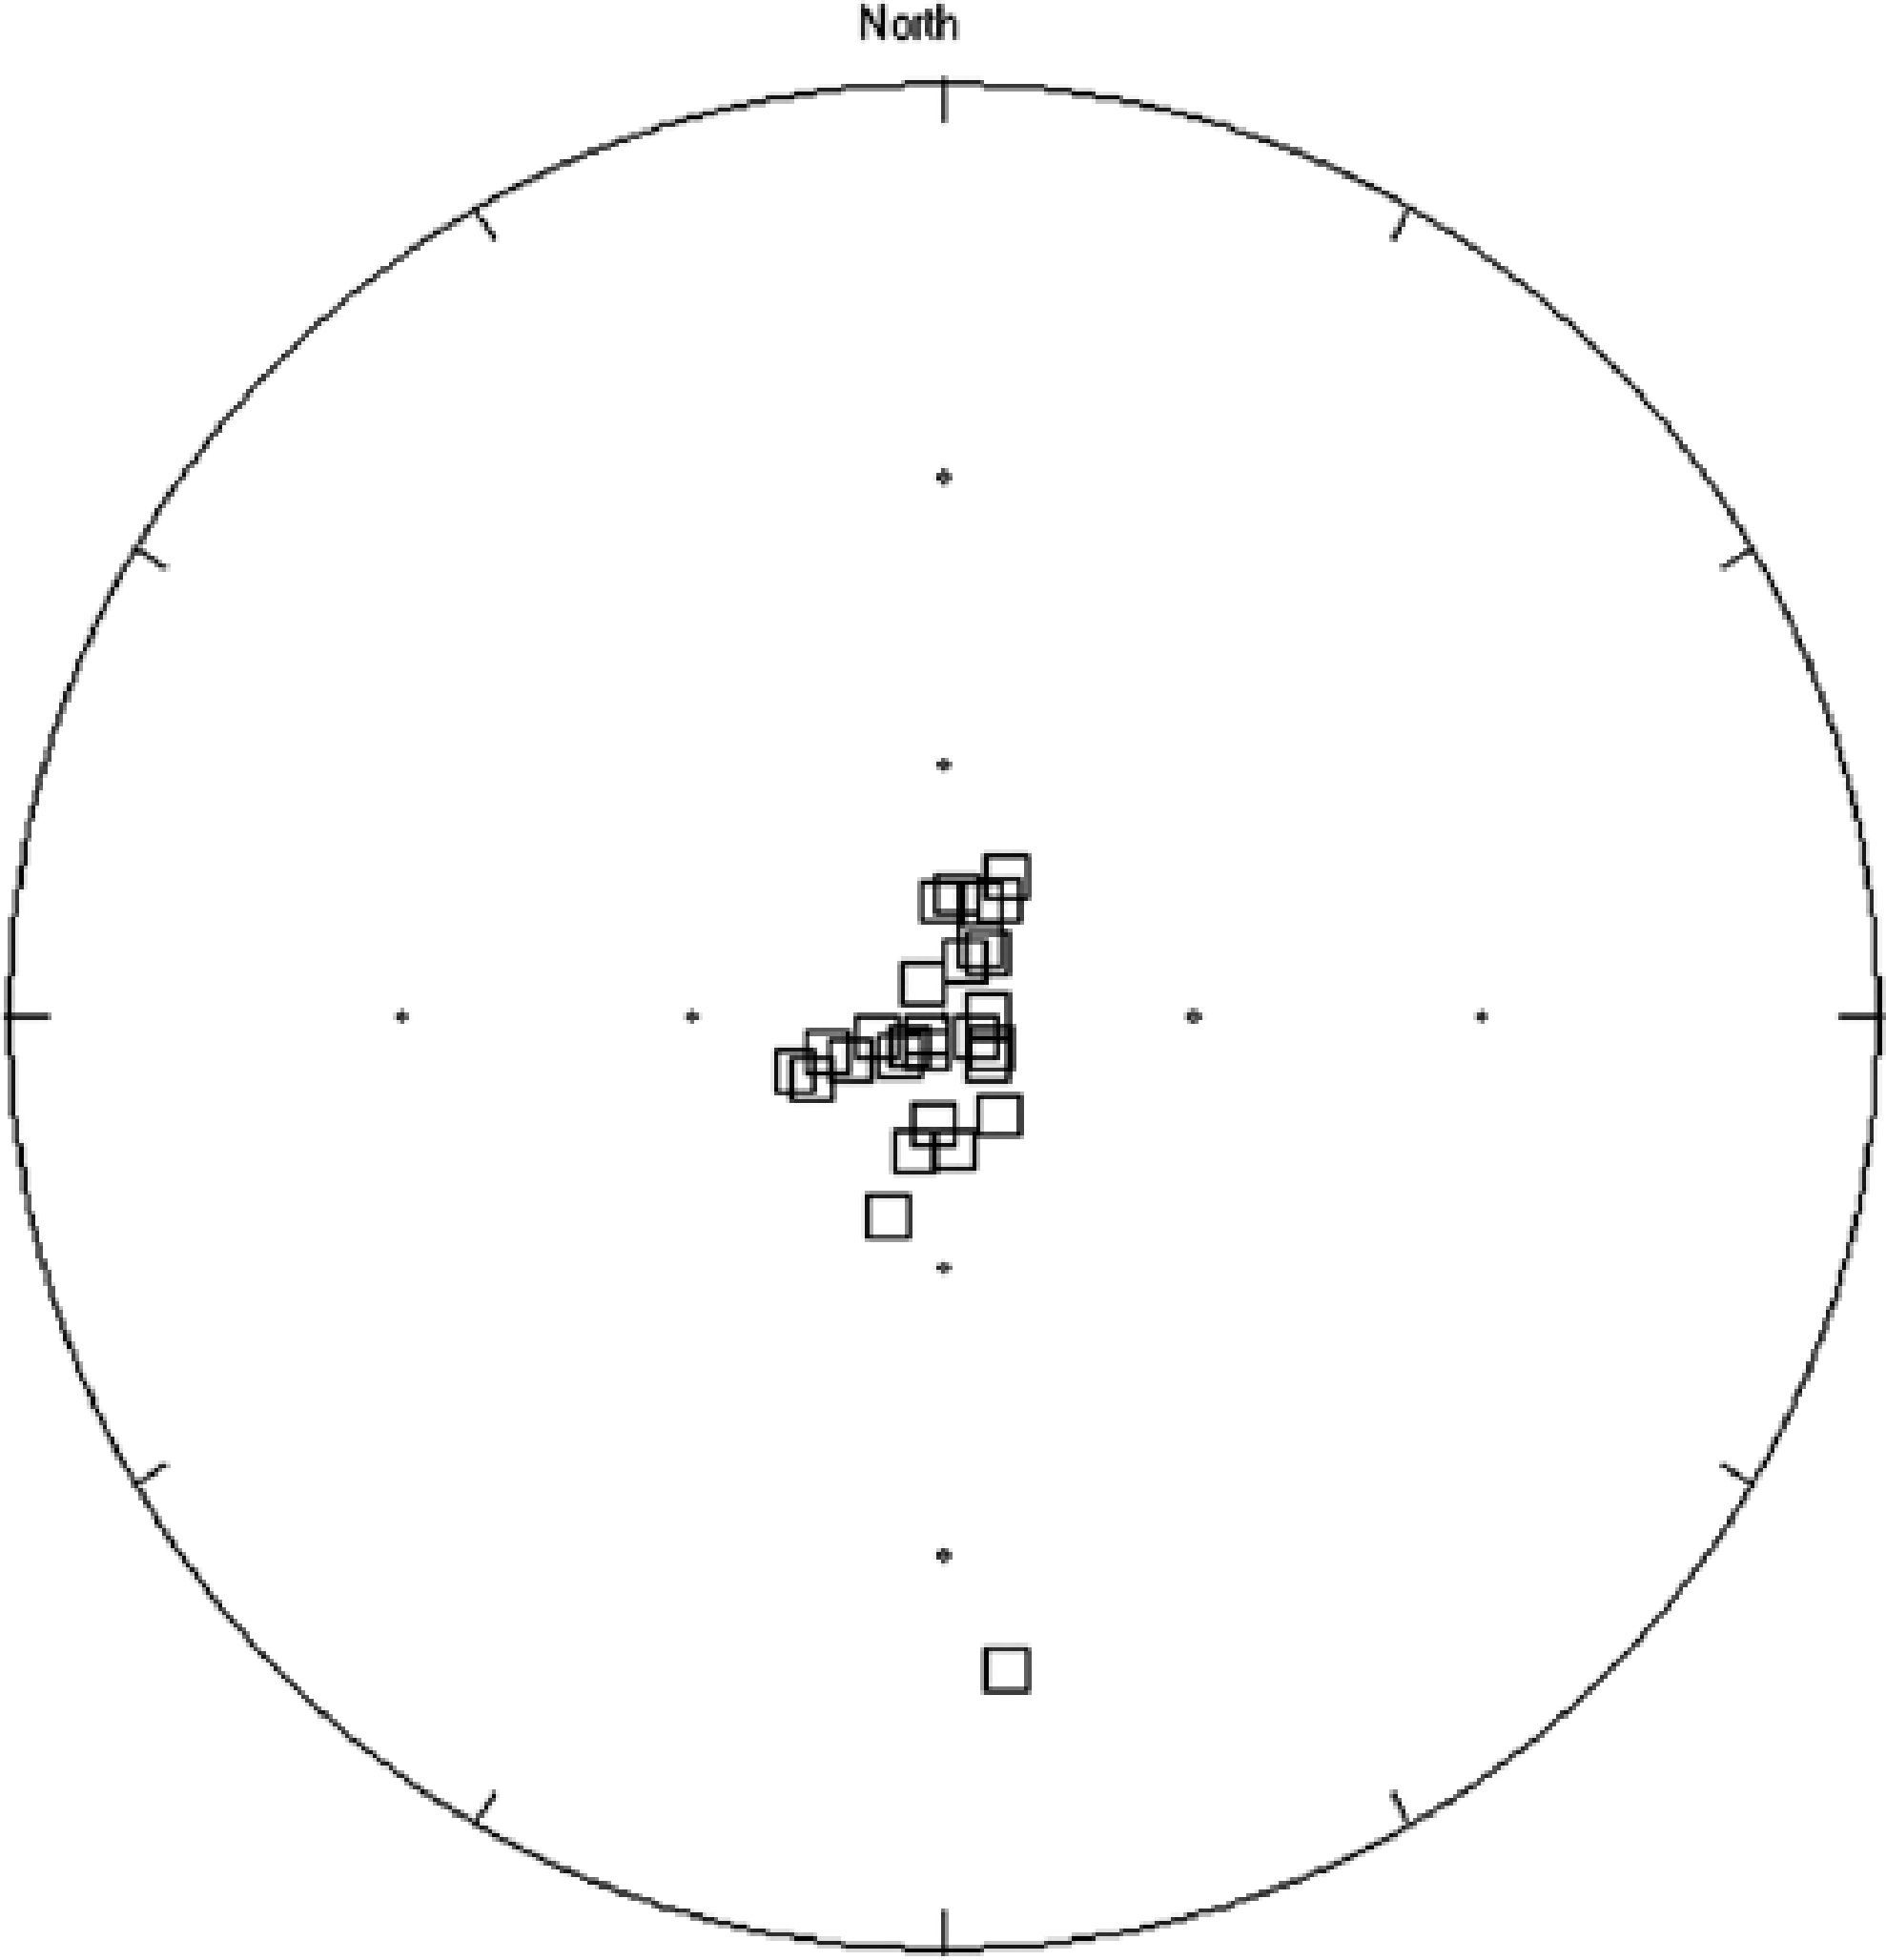
The distribution of the site-mean VGPs is somewhat elongated (Figure 6), with maximum elongation direction along the 24°-204° meridian. The eigenvalues of the VGP orientation matrix are t1 =25.714; t2 =0.987; t3 =0.299, then the elongation index is 3,3. Similar configuration was also found for coeval VGPs (Mena et al ., 2006, 2011). However, we consider the elongation not significant, since the VGP distribution yields a reasonably good fit with fisherian distribution when probability plots as well as formal testing procedures are used.
The VGPs quantil-quantil (Q-Q) plots are consistent with a fisherian distribution (Figure 7), with slopes that give estimated k = 43.5 from colatitudes and k = 73.1 from two variables. Using an F-test these values are statistically undistinguishable, at 95% confidence level, of the value k =39.6 estimate with the VGPs. Employing formal testing procedures, we obtain the following results for the modified statistics of Kolmogorov-Smirnov and Kuiper (Dn* , Vn*, MU (Vn ), ME (Dn ) and MN (Dn ); Fisher et al ., 1987): Longitude test: Dn *= 0.8677; Vn *= 1.2862; MU (Vn )=1.1780; colatitude test: Dn* =0.6381 ; Vn* = 1.0538; ME (Dn) =0,6162; Two-variable test: Dn* =0.7390; Vn* =1.3542; MN (Dn )= 0.7408. All values suggesting no departure from the Fisher model.
Considering the PGVs from sites with α95 <10° (excluding PG6, PG17 and PG27 and the oblique site PG11a) the paleomagnetic pole (PP) is located at 222.0° longitude E, 88.1° latitude S, N = 24, K = 35.68, A 95 = 5.0°. The inclusion of all sites into the mean calculation gives: 222.4° longitude E, 88.4° latitude S, N = 27, K = 39.61, A 95 = 4.5°, which is not significantly different.
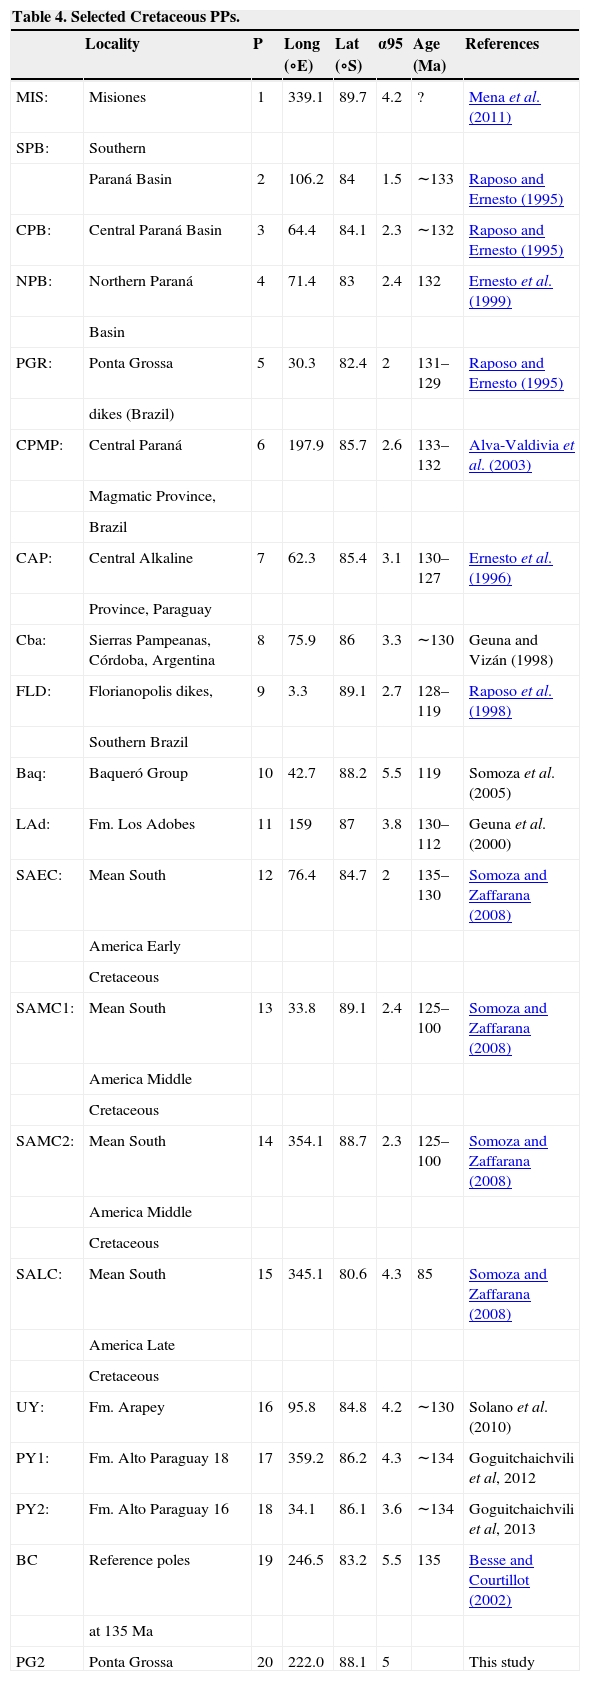
The mean paleomagnetic pole obtained in this study is shown in the present geographical reference frame in Figure 8 and listed in Table 2 together with previously published South American poles. In general, the pole obtained in this study, agrees reasonably well with other pole positions, in particular with Misiones (Argentina), Central Paraná Magmatic Province, Florianopolis Dikes (Brazil), Los Adobos (Geuna et al ., 2000) poles. However, some other similar age paleomagnetic poles (Central and Northern Paraná Bassin in Brazil and Arapey Formation in Uruguay) are clear outliers. As initially suggested by Ernesto et al . (1996) and recently confirmed by Goguitchaichvili et al . (2013), this may be due to some local tectonic rotations or insufficient sampling to average the paleosecular variation as well as to unrecognized structural disturbances. Overall, the Ponta Grossa poles are significantly different from the pole position estimated from the hotspot reconstruction (Muller et al ., 1993). This fact is attributed by several authors (i.e. Alva-Valdivia et al ., 2003, Cervantes et al ., 2010, Goguitchaichvili et al ., 2013) as cause of the true polar wander or hotspot motion. Somoza and Zaffarana (2008) analyzed the mid-Cretaceous poles for South America, concluding that there is no detectable motion with respect of the paleomagnetic axis for the interval 125 to 100 Ma. Somoza and Zaffrana (2008)'s study also shows that the corresponding paleolatitudes are inconsistent with true polar wander, supporting that the angular discrepancies between the paleomagnetic and fixed hotspot reference frames are due to relative motion of the Atlantic hotspots. The apparent polar standstill of South America has been documented for Eurasia and possibly for the Pacific plate during mid-Cretaceous times (Sager, 2006).
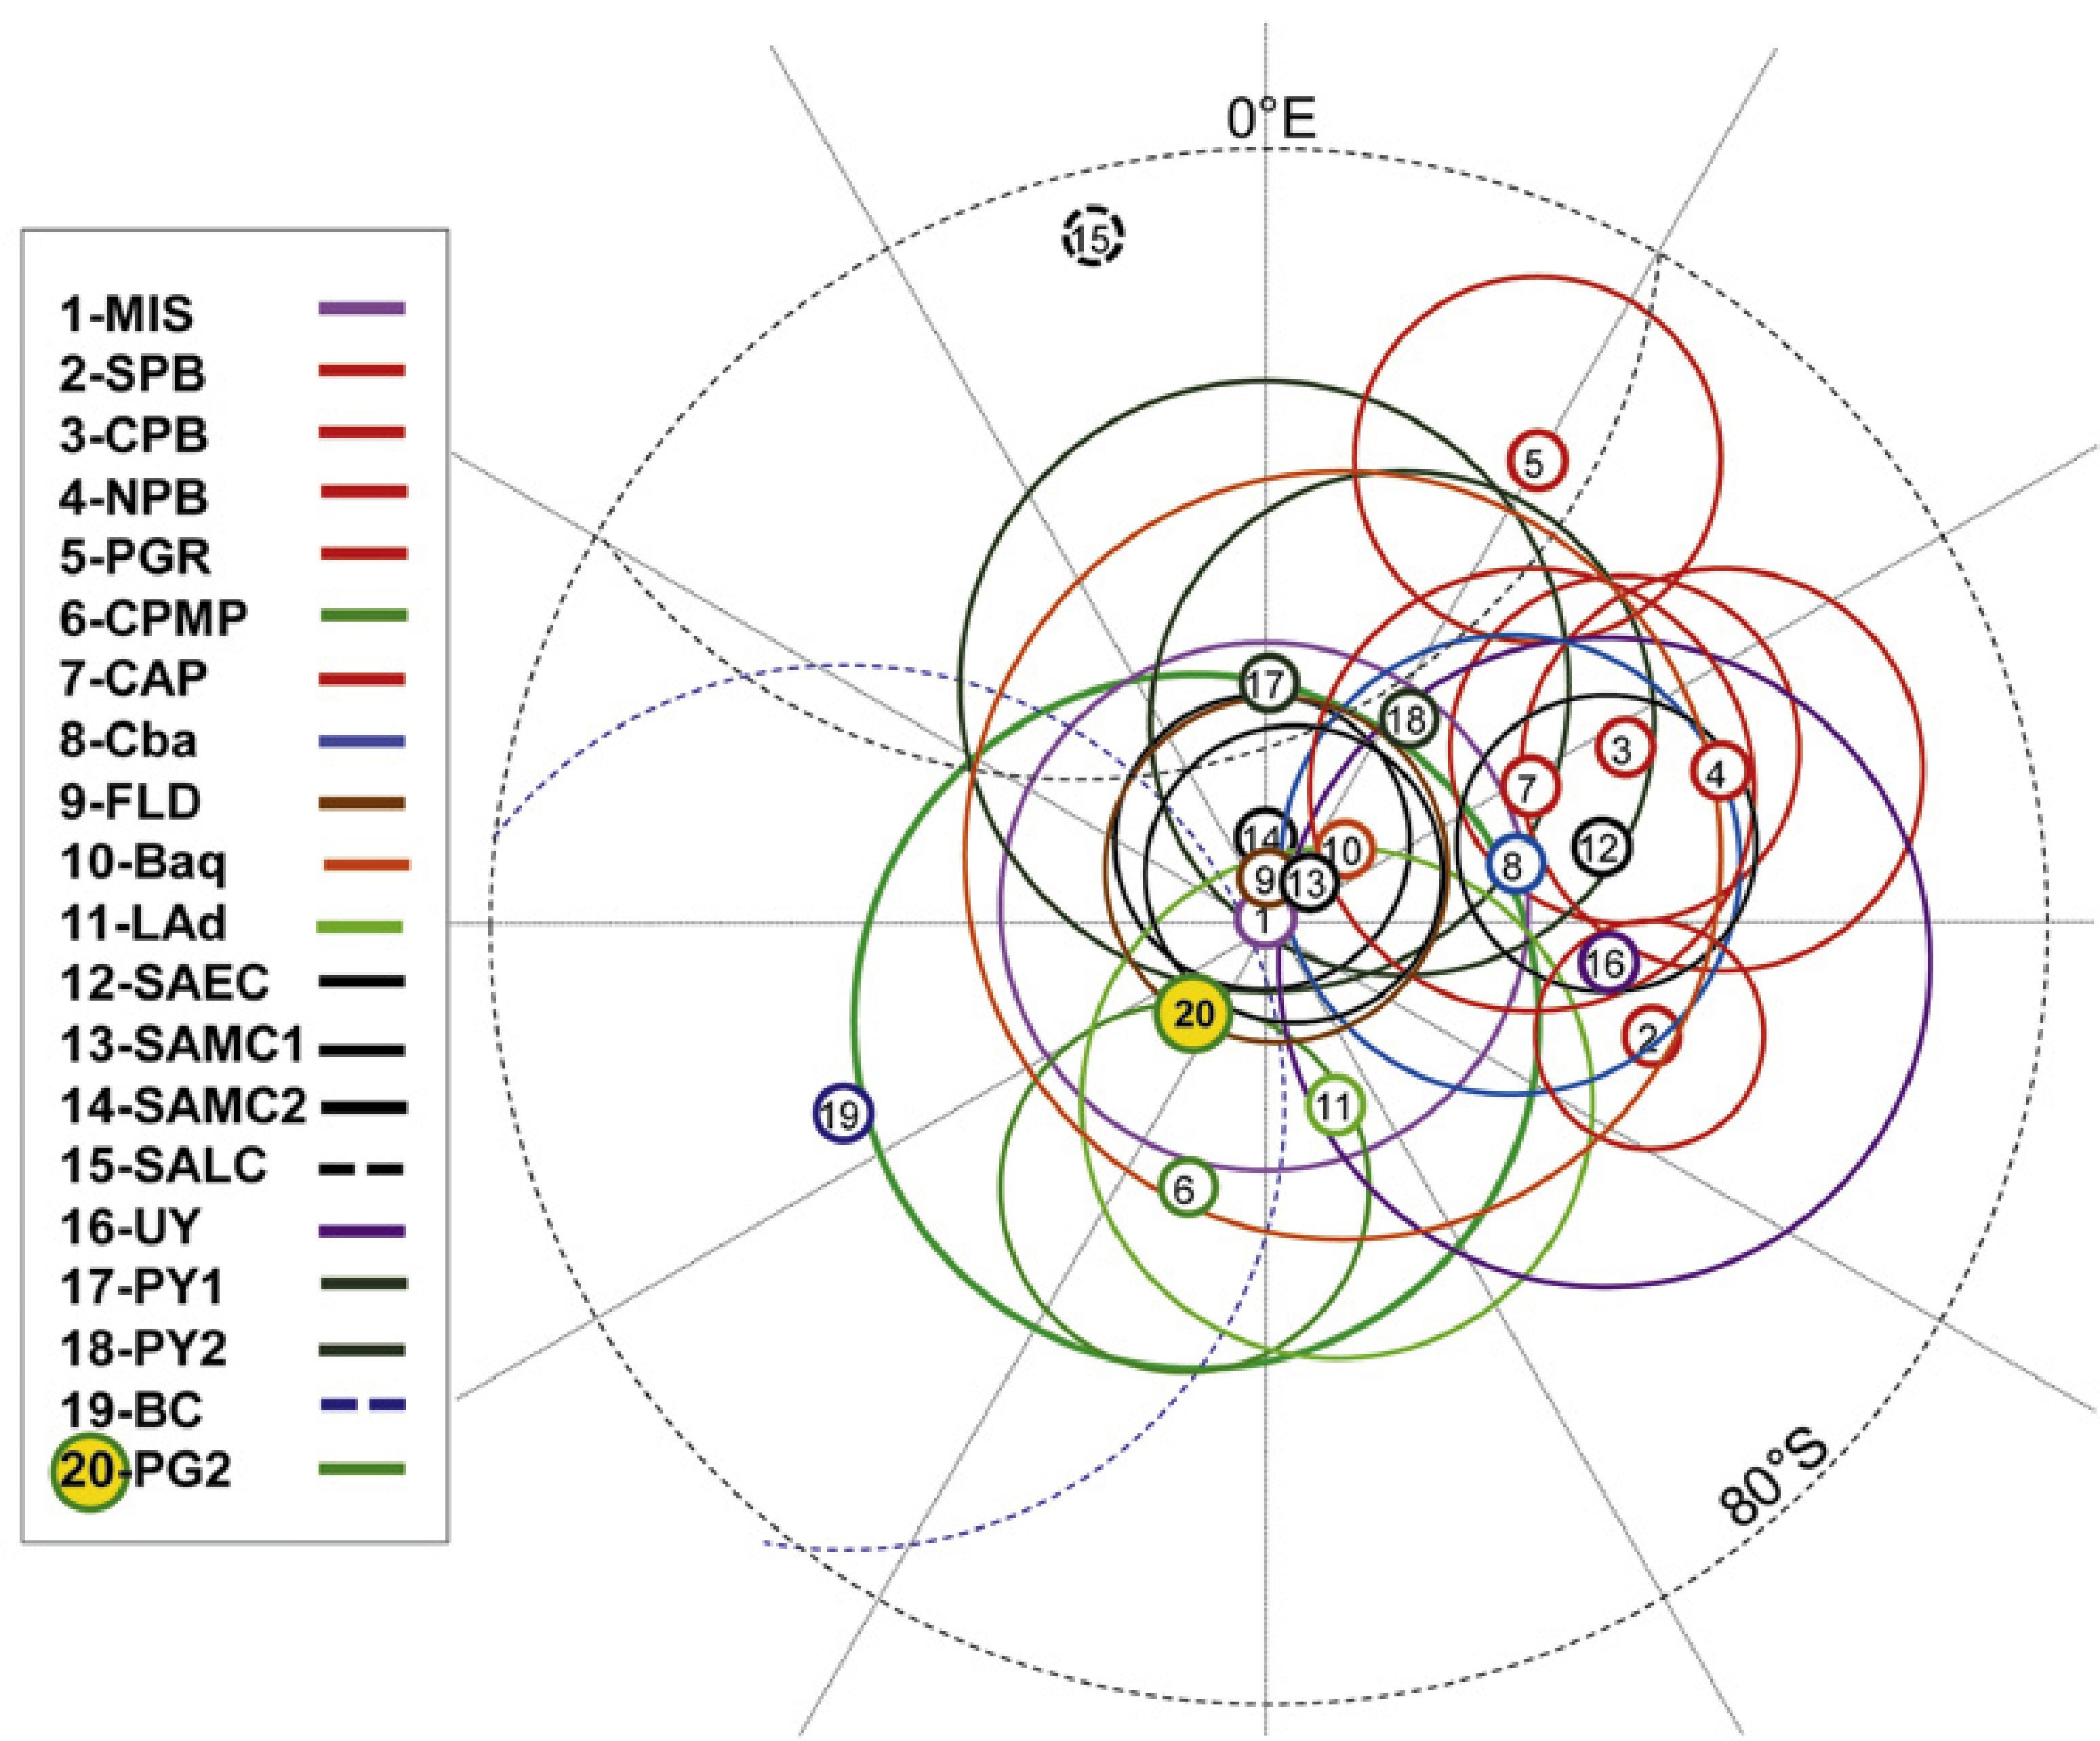
Figure 8 Paleomagnetic poles with 95% confidence circles for Ponta Grossa dikes and previously published cretaceous PPs with their confidence limits. 1. Misiones (Mena et al., 2011), 2. Southern Paraná Basin (Raposo and Ernesto, 1995), 3. Central Paraná Basin (Raposo and Ernesto, 1995), 4. Northern Paraná Basin (Ernesto et al., 1999), 5. Ponta Grossa Dikes (Raposo and Eresto, 1995), 6. Central Paraná Magmatic Province (Alva-Valdivia et al., 2003), 7. Central Alkaline Province, Paraguay (Ernesto et al., 1996), 8. Sierras Pampeanas (geuna and Vizan, 1998), 9. Florianopolis Dikes (Raposo et al., 1998), 10. Baqueró Group (Somoza et al., 2005), 11. Los Adobos (Geuna et al., 2000), 12. Mean Early Cretaceous (Somoza and Zafarana, 2008), 13. Mean Middle Cretaceous (Somoza and Zafarana, 2008), 14. Mean Cretaceous (Somoza and Zafarana, 2008), 15. Mean Late Cretaceous, (Somoza and Zafarana, 2008). 16. Arapey (Solano et al., 2010), 17. Alto Paraguay 18 (Goguitchaichvili et al., 2012), 18. Alto Paraguay 16 (Goguitchaichvili et al., 2013), 19. Reference Poles at 135 Ma (Besse and Courtillot, 2002), Ponta Grossa (This study).
Table 2 Selected Cretaceous paleomagnetic poles. P= number assigned to paleomagnetic pole (PP) in Figures X; long E, lat S, A95= longitude, latitude and semi angle of 95% confidence of the PPs.
The location of our paleomagnetic poles significantly differs from early Ponta Grossa poles obtained by Raposo and Ernesto (1995). However, these new poles agree well (within uncertainties) with the reference poles given by Besse and Courtillot (2002). This attests that our results should be considered as most precise determination of Cretaceous paleomagnetic pole positions for stable South America.
The VGPs scatter was calculated according to, (Cox, 1969 ) where S p is the total angular dispersion, Di is the angular distance of the i -th VGP to the PP and N is the number of sites used in the calculation. Thereby S =12.9°. The paleosecular variation (PSV) was estimate according to McEllhinny and McFadden (1997) by where S w = 81/K -1/2 is the within-site scatter, K being Fisher concentration parameter for poles estimate from direction concentration parameter (k ) according to K = 8k (5 +18sin2 λ + 9sin4 λ), λ is the site paleolatitude, and n i is the number of directions from i- th site. The calculated PSV is S =12.3°, with a 95% confidence interval [10.3°;15.2°], which agrees well with the expected value for this latitude. The SB values here obtained agree well with the selected data reported for the Cretaceous Normal Superchron (Biggin et al ., 2008) between 125 to 84 Ma. This supports that the Earth's magnetic field maintained similar characteristics before and during CNS, in disagreement with previous studies.

