nueva página del texto (beta)
 Inglés (pdf)
 Artículo en XML
 Referencias del artículo
 Enviar artículo por email
 Citado por SciELO
  Similares en
SciELO
Similares en
SciELO 
 Permalink
Introduction
During the last decades, a number of paleomagnetic records across the world yielded anomalous geomagnetic field (GMF) directions likely corresponding to different excursions occurred during the terminal Pleistocene and Holocene (e.g. Petrova and Pospelova, 1990; Burakov and Nachasova, 1990; Dergachev et al. , 2004, 2012; Guskova et al. , 2008; Kochegura and Pisarevsky, 1994; Lund et al ., 2007, 2008; Moreiras et al. , 2013; Nami, 1995, 1999a, 1999b; Nelson, 2009; Platzman et al. , 2010; Raspopov et al ., 2003; Urrutia-Fucugauchi et al ., 1995; Zhu et al. , 1998; among others). Radiocarbon dating indicates that they span the last ∼11000-10000 uncalibrated or ∼13000-12000 calibrated years before present that, hereafter they are respectively referred as ∼11-10 ka BP or ∼13- 12 cal. ka BP. Investigations on this topic have significant geomagnetic, environmental and stratigraphic implications (e.g., Westaway, 2003; Backmutov, 2006; Constable and Korte, 2006; Brown et al. , 2007; Kuznetsova and Kuznetsov, 2008; Dergachev et al. , 2012). Additionally, due to the occurrence of this kind of GMF behavior paleomagnetic data may be used as dating tools (Parkes, 1986; Thompson, 1991; Herz and Garrison, 1998). For this reason, compatible evidence on diverse material of similar age must be investigated using similar sampling and laboratory techniques (Roberts and Piper, 1989). Therefore, sampling in sedimentary sections from diverse environments was conducted in the Republic of Ecuador. The main goal was to explore the Late Pleistocene-Holocene GMF behavior in a low latitude area, because GMF anomalous records were previously observed at other latitudes across North and South America (e.g., Clark and Kennett, 1973; Gonzalez et al. , 1997; Urrutia-Fucugauchi et al ., 1995; Nami, 1999a, 1999b, 2012, 2013; Nami and Sinito, 1991, 1993, 1995; Ortega Guerrero and Urrutia-Fucugauchi, 1997; Sinito et al ., 1997, 2001; Moreiras et al. , 2013).
Study area, sampling sites and chronology
The sampling sites are located around the Ilaló hill, Los Chillos valley in the Pichincha province (Figure 1). A brief description of the sites follows:
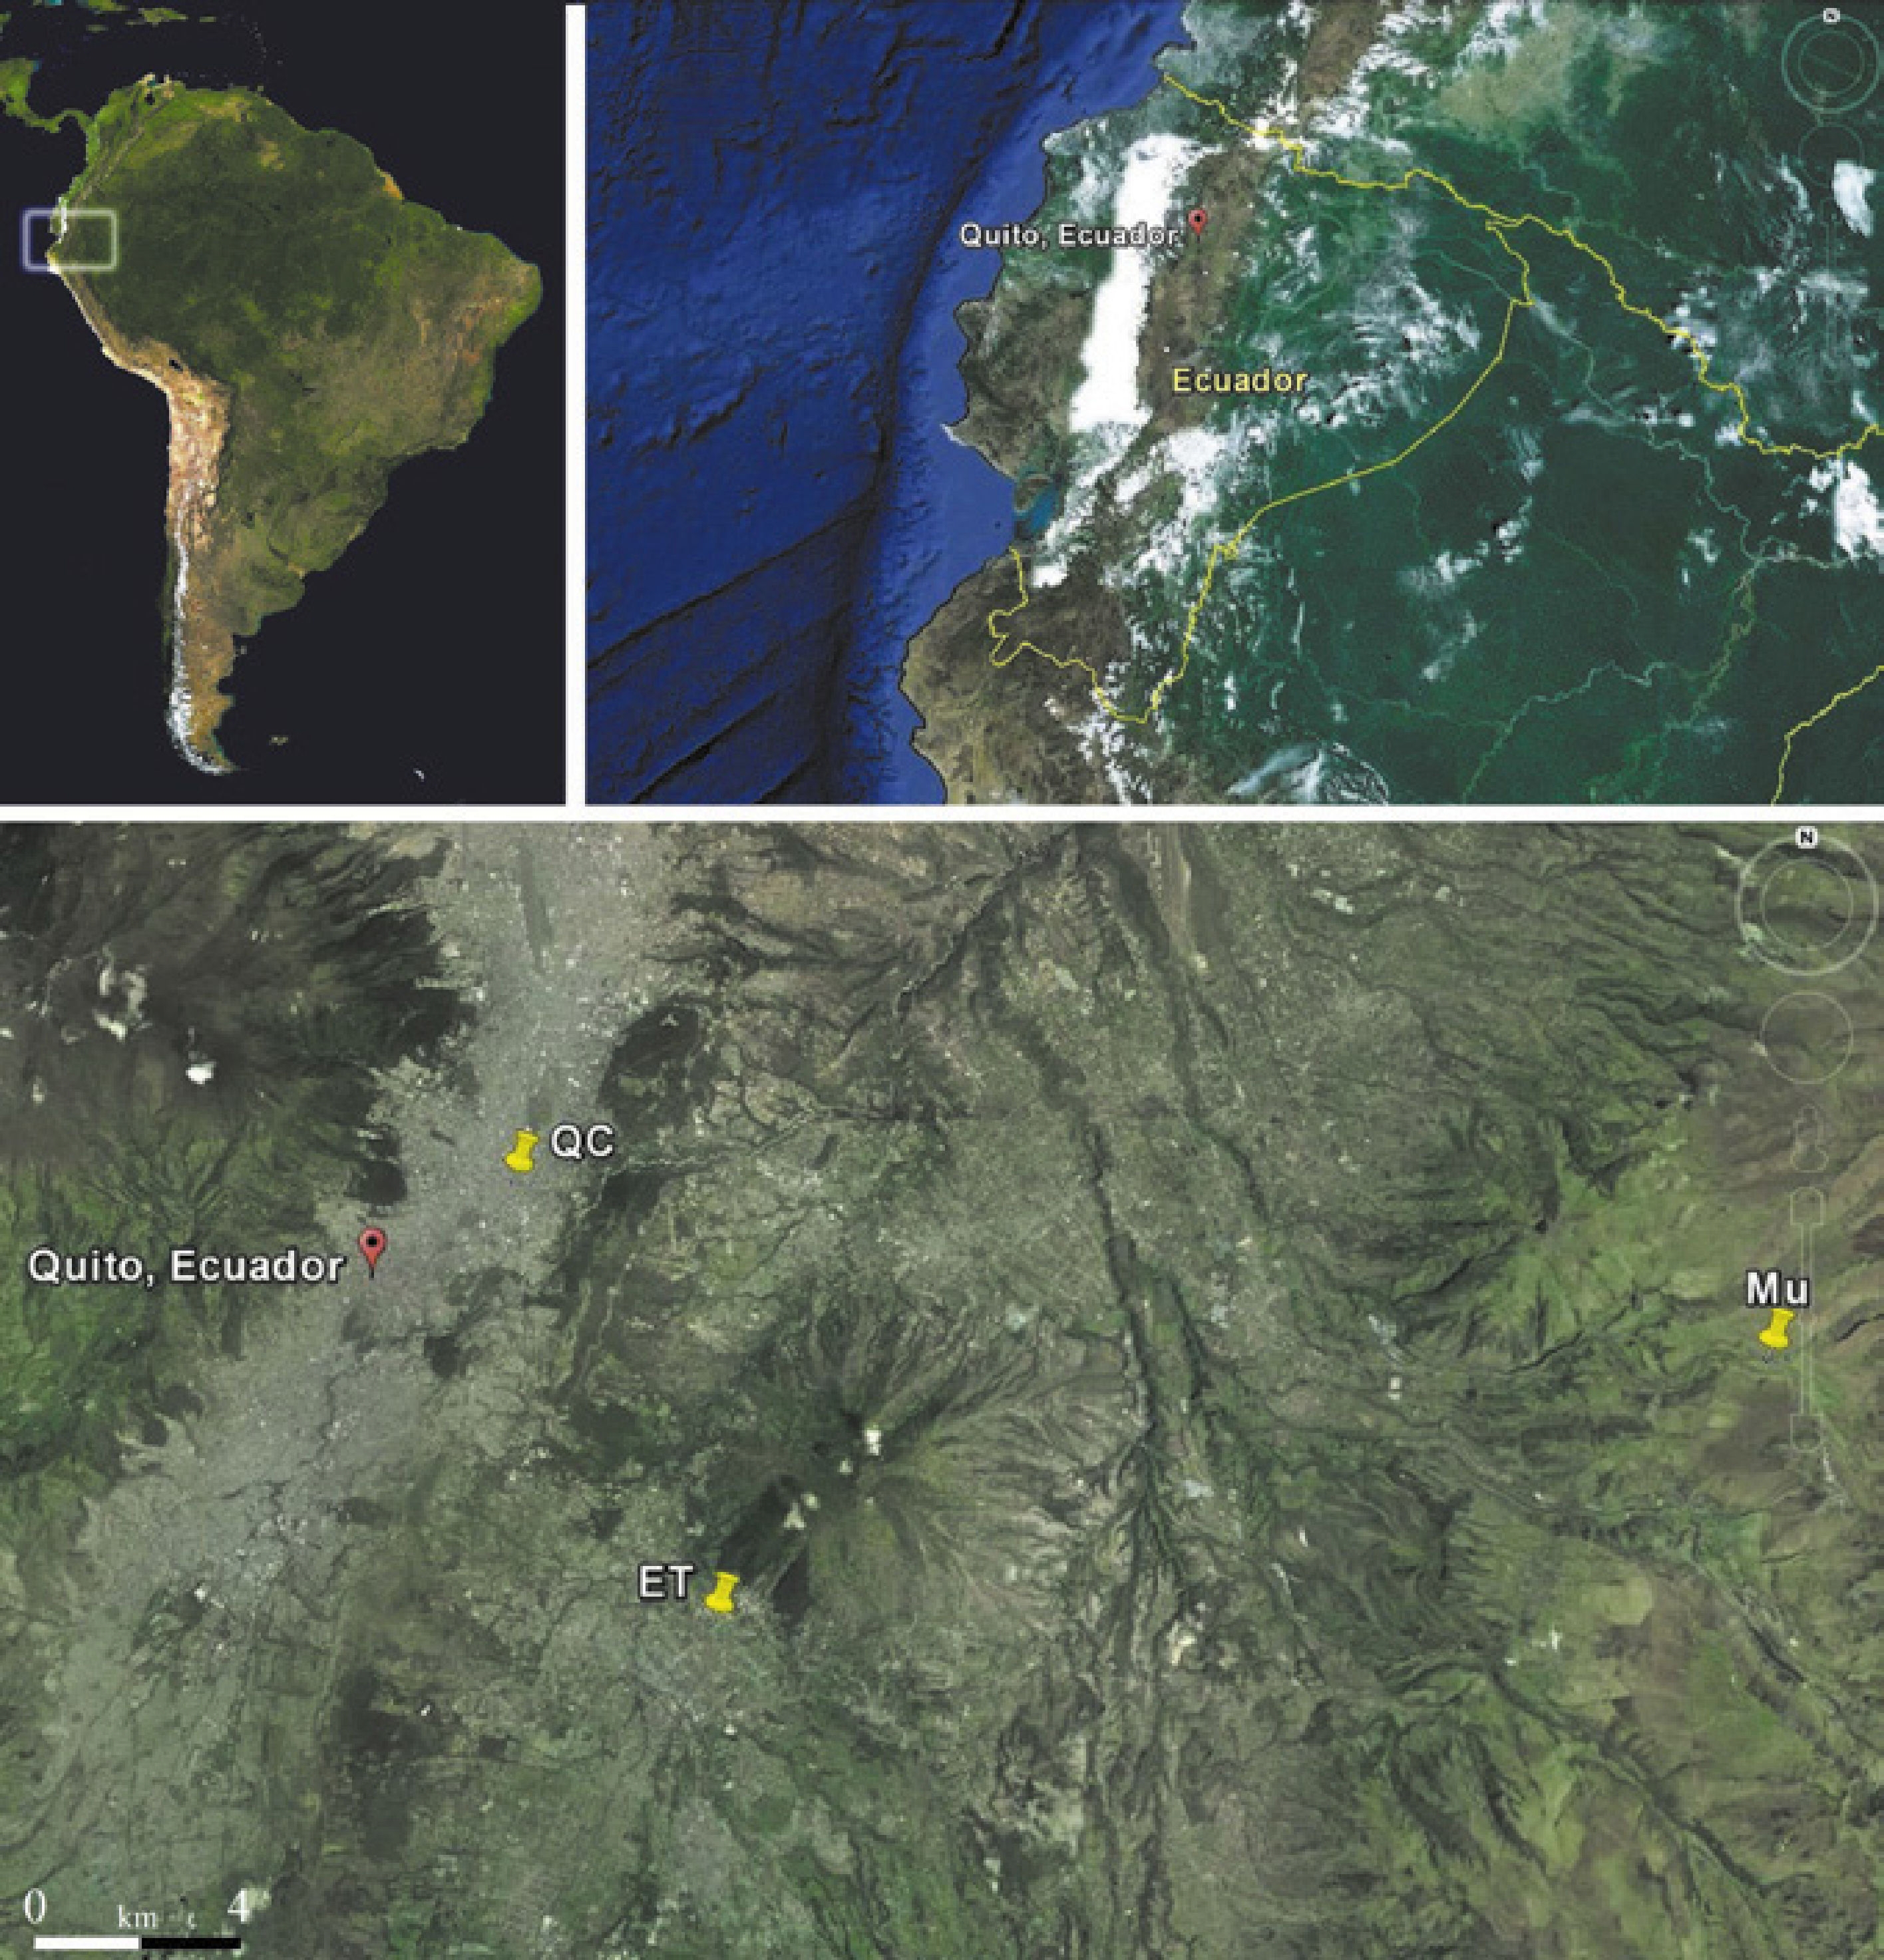
Figure 1 Map of Ecuador and location of the sampling sites mentioned in the text. QC: Quito City, Mu: Mullimica, ET: El Tingo (after Google Maps, 2013).
Quito city (QC, 00° 12.10' S, 78° 29.40 W) section belongs to a ∼2.30 meter deep pit made on Gerónimo Carrión St. for a building construction in Quito city. Despite of nowadays there is not evidence of alluvial activity, the sediments represent a characteristic lacustrine environment, formed by an ancient lake existing in this part of Quito until the Spanish conquest and colonial times. Due to the sedimentological and lithological composition, 9 intercalated clay, sand and silty sand natural strata were identified at QC, numbered "I" to "IX" (Figure 2a).
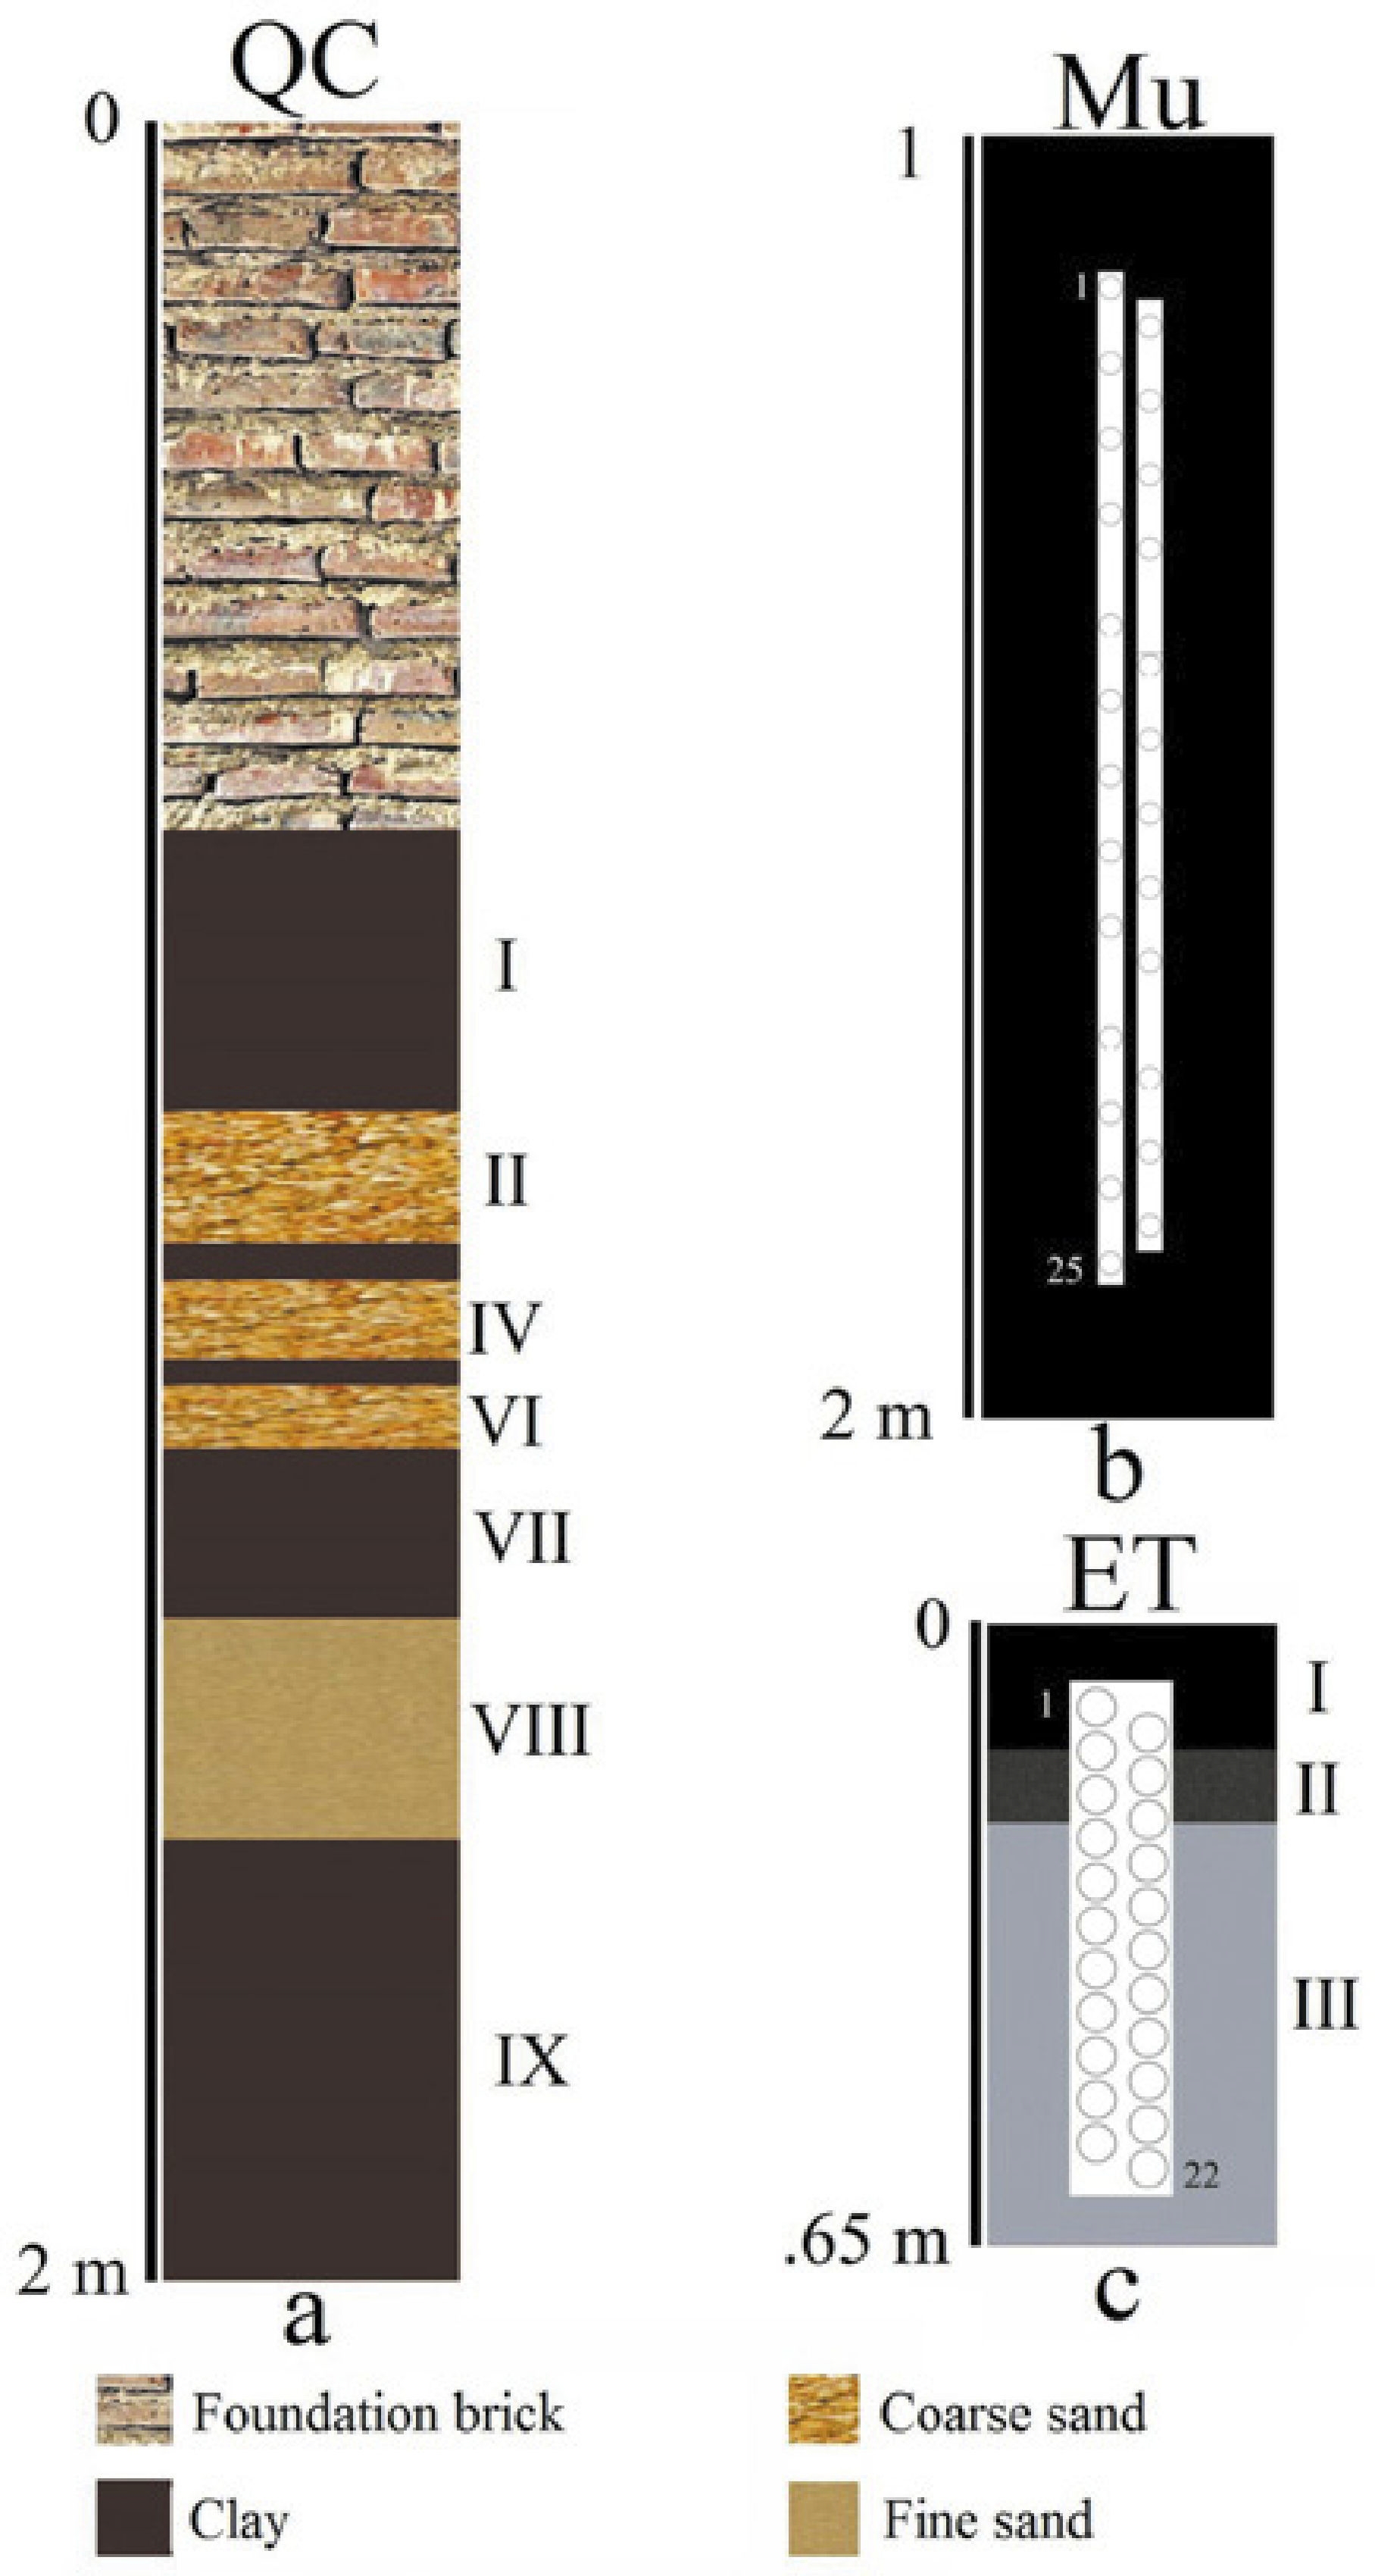
Figure 2 Schematic stratigraphic profiles showing the sampled sections, AMS dates and location of the palaeomagnetic sampling related to stratigraphy at Mu and ET. Numbers on the cylinders'top and bottom show the correlative order of the samples. In the text is given the description of each stratigraphic level which is numbered with roman numbers on the right of each section. At QC, level III and V were not numbered.
Mullimica (Mu, 00' 14.40' S, 78° 14.58' W) is situated at the paramo in the eastern cordillera at about 4000 m.a.s.l. The paleomagnetic sampling was performed on the left bank of San Lorenzo River, very close to its intersection with the Quebrada de Mullimica (Salazar, 1980). The sedimentary pile consist in a 2 m thick deposit of homogeneous black sediment overlying a late glacial deposit of pebbles and cobbles (Figure 2b)
El Tingo (ET, 00° 17.43' S, 78° 26.88' W) is located in the homonymous village situated at Los Chillos Valley, southeast of Quito. The sampling was made in the upper part of a large section of cangagua that is a very fine volcanic material similar to loess, but with different mineralogical composition; although, this geological unit is widely believed to have been deposited during a glacial episode in the Pleistocene (Sauer, 1965). Elsewhere in the Ilaló region, the upper part of the cangagua yielded highly diagnostic archaeological Paleoindian "fishtail" or Fell projectile points (Bell, 1965; Mayer-Oakes and Bell, 1960; Mayer-Oakes, 1963, 1966, 1986) which in South America were consistently dated ∼11-10 ka BP (Nami, 2007: Table 1). Most of the archaeological remains at these sites occur on a dark layer of sediment overlying regional deposits of cangagua , a volcanic tuff presently exposed in the lower slopes of the Ilaló hill (Mayer-Oakes, 1966).
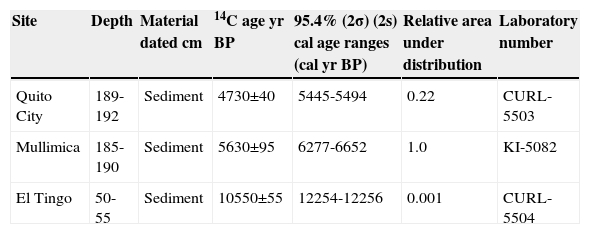
Table 1 List of AMS dates obtained in the sites described in this paper. The calibrated ages were calculated with the “Calib radiocarbon calibration program” (Stuiver and Reimer, 1993) and the calibration data set assembled by Reimer and colleagues (2013).
Considering the stratigraphic occurrence of the Paleoindian discoveries as well as the Pleistocene age of the deposit, it must be considered as Late Pleistocene/early Holocene in age. For this reason, with paleomagnetic purposes, only the upper part of the section underlying the recent soil was sampled, where the cangagua is the parental material.
It consisted of three levels, called here I, II and III (Figure 2c). Level I is the recent soil with vegetation, II is the transitional part between level I and III, which is formed by a gray cangagua.
AMS radiocarbon dating technique (Hedges and Gowlett, 1986; Taylor, 1997) showed to be highly useful for dating the sediment's organic matter (Wang et al ., 1996; Willey et al ., 1998; Pessenda et al ., 2001). Dates from this kind of material tend to provide reliable calibrated ages. However, it can be considered as a minimum age because the apparent mean residence time (MRT) of organic components is an important factor in soil dating. This is because the mix of younger and old organic matter that might provide younger dates (Scharpenseel, 1971, 1976; Scharpenseel and Schiffmann, 1977; Stein, 1992). Then, sediment samples were submitted to determine the age of each site. QC and ET AMS measurements and ages calculation were performed by the NOSAMS facility at Woods Hole Oceanographic Institute and the CU-Boulder INSTAAR Laboratory for AMS Radiocarbon; all other preparation of the samples were carried out by the CU-Boulder INSTAAR Laboratory for AMS Radiocarbon Preparation and Research, University of Colorado at Boulder, USA. Mu sample was processed by the Leibniz-Labor für Altersbestimmung und Isotopenforschung, Universität Kiel Leibniz-Laboratory for Radiometric Dating and Stable Isotope Research Kiel University, Germany. Dates were made from the humic acid fraction of the sediment, which tends to provide more reliable ages for this kind of materials (Pessenda et al. , 2001). The results obtained are given in Table 1 depicting the uncalibrated and calibrated ages using the "Calib radiocarbon calibration program" (Stuiver and Reimer, 1993) and the calibration data set assembled by Reimer and colleagues (2013).
AMS essays from the lower portion of the QC and Mu sections dated both sites to the Middle Holocene, while the sample from ET yielded an age spanning the Pleistocene-Holocene transition conventionally established at 10.0 ka BP (Dawson, 1992). ET date is coincident with the age of the archaeological finds belonging similar stratigraphic position in the area and other parts of South America (Nami, 2002, 2007; Maggard and Dillehay, 2011); however, QC and Mu results might represent minimum age for the deposits.
Paleomagnetic study
Sampling procedures
Paleomagnetic samples were vertically taken using 2.5 cm long and 2 cm diameter cylindrical plastic containers. At QC and ET the cylinders were carefully pushed into the sediments overlapping the next one about 50% each in the way illustrated in figure 2c, while in Mu the interval was ∼2-3 cm (Figure 2b). Their orientation was measured using a Brunton compass. Samples were consolidated with sodium silicate once removed and finally, they were numerated from the top to the bottom. This sampling technique allows obtaining detailed paleomagnetic records and therefore, it is highly useful for the definition of short time excursions (Clement and Kent, 1984).
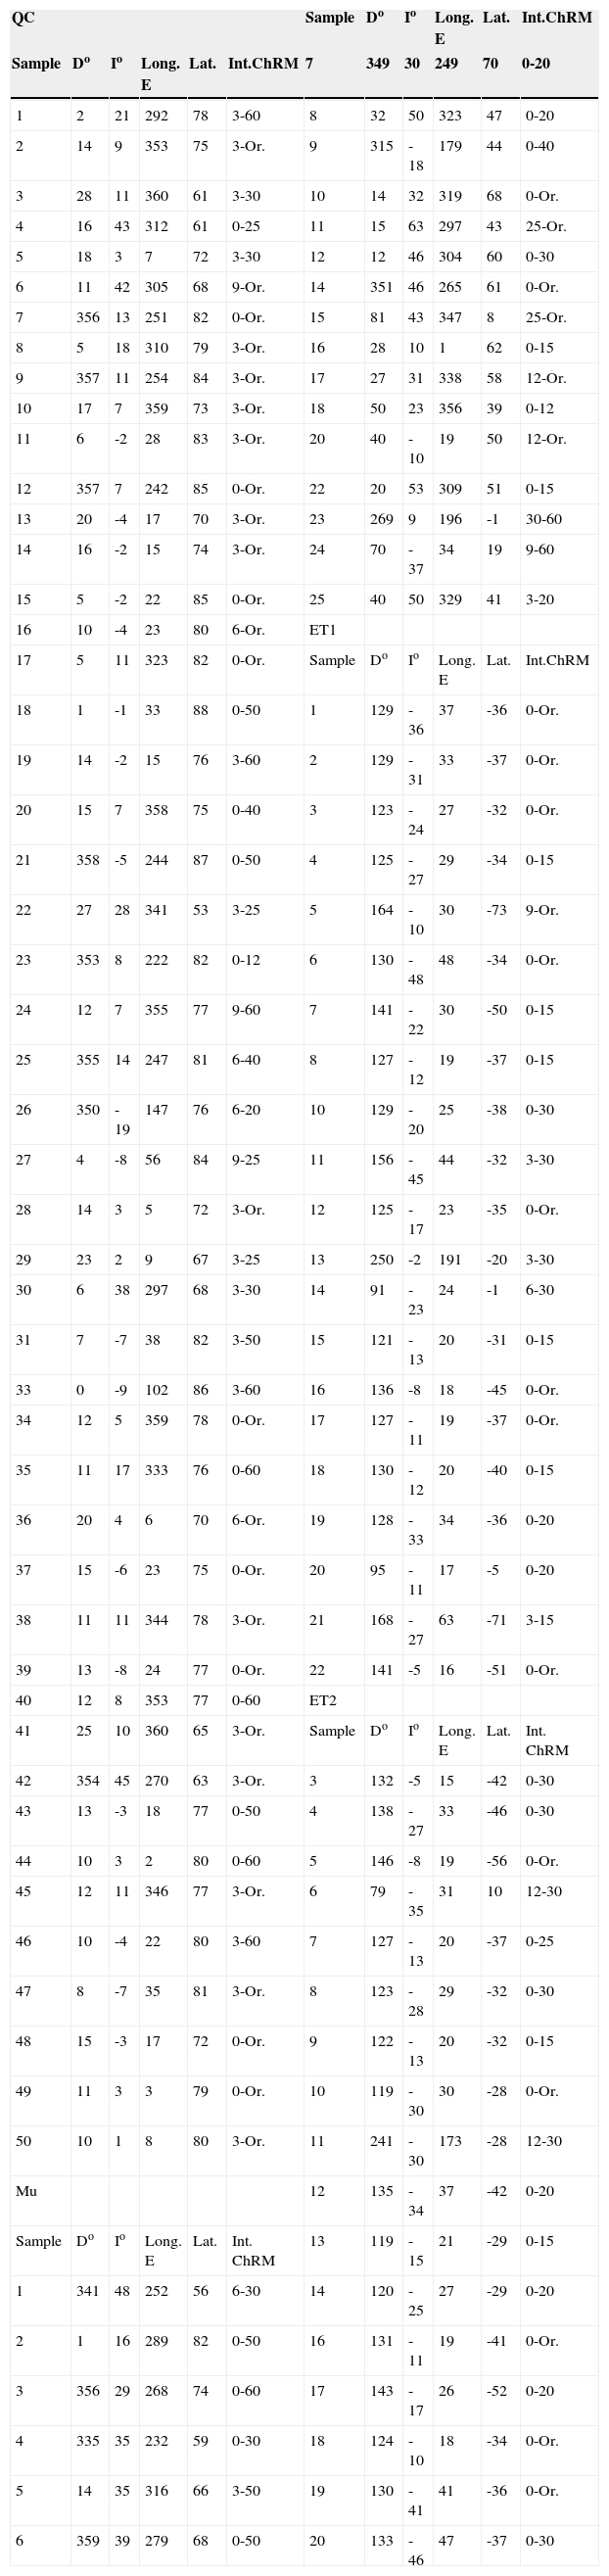
Following the interval described above and illustrated in figure 2c, at QC the sampling (n = 49) was taken between 0.72 m and 1.89 depth in the following levels: I (samples QC1 1 to 10), III (QC1 11 and12), V (QC13 and 14), VII (QC15 to 24), VIII (QC25 to 33) and IX (QC34 to 49). Sand layers II, IV and VI were not sampled due to the presence of coarse elements. Mu Sampling (n = 25) was performed between -1.26 and 1.90 m below the present vegetal soil. At ET, two samplings sites identified as ET1 (n = 22) and ET2 (n = 20) were taken each 30 cm each other. For comparative purposes and to cross check the section magnetic behavior according to depth, an additional sample (ET3 1) was taken approximately 30 meter below the surface in a red level of cangagua. Samples from ET were taken as follows: ET1 1 and 2 and ET2 1 to 3 from level I, ET1 3 to 6 and ET2 4 to 6 in level II while ET1 7 to 22 and ET2 7 to 20 from level III. Sediment near the surface was not sampled because it was highly disrupted by plant roots and there was evidence of recent archaeological pottery remains.
Laboratory analysis and results
All samples were subjected to detailed stepwise alternating field (AF) demagnetization in progressive steps of 3, 6, 9, 12, 15, 20, 25, 30, 40 and 60 mT with a 3-axis static degausser attached 2G cryogenic magnetometer (755 R). Additional steps of 80 and 100 mT were used in some samples. The characteristic directions were calculated using principal components' analysis (Kirschvink, 1980). Paleomagnetic data were processed with the "Interactive analysis of palaeomagnetic data" (Torsvik, 1992) and MAG88 (Oviedo, 1989) computer programs. Some cores were not processed because their orientation marks were lost (e. g. QC20 to 23, ET1 9 and ET2 1, 2 and 15) or were highly unstable to isolate directions (Mu13, 19 and 21).
Following are the results for each section: QC specimens showed similar magnetic behavior with less of 10% of the NRM remained at field of 60 mT. The majority of the samples display linear demagnetization plots in with a Characteristic remanent magnetization (ChRM) that could be defined trending in the vector diagrams (Zijderveld, 1967) towards the origin (e.g., QC6, 38, 48, figure 3a, c , e ); A few samples present two components with the second one decaying to the origin in the vector projection diagrams (e.g., QC12, 42, figure 3b, d ), with a soft viscous component removed at 3 mT (e.g., QC42, Figure 3d). The cores show normal directions with steep inclinations with north-easterly directions (e.g., QC38, Figure 3c).

Figure 3 Typical Zijderveld diagrams of stepwise demagnetization of five samples with normal polarity from Quito City.
Mu cores exhibited a different behavior with less than 10% of the remanence at 25 mT(Mu25, Figure 4f), 40 mT (Mu4, 17, Figure 4b, d ), 60 mT (Mu1, Figure 4a) and 100 mT (Mu24, Figure 4e). There are univectorial samples (e. g., Mu4, Figure 4b), other ones with two vectors (e. g. Mu1, 17, Figure 4a, d ), and finally a few specimens recorded three magnetic components, one of them with southwesterly direction (Mu24, Figure 4e).
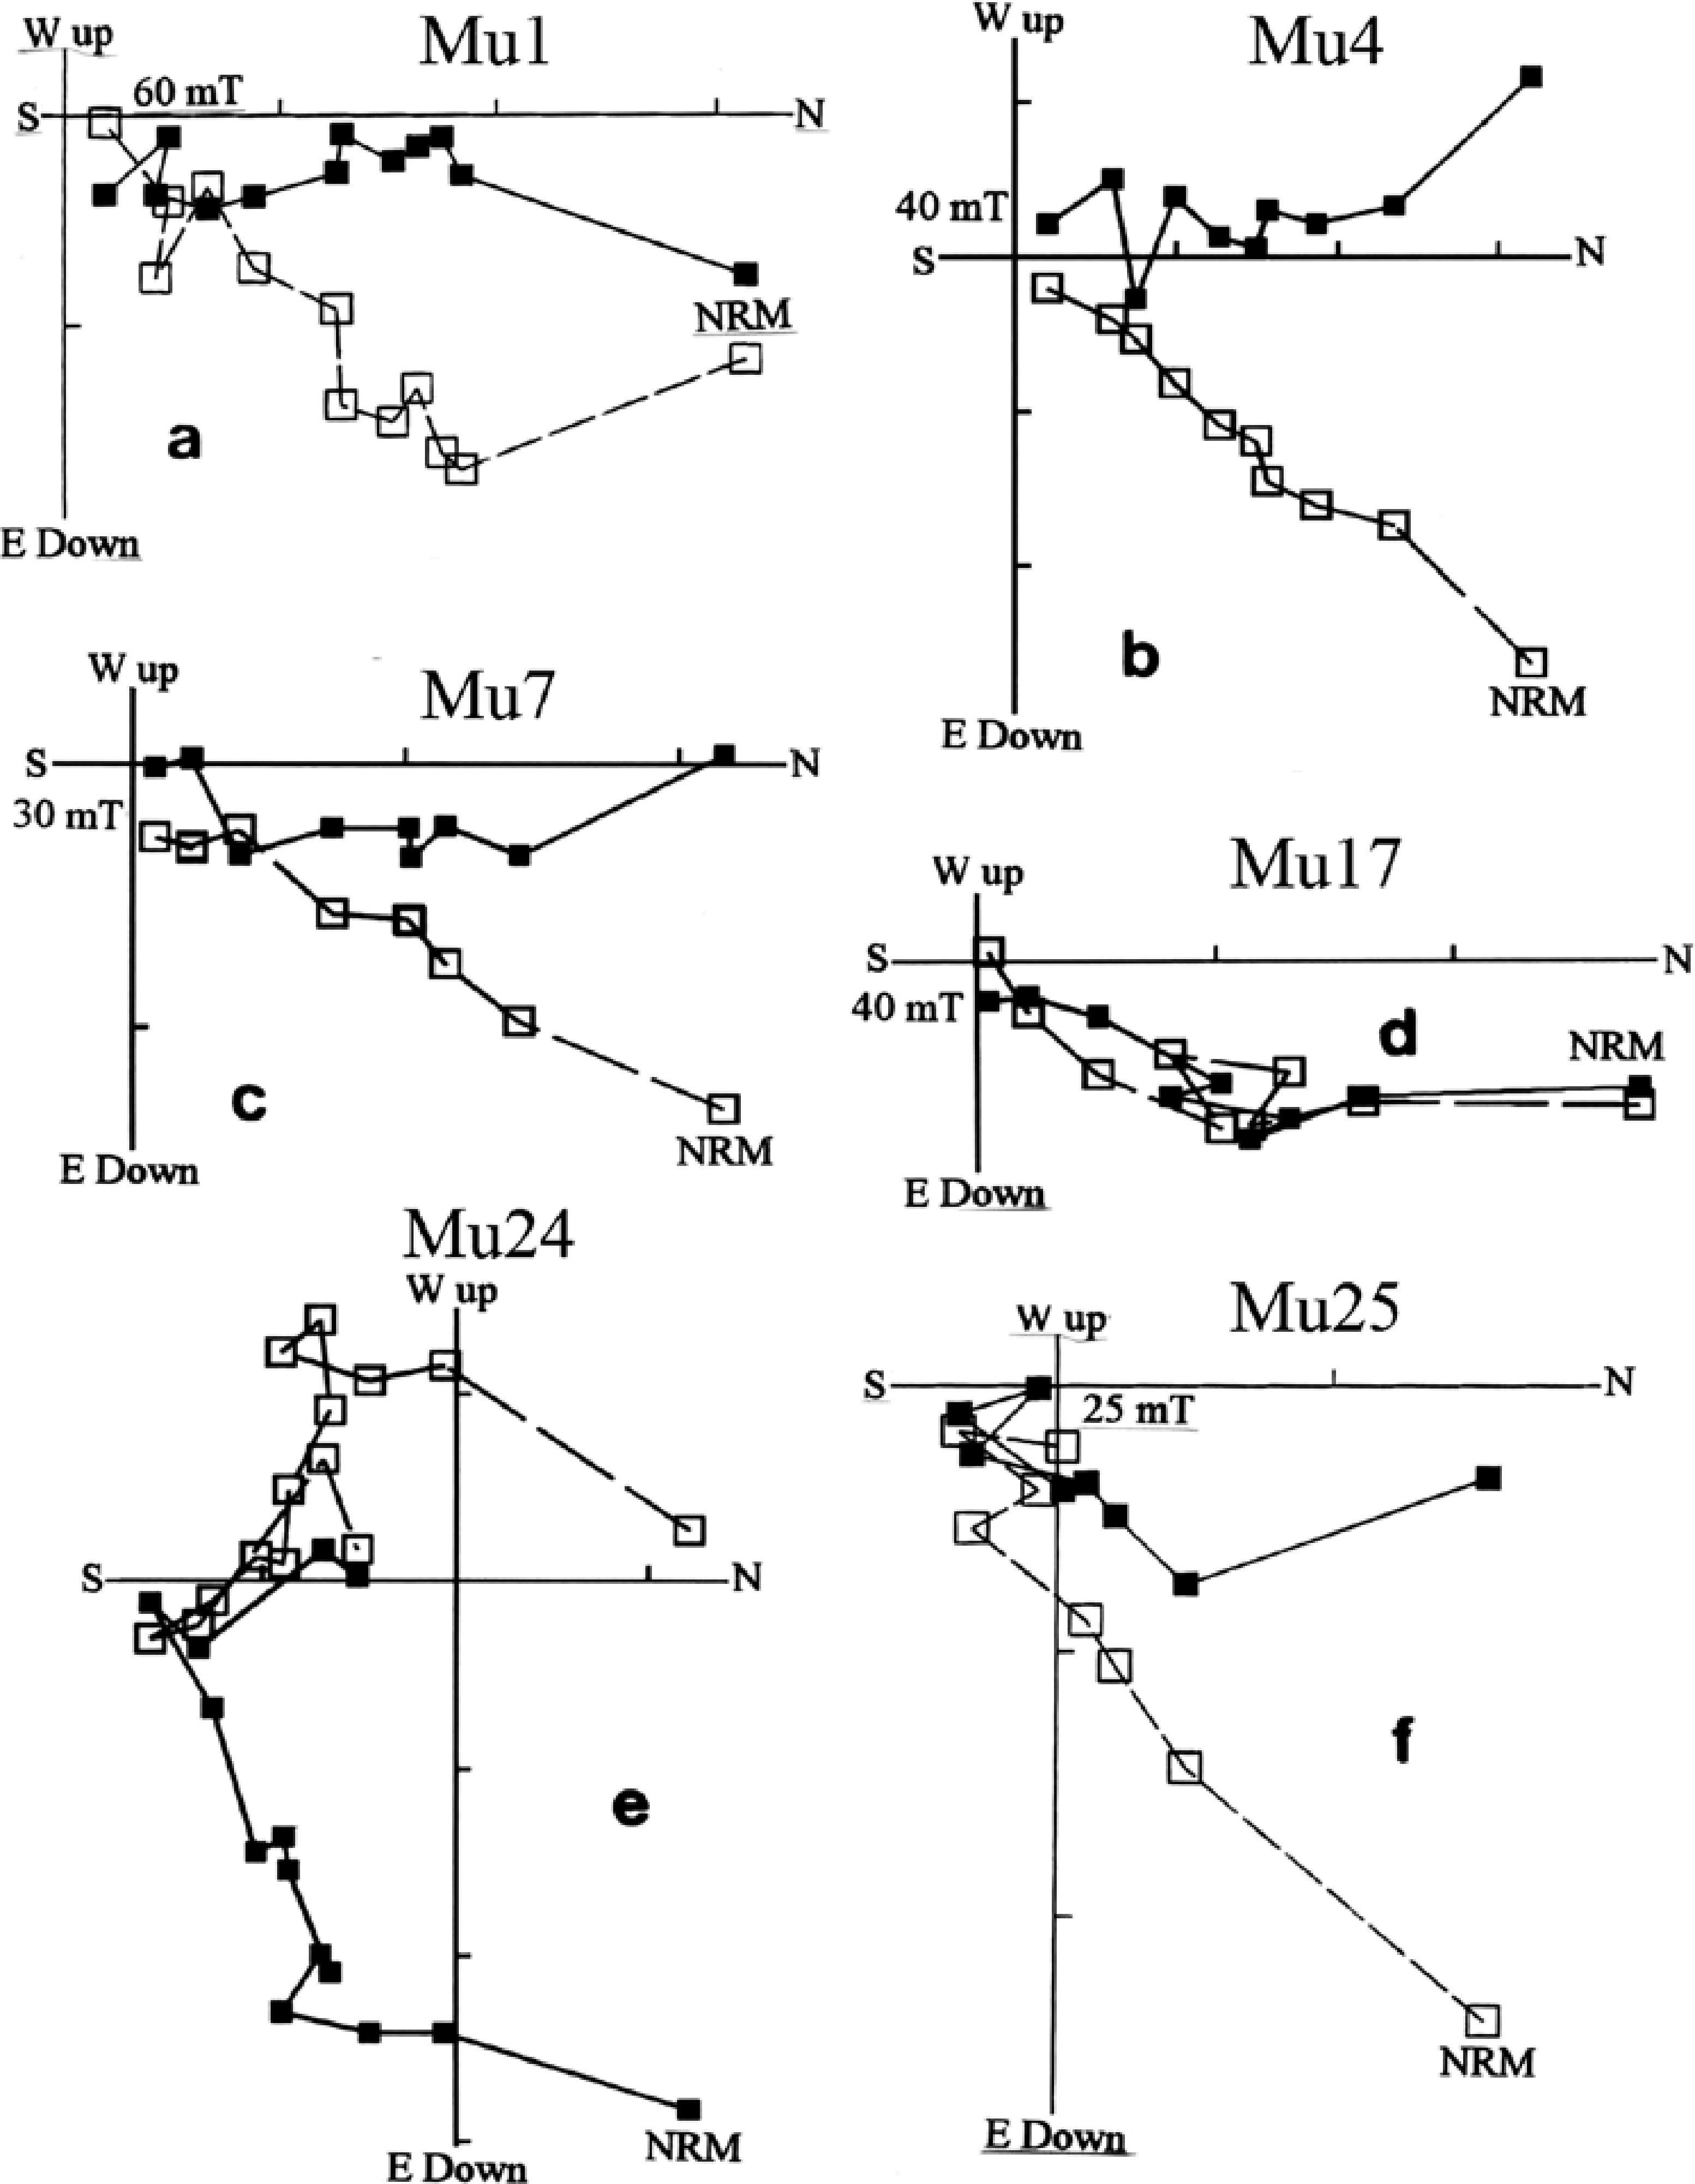
Figure 4 Vector components diagrams showing the behavior of typical samples cleaned using AF progressive demagnetization from Mullimica.
ET samples showed a common pattern with similar reliable magnetic behavior. Some of them have a sudden drop with less than 10% of the remanence at 15 mT (e. g., ET1 5, 17, ET2 16, Figure 5a, d , h ), 25 mT (e. g. ET3 1, Figure 5i), 30 mT (e. g. ET1 13, 14, Figure 5b-c), 40 mT (ET2 6, Figure 5f), and 60 mT (ET2 3, 10, Figure 5e, g ). Most secondary components were a soft viscous magnetization that was easily removed between 3 and 12 mT. In most cases, a ChRM could be defined trending in the Zijderweld diagrams towards the coordinate's origin (e.g., ET1 5, 17, ET2 10, 16, Figure 5a, d , g - h ). A scarce number of specimens had two components with the second one decaying to the origin in the VDP (ET2 6, Figure 5f). Except ET3 1 that yielded a normal direction (Figure 5i), reversed or "anomalous" southward directions were found at the majority of ET1 and ET2 cores (e. g. ET1 5, 13, 17, ET2 3, 6, 10, 16, Figure 5a-b, d-h ); Two samples (ET1 13 and ET2 11) exhibit easterly directions (Figure 5c).
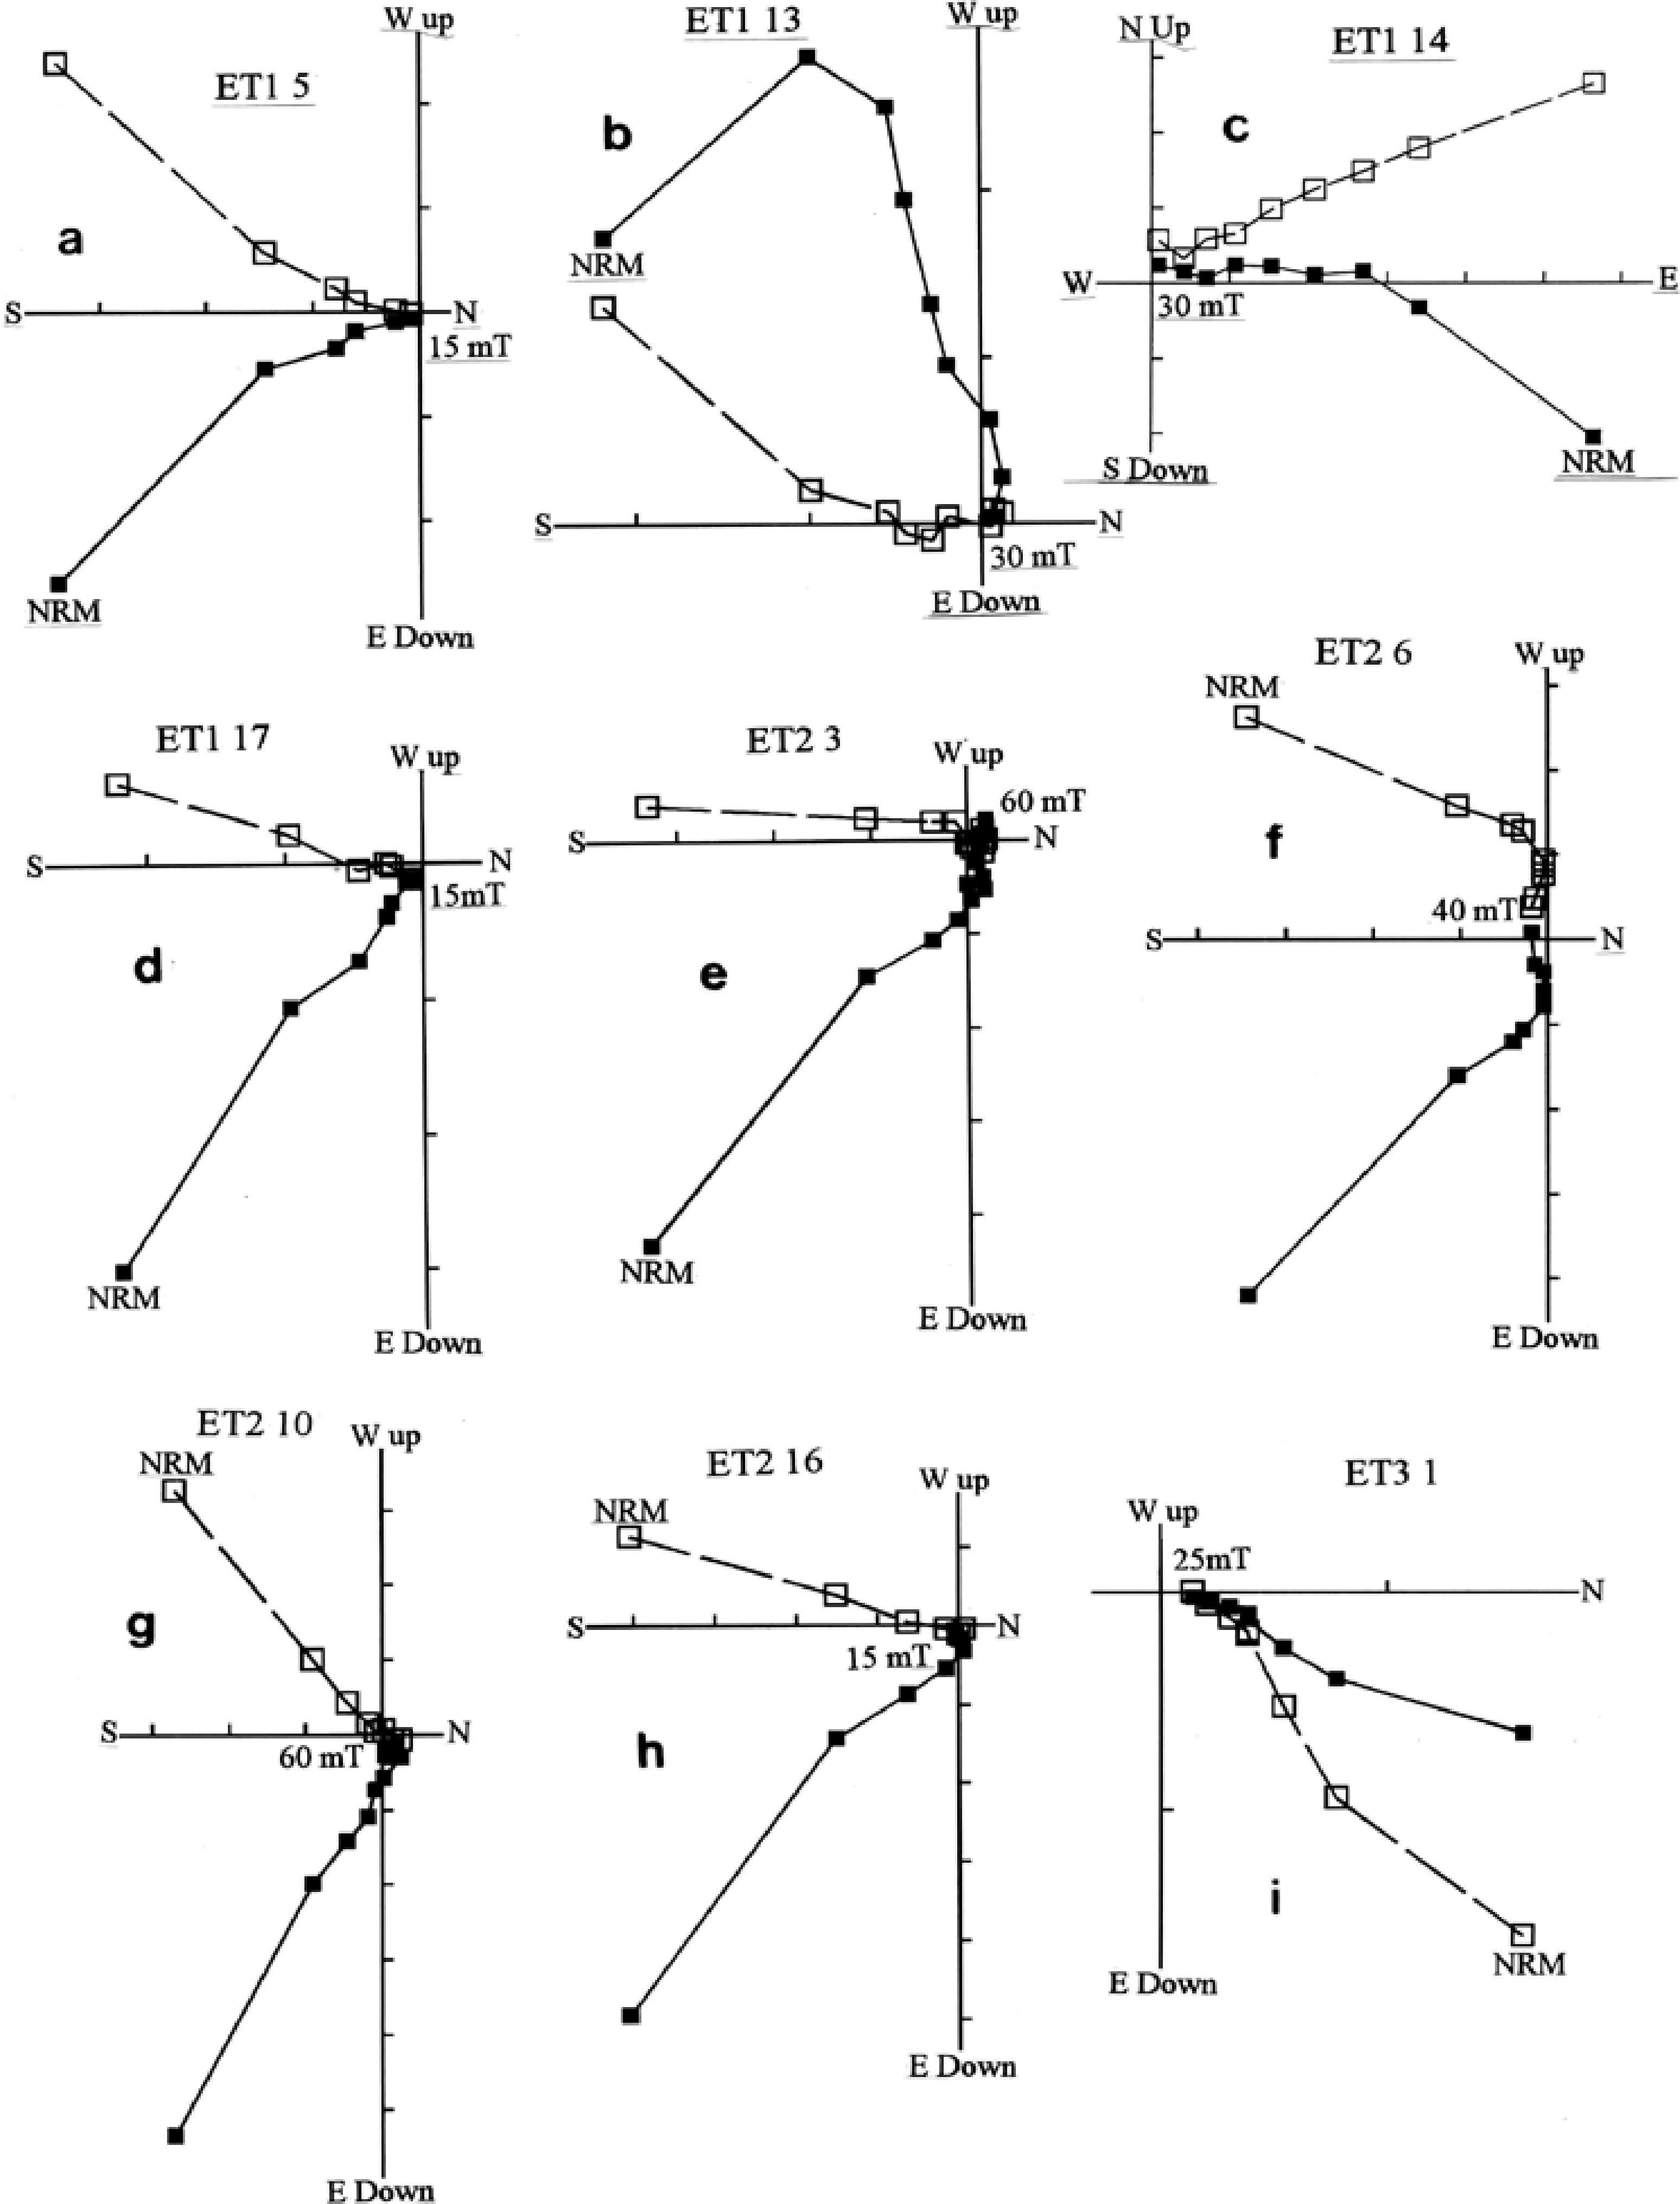
Figure 5 a-h Typical Zijderveld diagrams of stepwise demagnetization of samples with reverse polarity from El Tingo 1 and 2, i) sample with normal direction from ET3.
Samples with less 10% of the NRM remaining at 60 mT from the analyzed sites suggest titanomagnetite as the dominant carrier of the NRM (Nagata, 1961; Stacey and Banerjee, 1974; Tarling, 1983; Thompson and Oldfield, 1986). The number and intervals of demagnetization steps used to isolate the ChRM of each site are depicted in the appendix.
The stereographic projection of each locality is illustrated in Figure 6. QC displays normal GMF direction; despite that most of the samples at Mu display normal polarities, there are also intermediate directions which are considered in this way when departure from the mean is greater than 30° (Quidelleur and Valet, 1996). Surprisingly at ET, both sites yielded strongly similar reverse records. Magnetograms of stratigraphic presentation of the declination and inclination profiles from each site are exhibited in Figures 7 to 9 . QC shows stable logs with a gentle positive to negative inclination from ∼40° to 10° (Figure 7). Mu shows wide amplitude pulses both in declination and inclination with normal and intermediate directions with transitional positive to negative inclination values and wide amplitude pulses between normal declinations (Figure 8). It also present a ∼90° westward declination swing and a strong fluctuating inclination shifting from positive to negative values from ∼40 to 70° which are showed between dashed lines and pointed with an arrow in Figure 8. Remarkably is that ET1 and ET2 showed reverse directions with a similar wide fluctuation of ∼90° represented by one sample (ET1 10 and ET2 9) in each site. Figure 10 exhibit the overlapped stratigraphic presentation of both sections related with 14C date and depth.
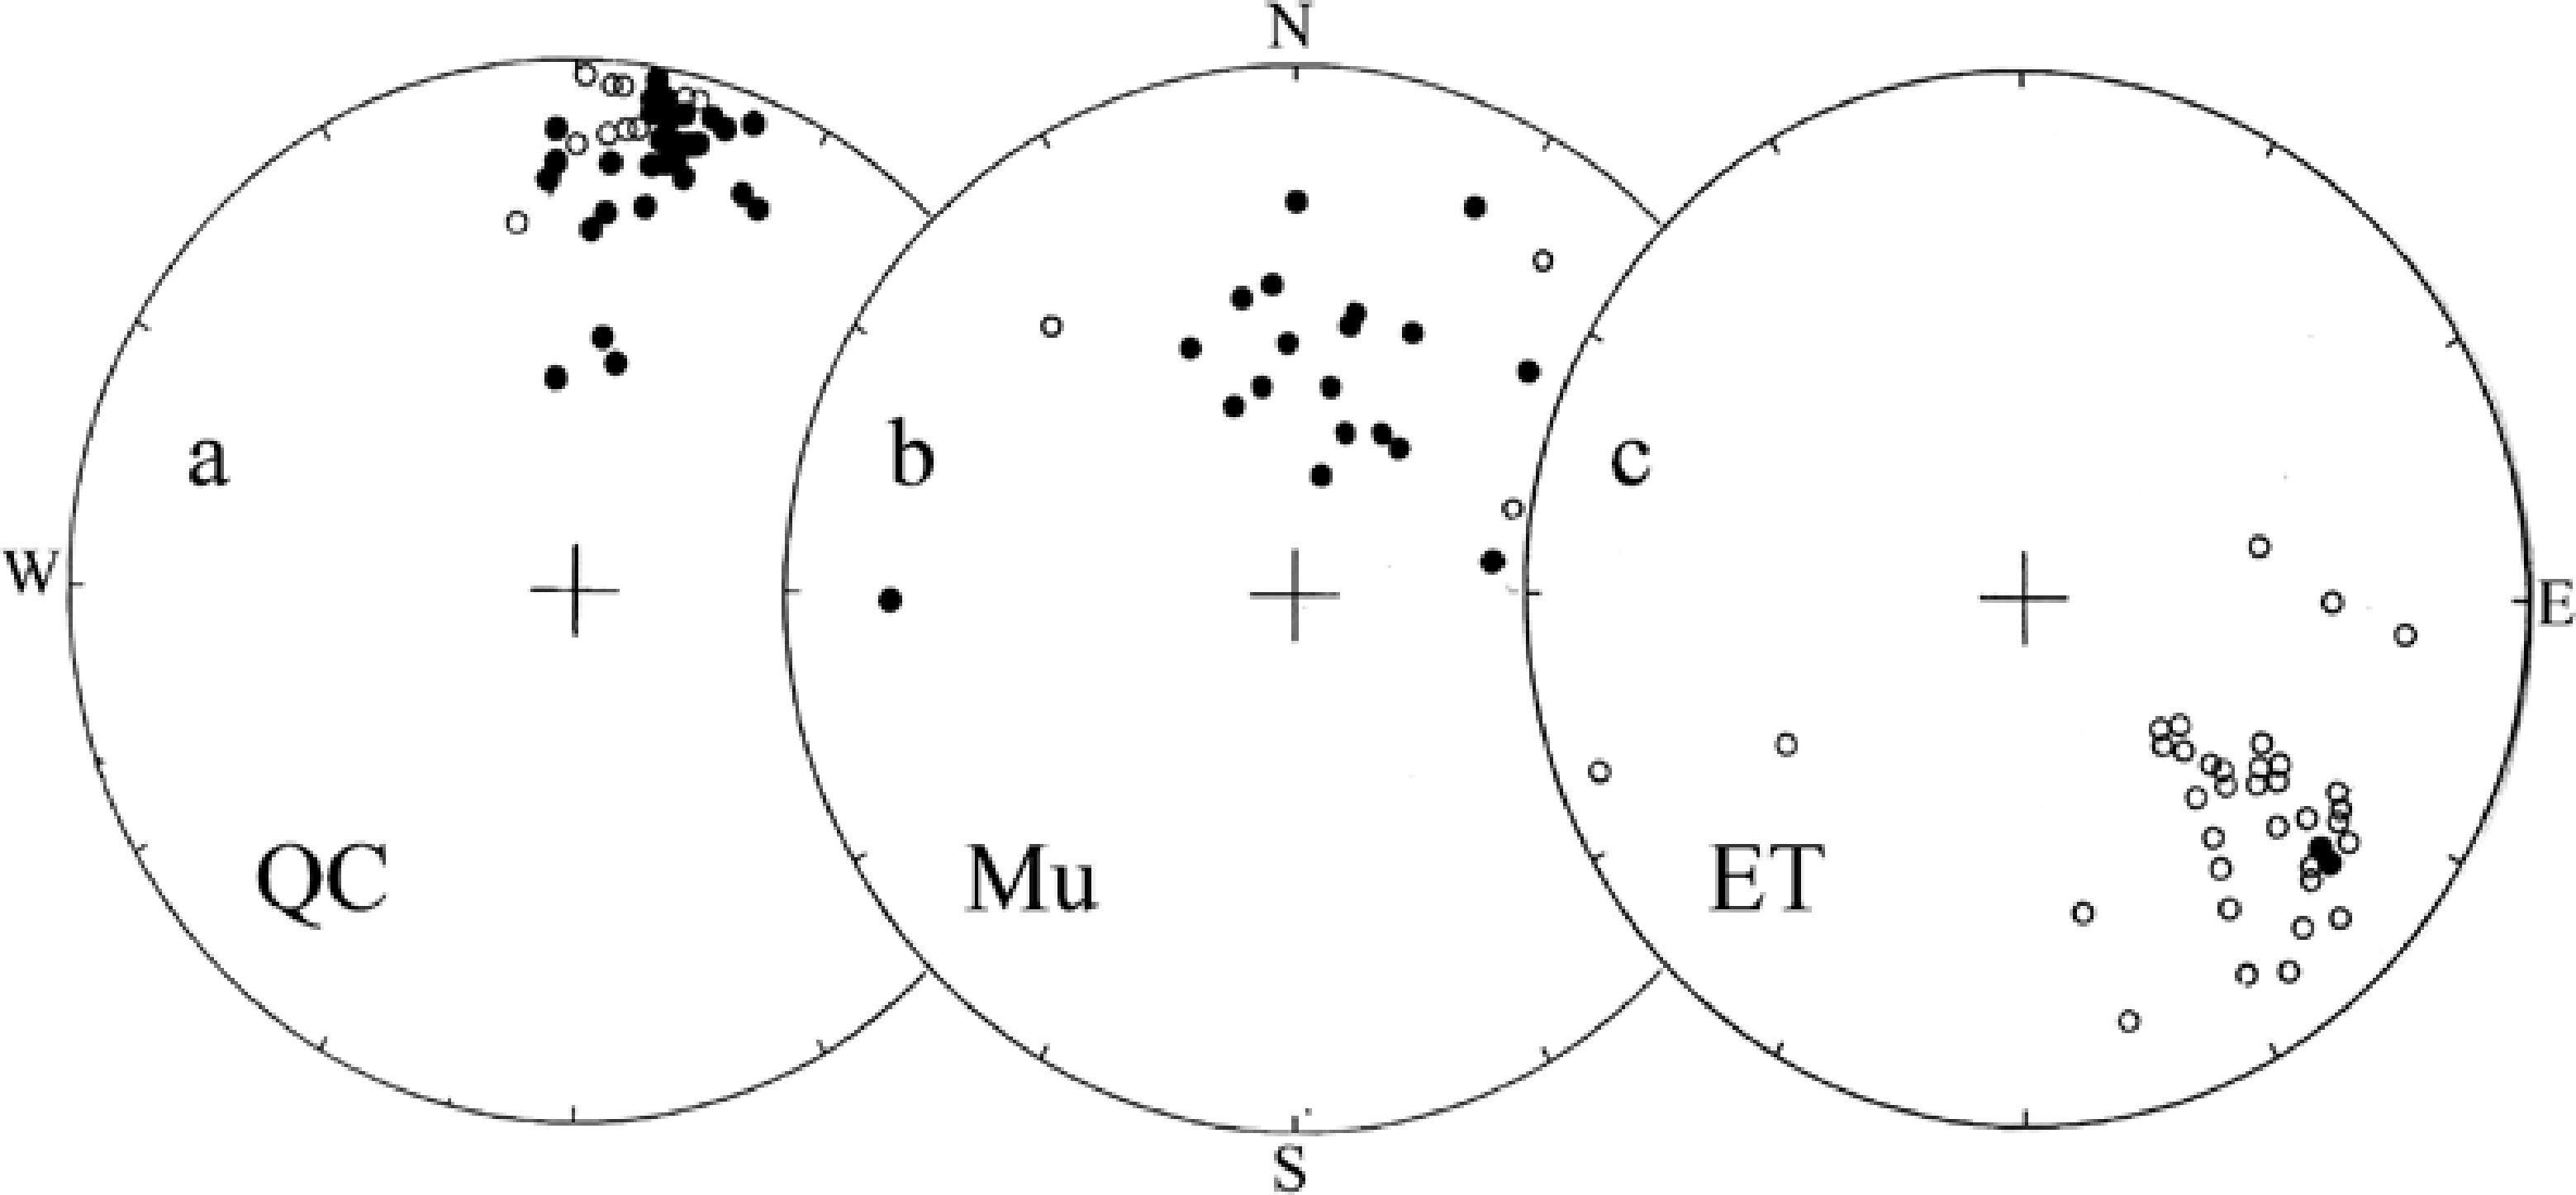
Figure 6 Stereoplots showing the directional data with field correction from QC (a), Mu (b) and ET (c). Solid and open circles represent positive and negative values, respectively).
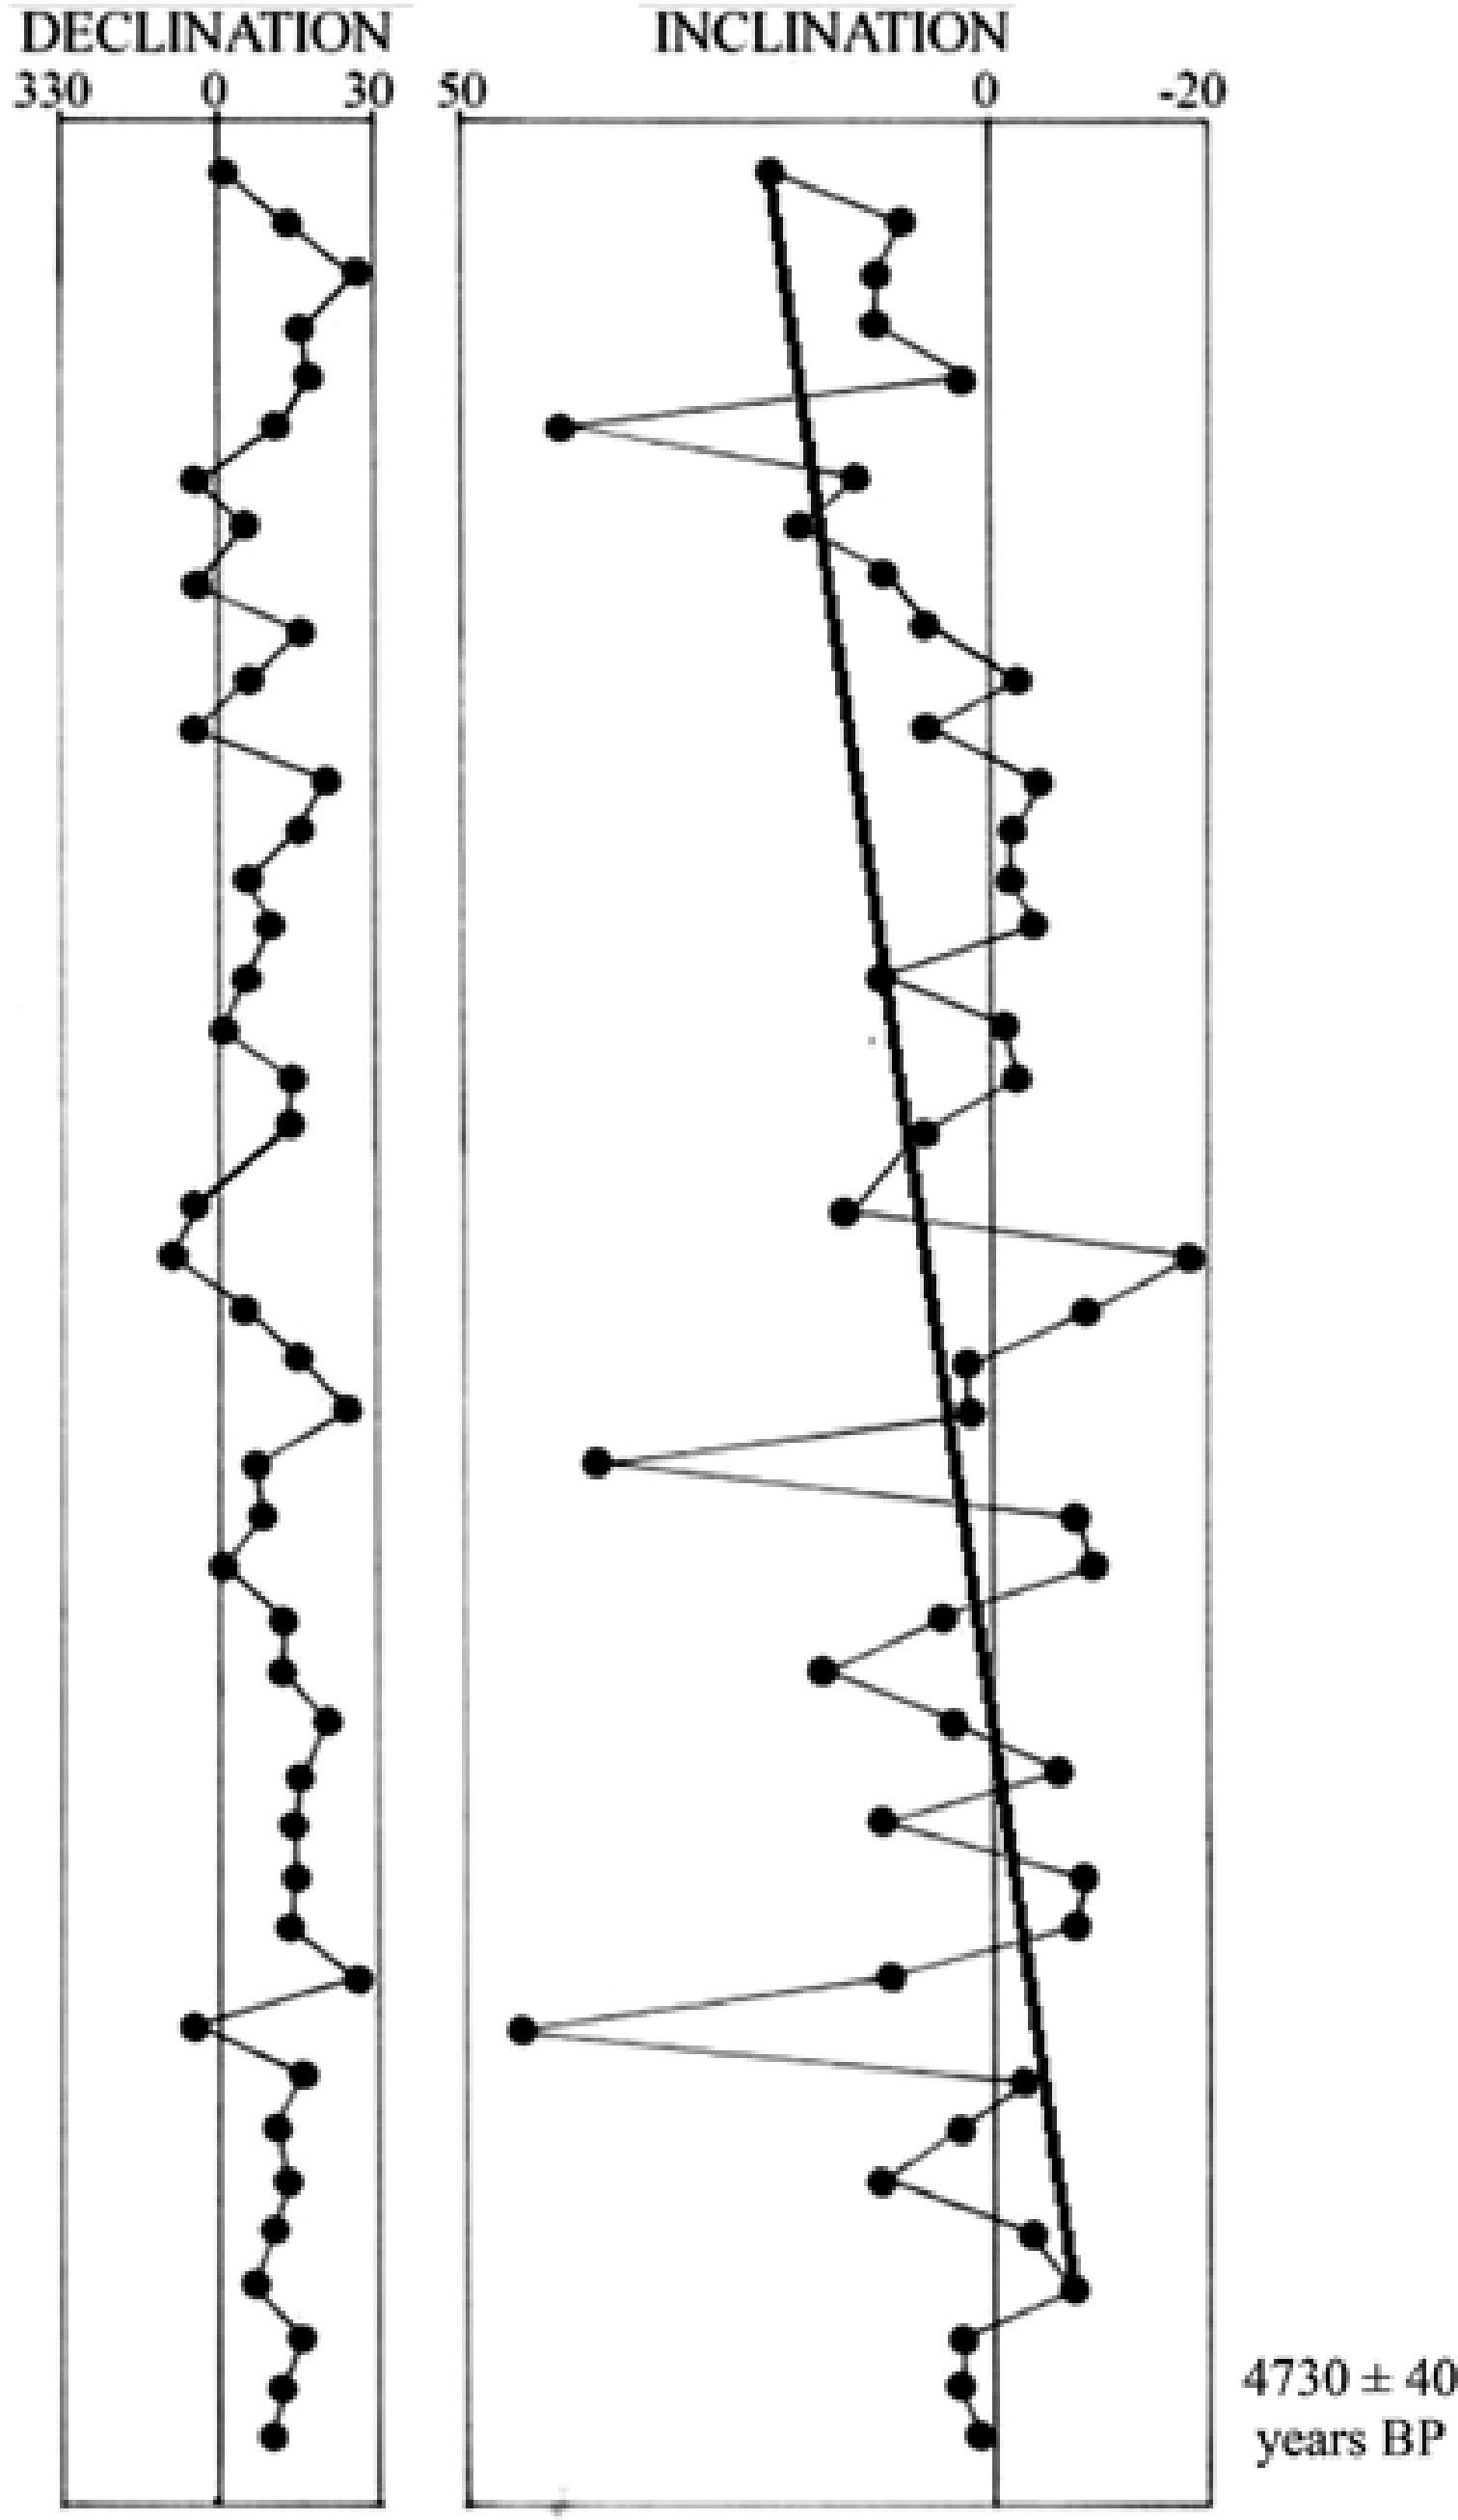
Figure 7 Declination and inclination logs from QC. The line in the inclination shows the decreasing trend from ∼-10° at the lower part to ∼20° at the upper part.
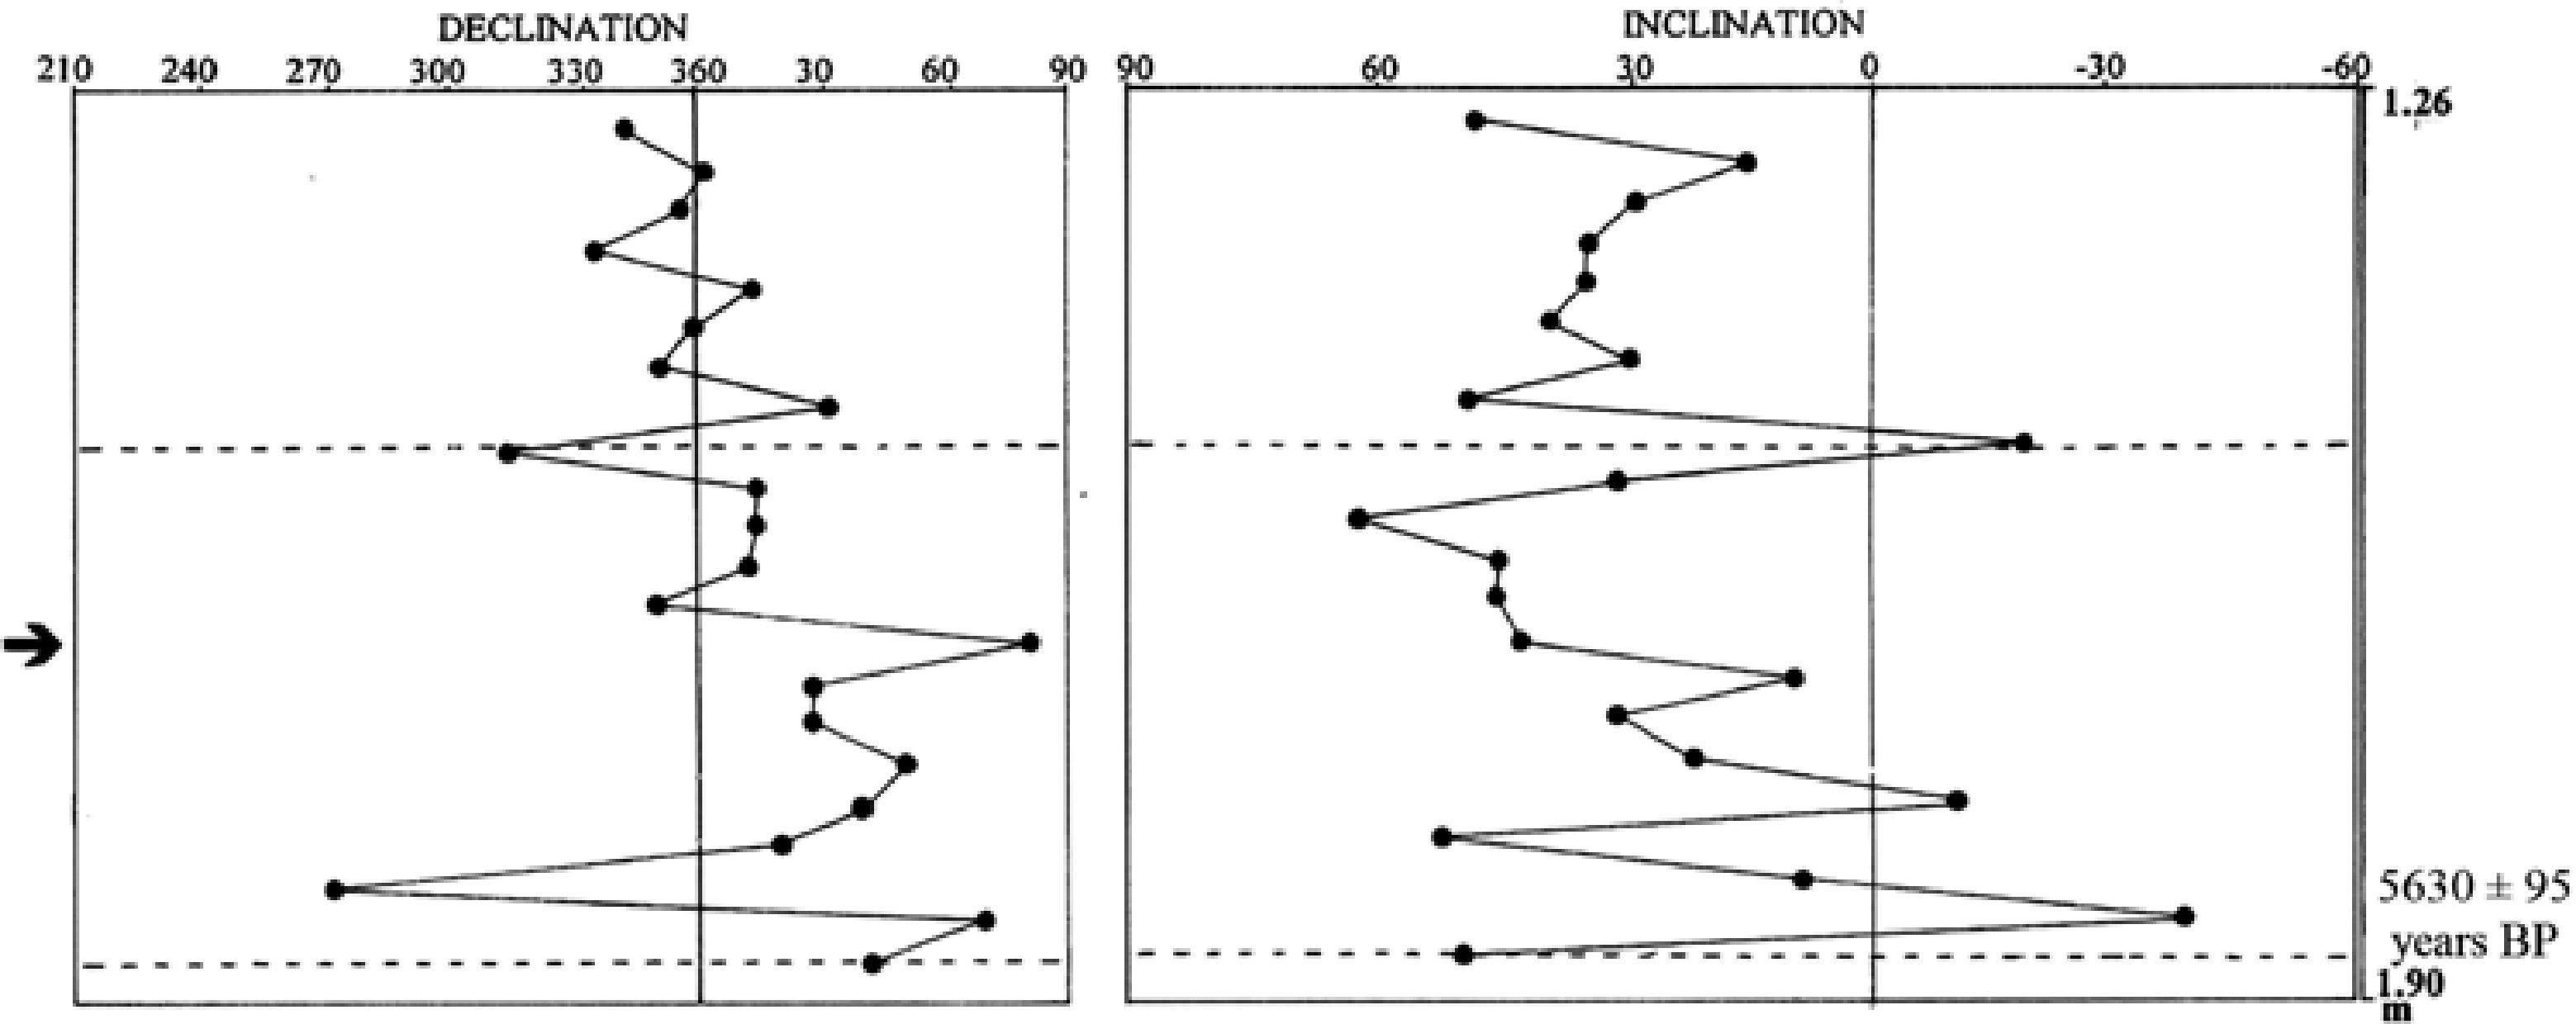
Figure 8 Stratigraphic plots of the declination and inclination profiles from Mu. The more conspicuous long direction and inclination departures are depicted between dashed lines and pointed with an arrow.
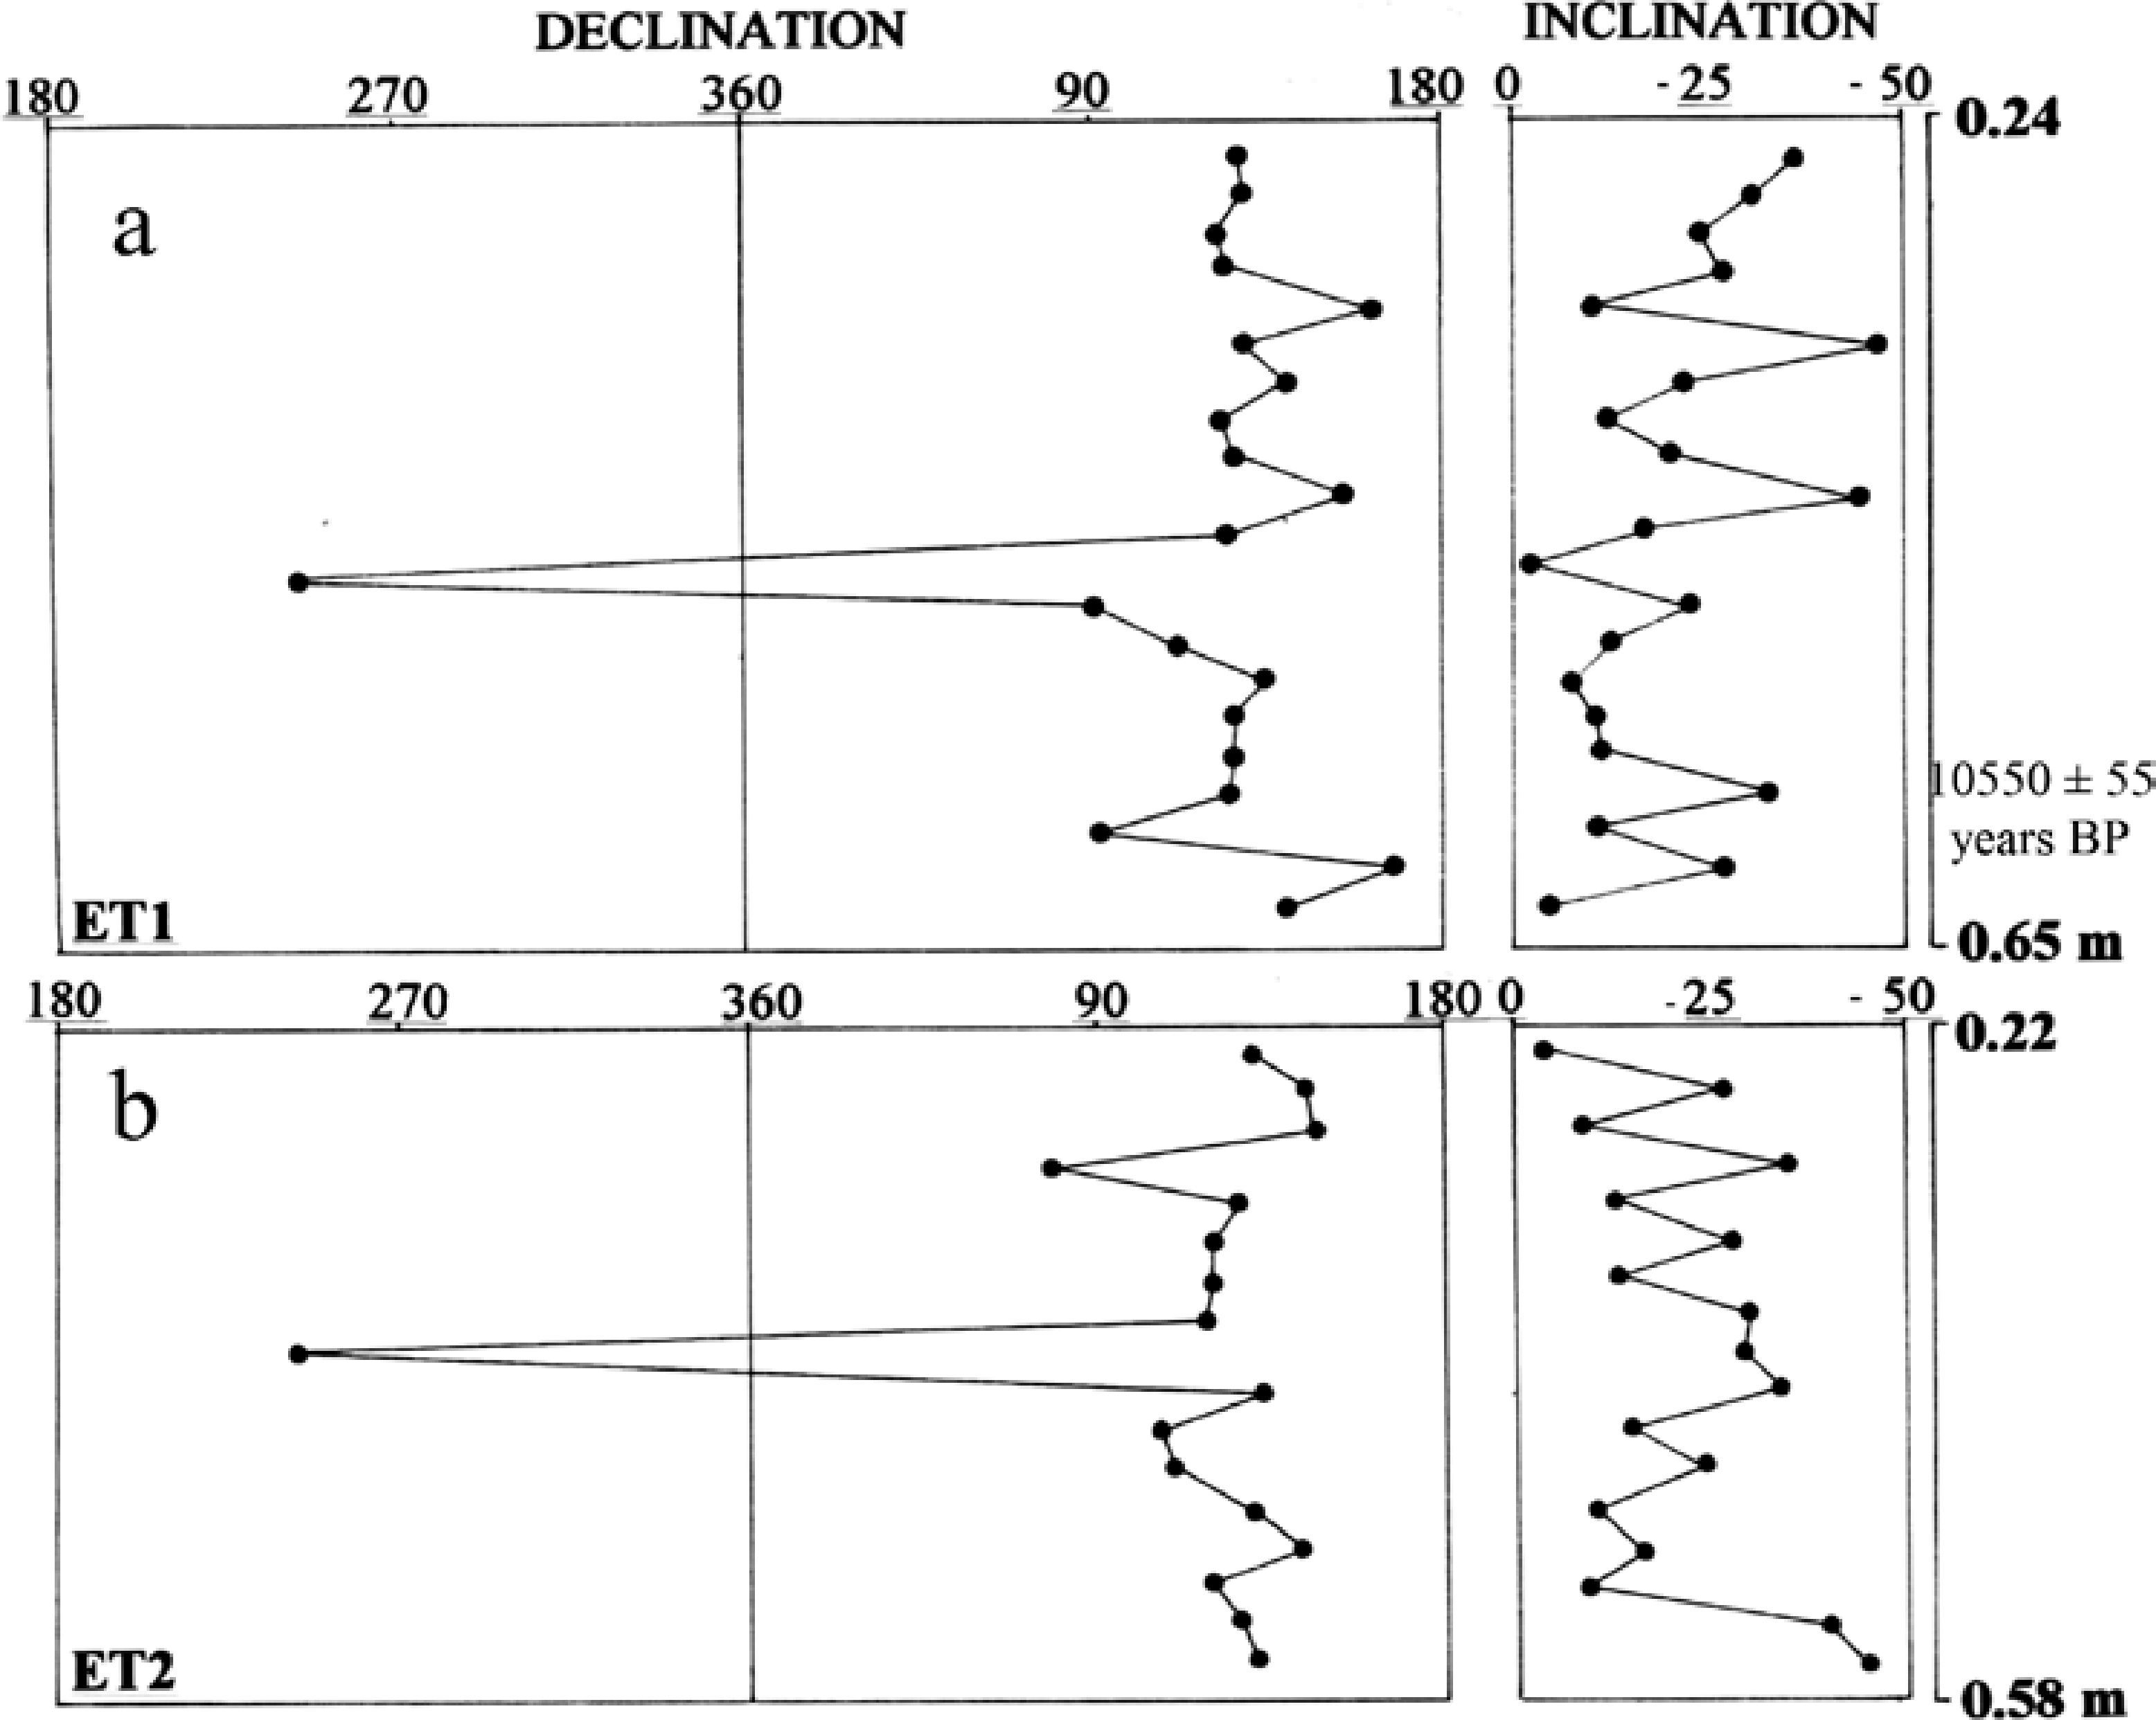
Figure 9 Stratigraphic presentation of the declination and inclination profiles from ET sites. a) ET1, b) ET2.
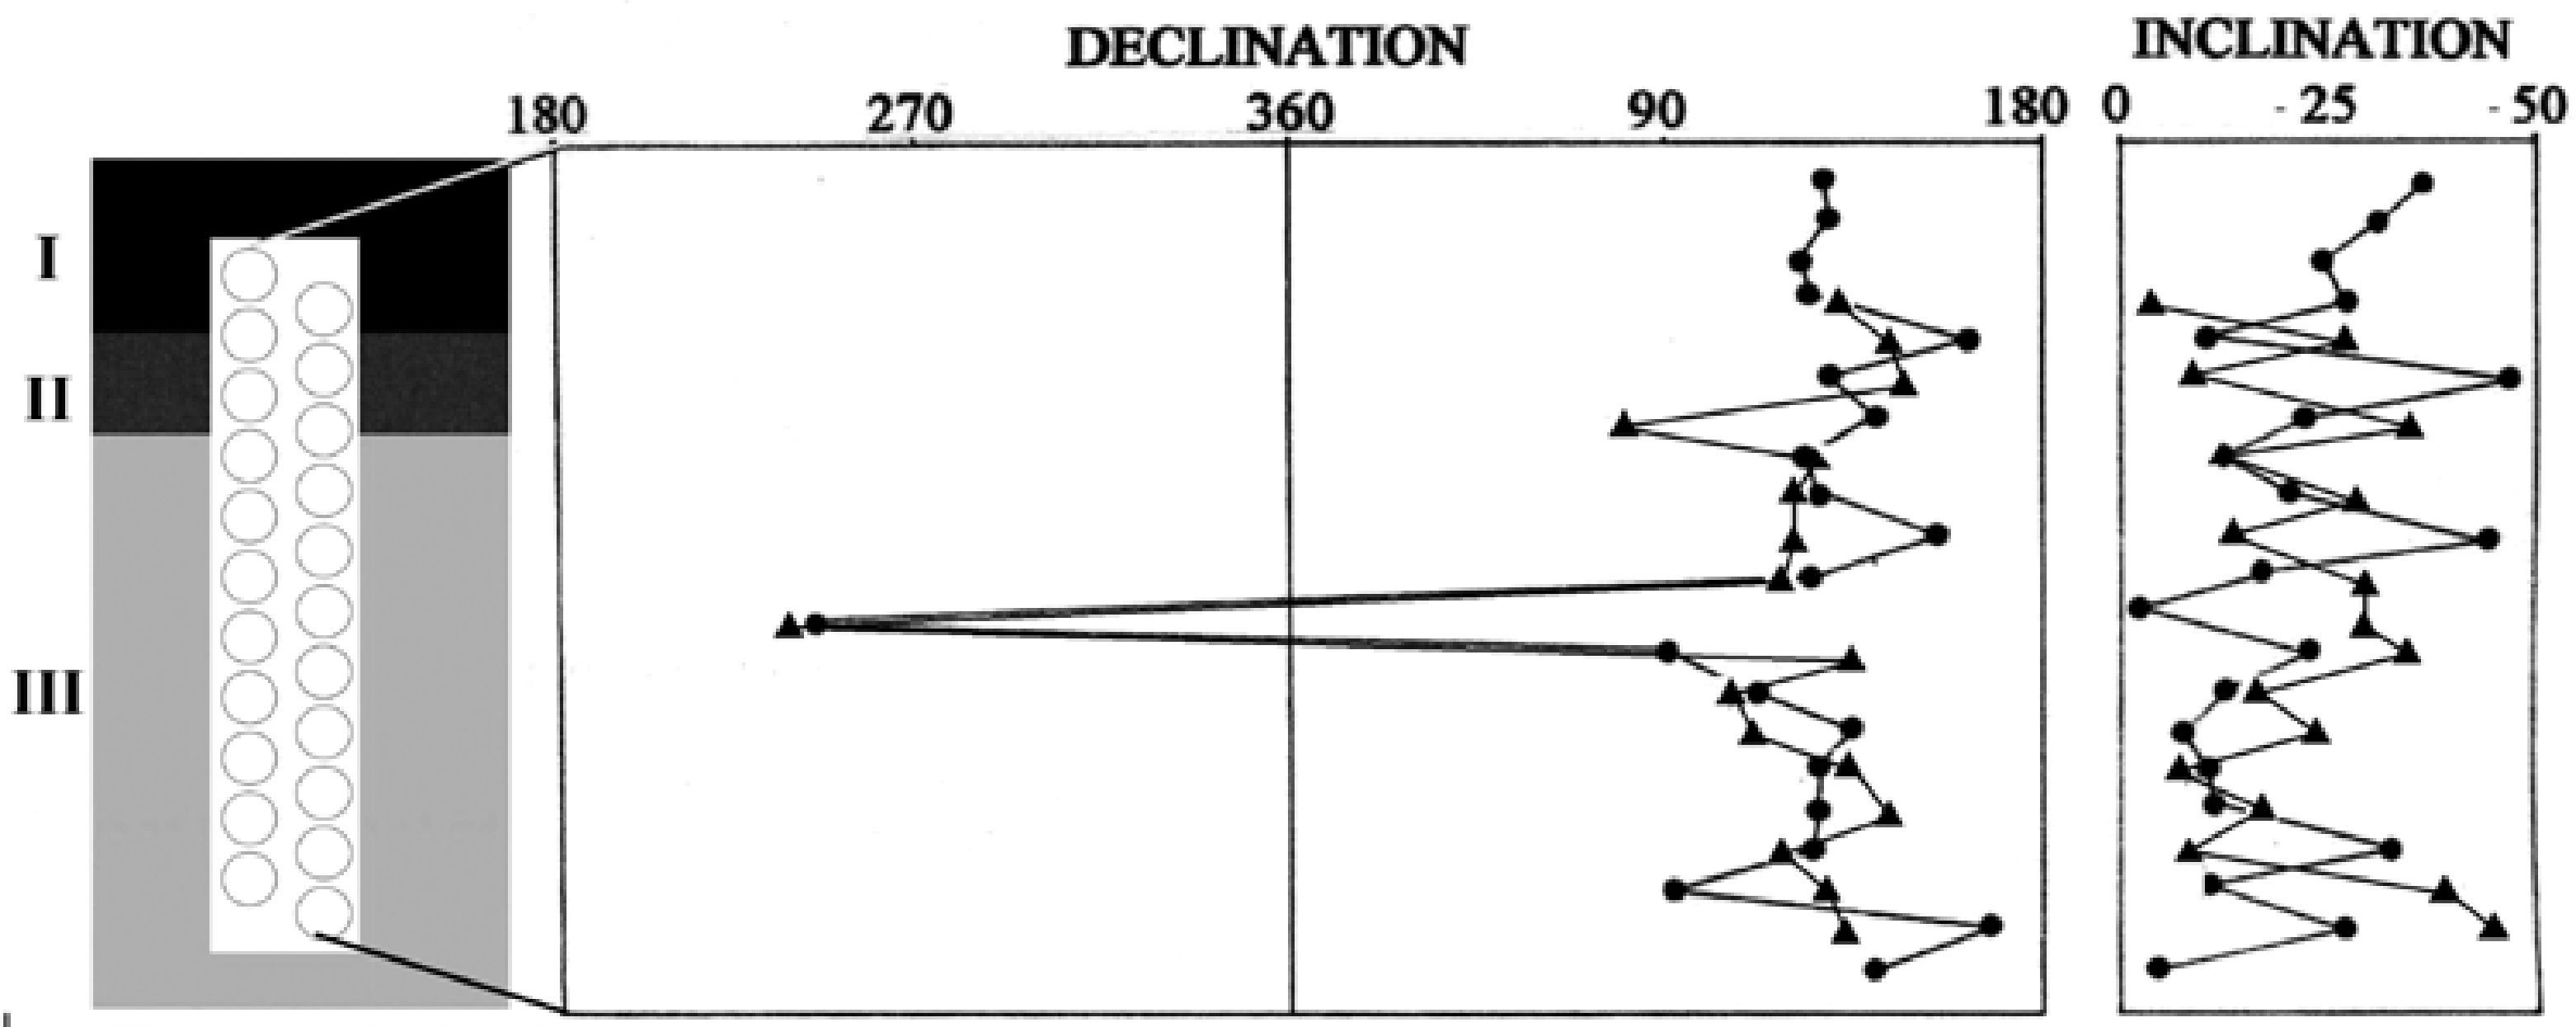
Figure 10 Overlapped stratigraphic display of ET1 and ET2 logs respectively represented by solid circles and triangles related with the direct absolute date by 14C. Roman numbers to the left indicates the geological layers.
Figure 11 depicts the stereoplots of virtual geomagnetic pole (VGP) positions calculated from the directions isolated of each section. When plotted in a present world map, VGPs calculated from normal samples at QC are very well clustered in Northern North America, Greenland and Northern Europe (Figure 12a); most VGP's calculated from Mu are situated between 30° and 60° northern latitude in Northern North America, Greenland, western Europe, Africa and North Pacific Ocean (Figure 12b). Interestingly, the majority of the reverse directions from ET conforms a patch located in southern Africa, and finally, a few ones are situated in central Africa, eastern Australia and Antarctica (Figure 12c- d ). Figure 12e illustrate the totality of VGPs calculated from the Ecuadorian sites presented in this paper, positions that agree well with VGPs observed in previous paleomagnetic studies performed on sections of similar age from Argentina and Chile (Nami, 1995, 1999a, 2012, 2013). Finally, VGPs sited on South America also occurred in other paleomagnetic records of comparable age. In northern Europe, several varved cores from Björkeröds Mosse lake exhibit low latitude VGPs located in western Africa during the Pleistocene/Holocene boundary (Mörner, 1977: 422). Their distribution shows strong similarities with the VGPs calculated for the Laschamp and Iceland basin excursions, dated at ∼40 ka and ∼180-220 ka respectively (Laj and Channel, 2007: Figures 5 and 8 ).
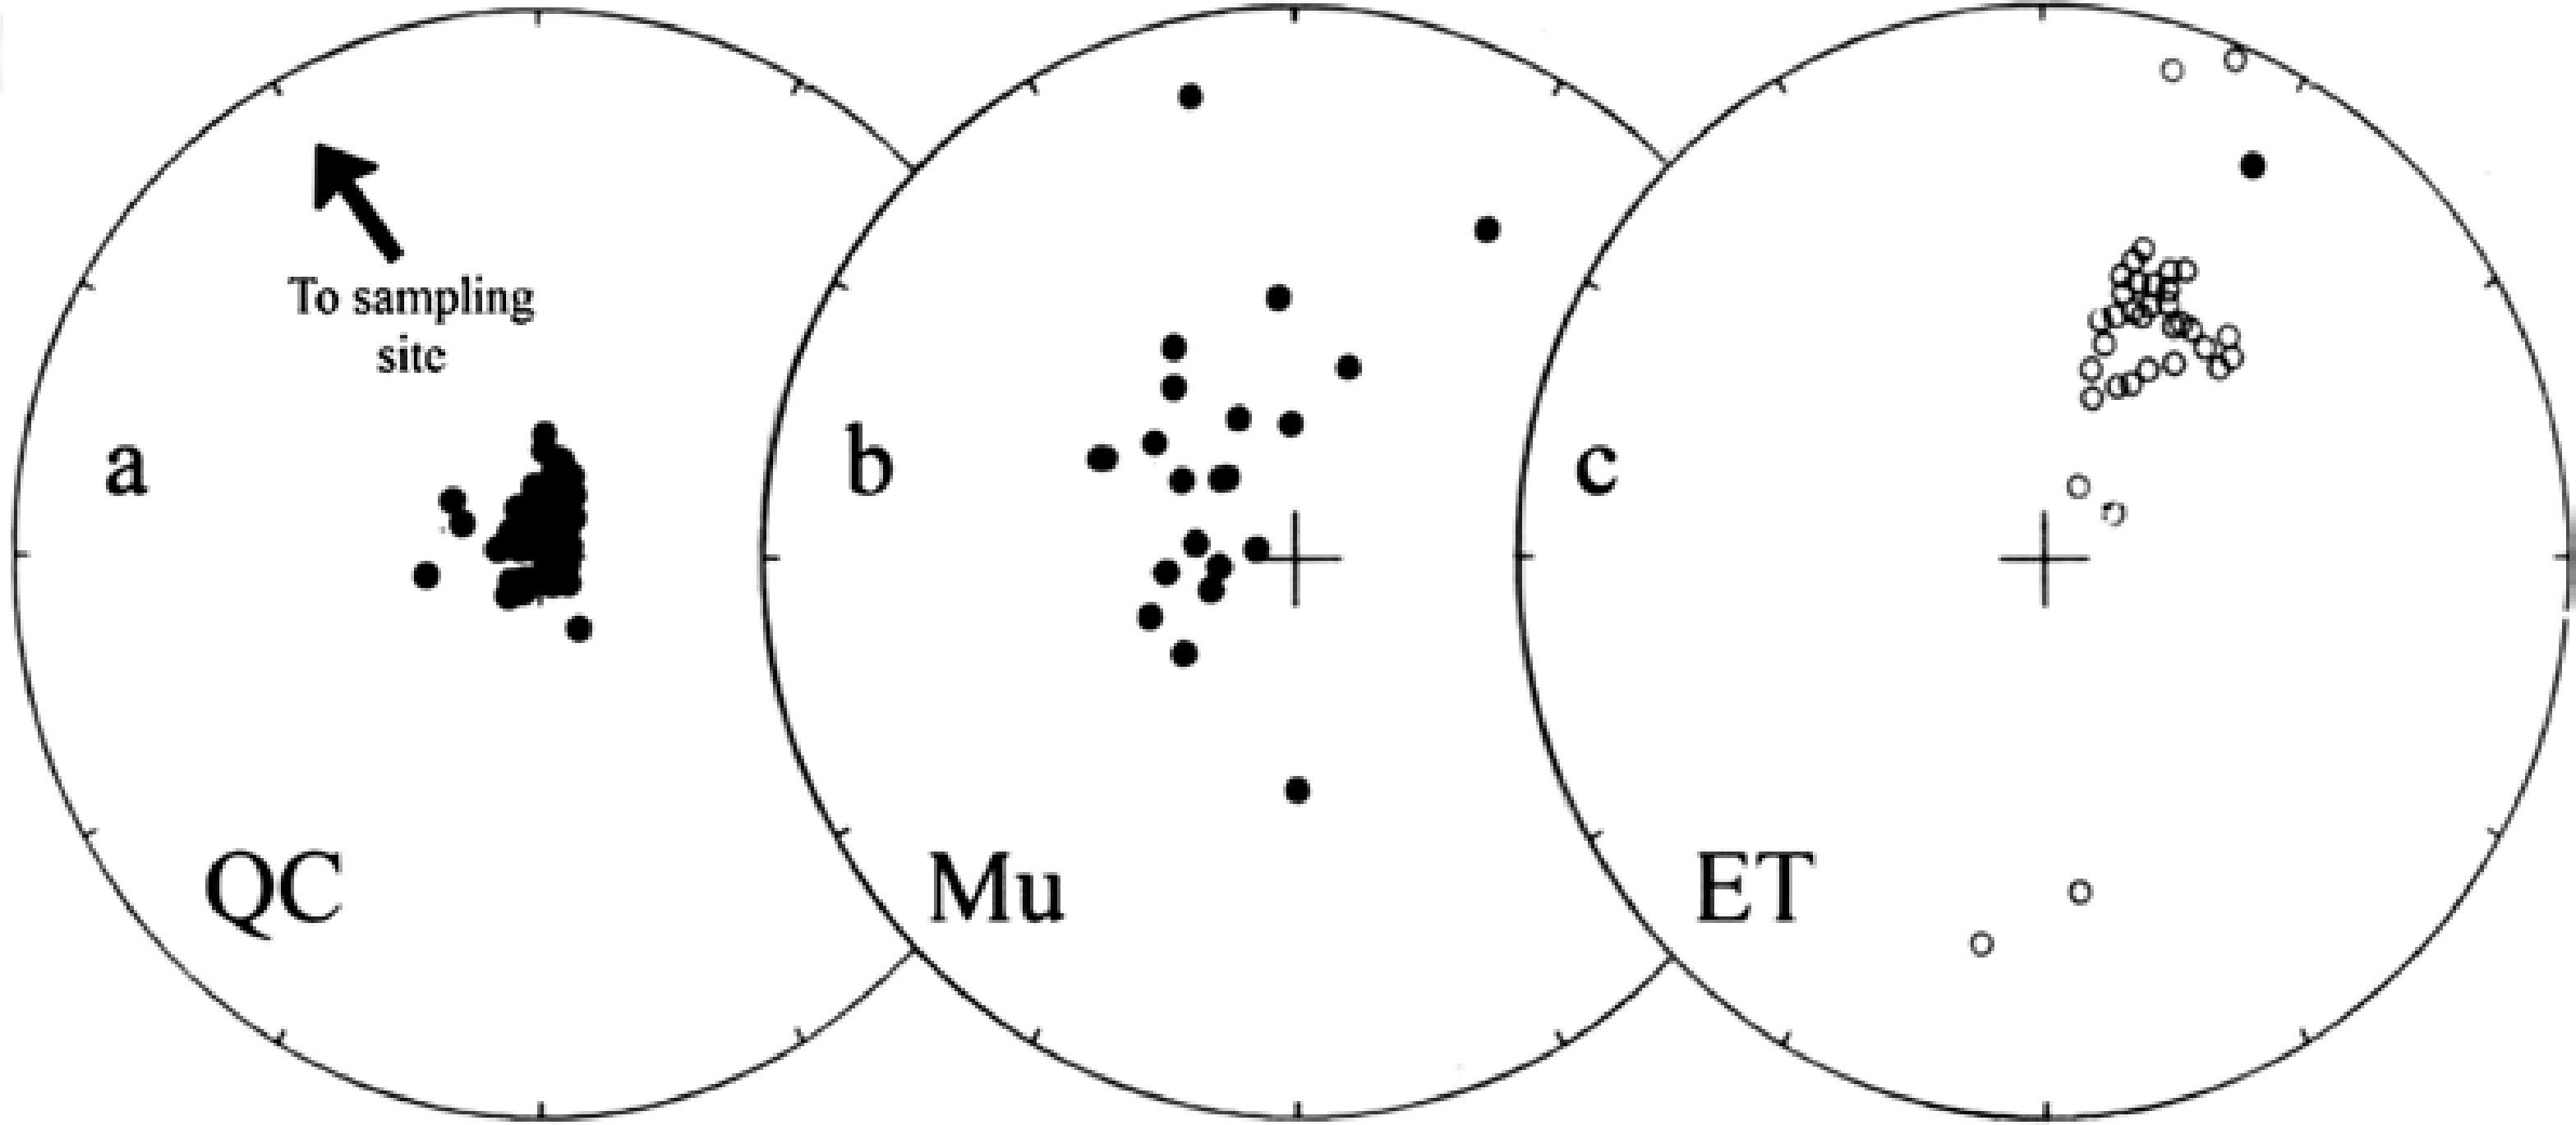
Figure 11 Stereographic projection of VGP calculated from directions of ChRM calculated from the sites mentioned in the text. Solid circles show those ones located in the Northern Hemisphere. The center of the projection is the geographic Southern Pole.
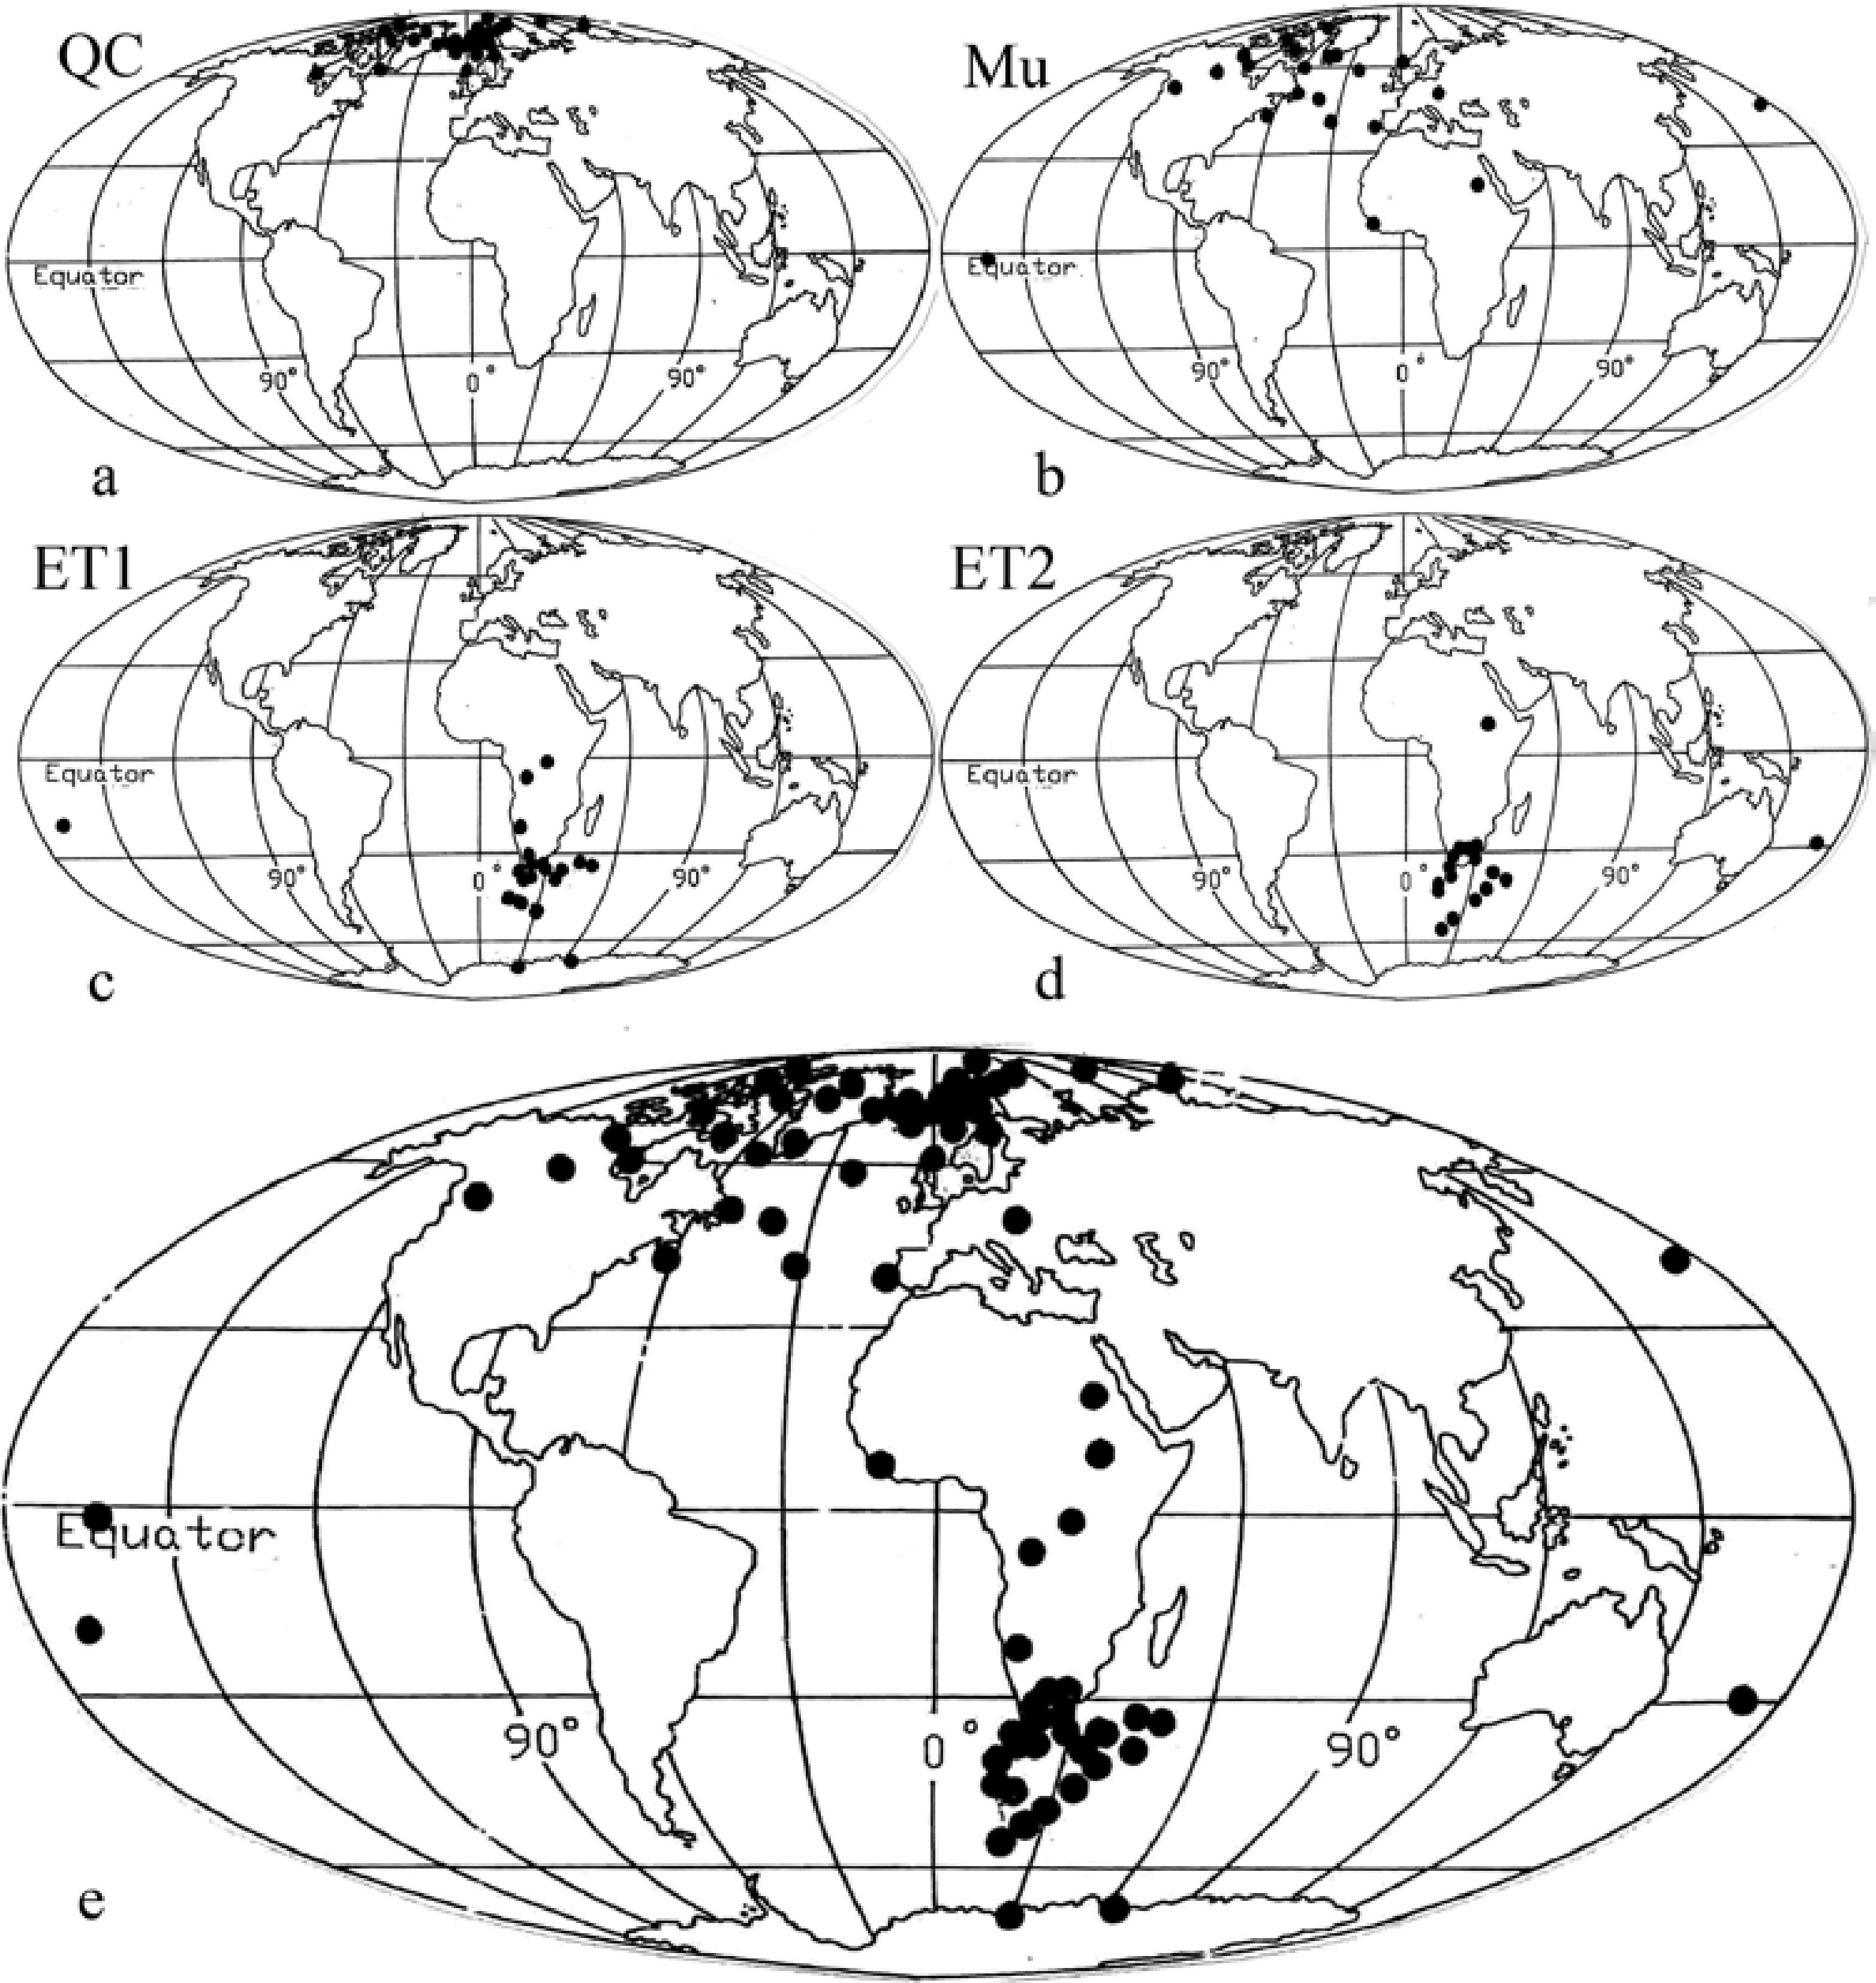
Figure 12 World map showing the location of the VGP obtained from the sites described in this paper (a-d) and the totality of VGPs from the Ecuadorian sites (e).
Finally, a mean geomagnetic pole called Ecu was calculated from QC and Mu, the sites with normal and intermediate directions. They were computed from all VGP's located within 40° window around the mean geomagnetic pole (cf. McElhinny et al. , 1974). Additional palaeopoles for the sites from North and southern South America was also determined. On of them, named "Eastern Argentina" (EA) was computed using poles from 6 localities situated in northeastern Argentina where transitional VGPs were computed (Nami, 1999a, 2006, 2012). Another paleopole was calculated from the Red Rock sites from California, Southwestern North America, where anomalous GMF directions were also recorded (Nami, 1999b). The totality of calculated paleopoles are depicted in Table 2. Finally, it was also used the previously published paleopole determined with the sites where the Mylodon excursion was computed ([ME= 336.7° W. Long., 68.65°S. La. with (A95) 8.2°], Nami, 1999a). As observed in figure 13, they agree well, and as previously informed (Nami, 1999a, 2006, 2011; Mena and Nami, 2002), they do not agree with the geographical pole and shows ∼15° angular difference in relation to the rotation's axis of the Earth. This suggest that a time span of 10.0/11.0 ka is insufficient to average out geomagnetic secular variation ([PSV], Hyodo et al. , 1993: 692; Nami, 1999a, 2006; Mena and Nami, 2002).
Table 2 Late Pleistocene/Holocene geomagnetic poles from Ecuador, northeastern Argentina and Red Rock locality in western North America calculated within 40° around the mean. References: n= number of samples, A95: semi-angle of cone 95% confidence, K: precision parameter (Fisher, 1953); r: resultant vector.
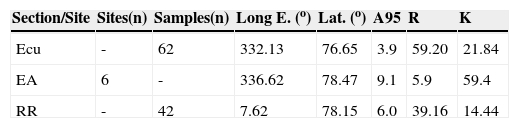
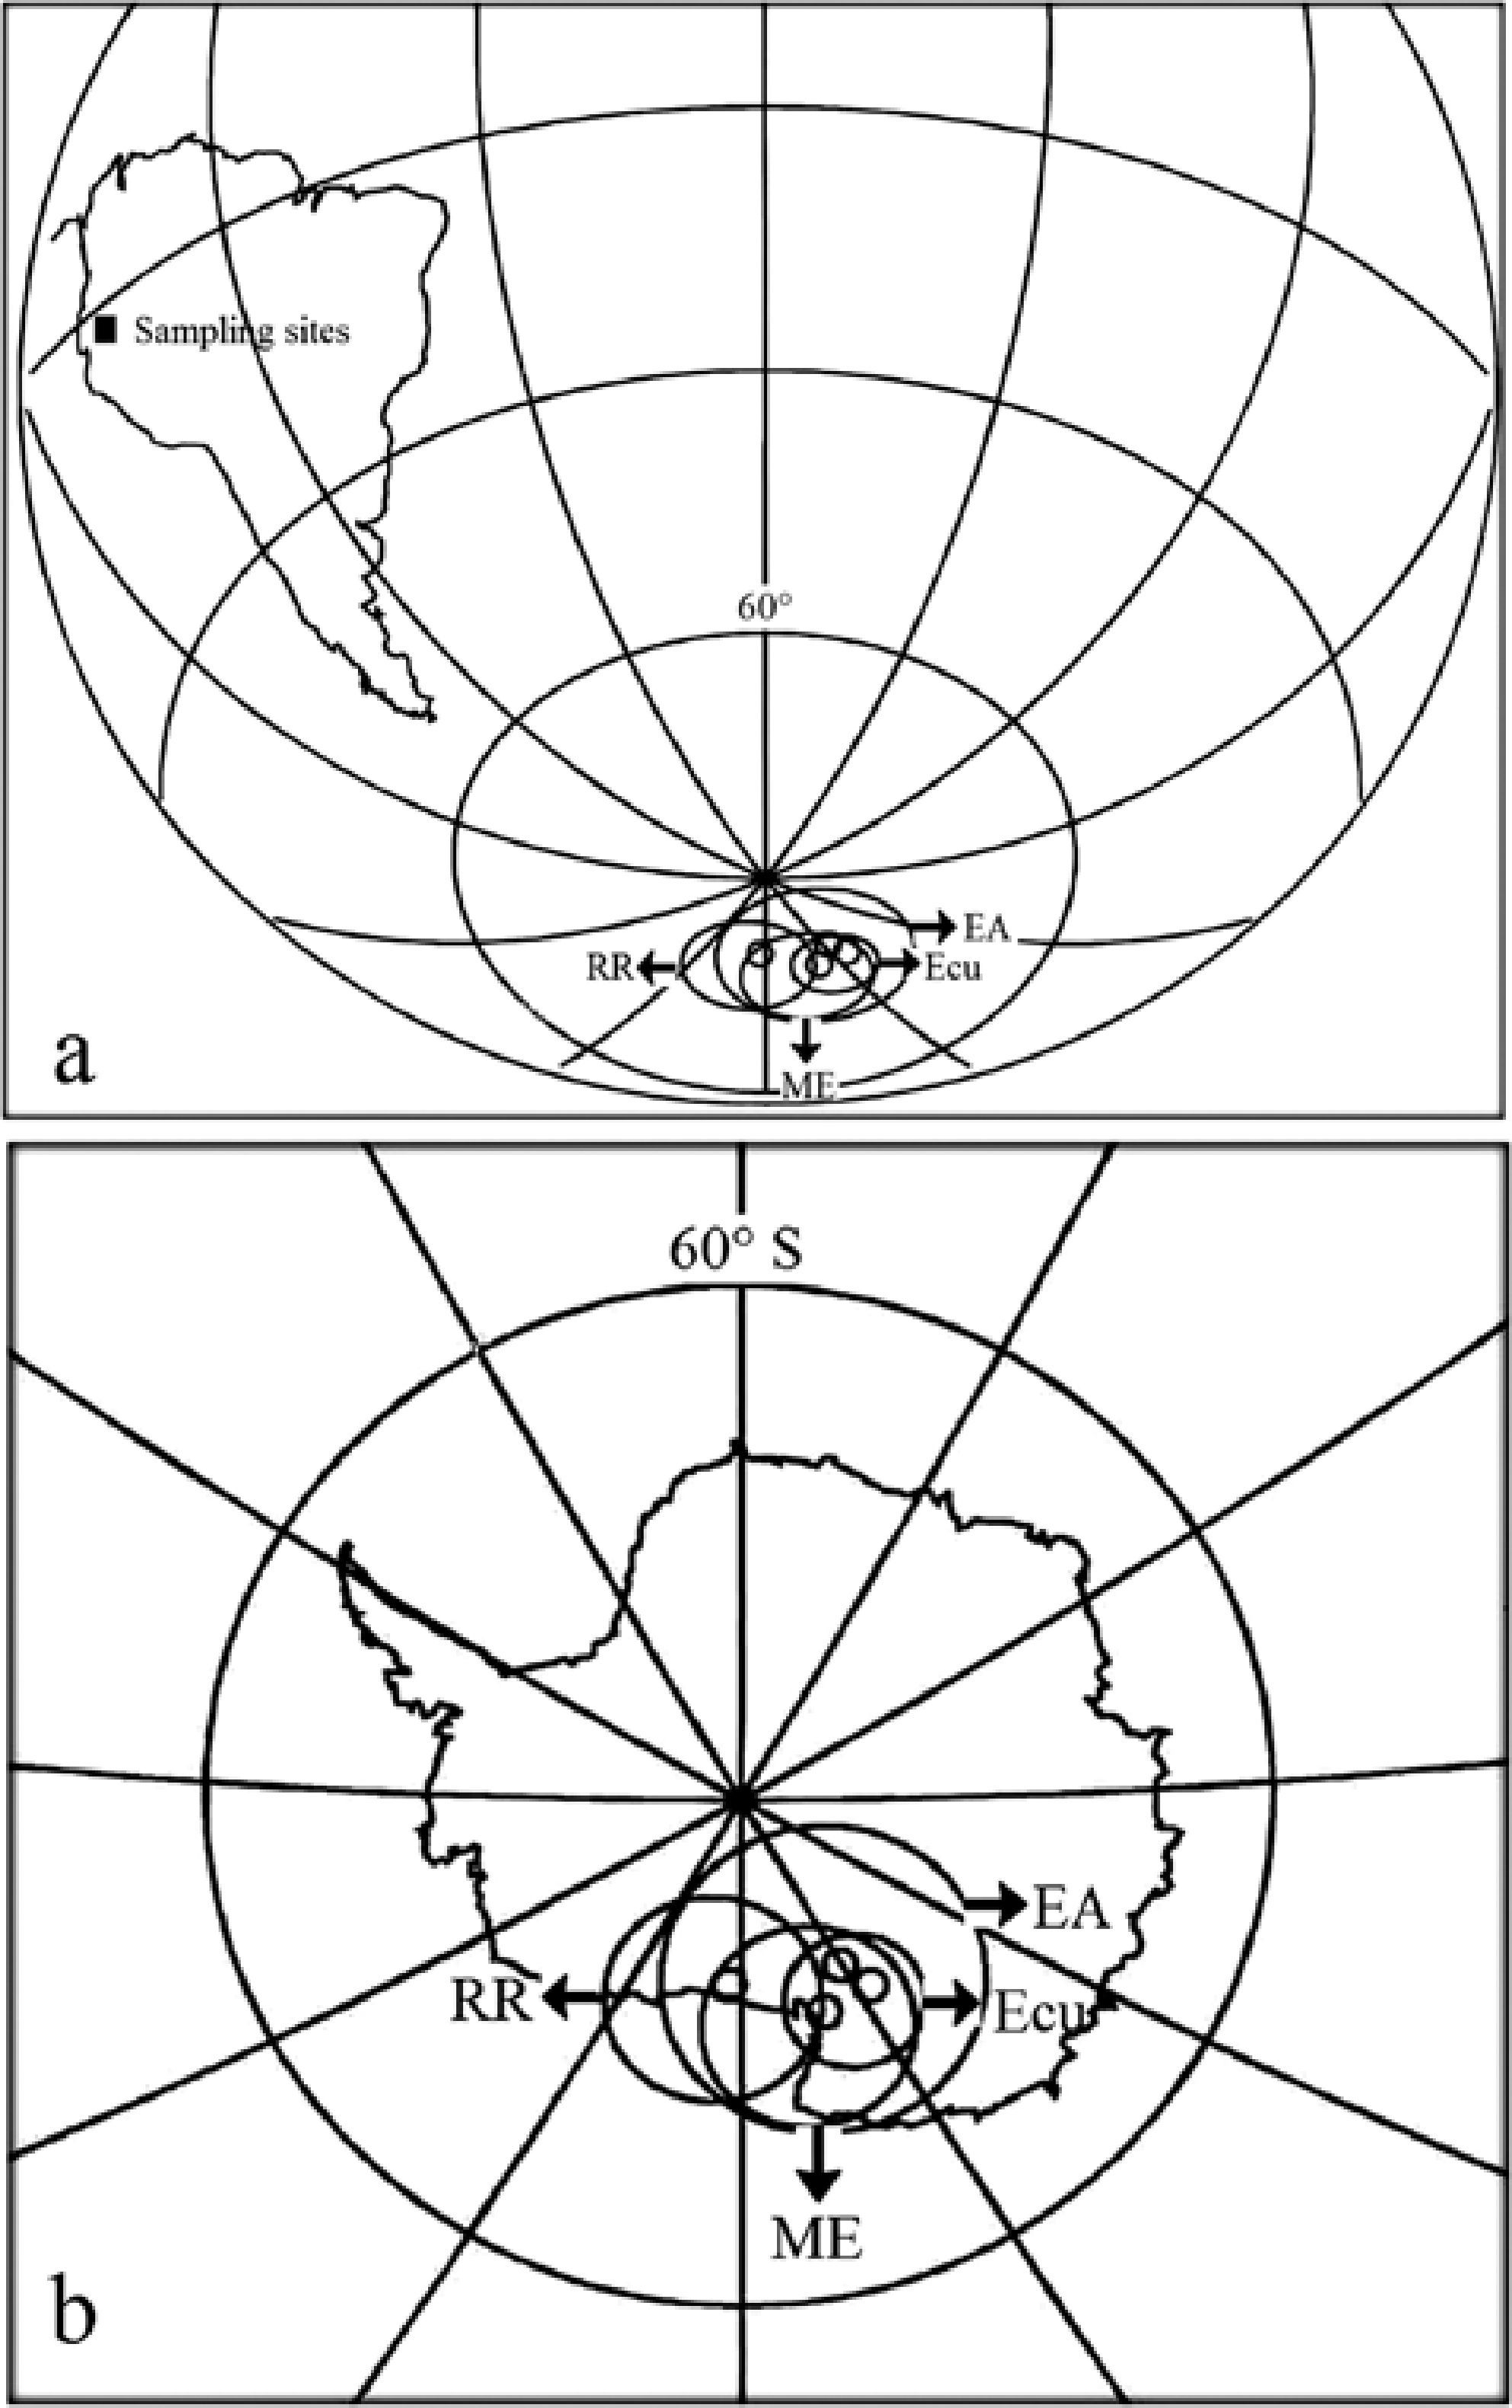
Figure 13 Projection showing the paleopole (Ecu) obtained with 40o filter and their confidence interval in relation with the paleopole obtained for the other sites with anomalous GMF directions from Northeastern Argentina (EA), North America (RR) and South America (ME) in relation with the sampling site (a) and the Antarctic continent (b).
Discussion
New data obtained in sediments from different environments and lithologies cored in Pichincha province in Ecuador have been found to contain records that showed normal and anomalous GMF behavior. Normal directions were recorded in QC, while normal and intermediate polarity directions at Mu and, reverse VGPs at ET. QC and the upper portion of Mu correspond to the PSV Holocene record for Ecuador during the ∼≤4.7 ka BP; on the other hand, the lower portion of Mu logs represents the transition from normal to intermediate directions occurring at ∼≥5.6 ka BP. Finally, sites from ET recorded two stable oblique reverse records with a large fluctuation far from the present GMF at ∼10.5 ka BP. The core from ET3 with normal direction might be consistent with the Brunhes chron normal polarity, suggesting that this part of the section may have <700 ka (Hailwood, 1989) and the Pleistocene age of the deposit. Then, if the records presented here are not sediment artifacts (Langereis et al. , 1992; Quideller and Valet, 1994), ET corresponds to a PSV record that occurred during the reverse polarity position prevailed at Ecuador during the Pleistocene-Holocene transition at ∼10.5 ka BP. Mu sampling interval which is different to QC, might explain in part differences between magnetograms. Actually, the declination log at Mu shows a difference of 90° and a larger fluctuation of ∼100o in inclination. Also some VGPs from Mu and the totality of ET differ by more than 40-45° away from the geographic pole during normal or reverse polarity, signifying that they might be consider as a major deviation in GMF behavior over a relatively short period of geologic time (e.g., Wilson et al ., 1972; Cox, 1975; Barbetti and McElhinny, 1976; Verosub and Banerjee, 1977; Merrill and McElhinny, 1983; Thouveny and Creer, 1992; Jacobs, 1994; Merrill and Mc Fadden, 1994; Laj and Channel, 2007; Valet, 2008; Watkins, 1976). Hence, the anomalous directional data observed at Mu and ET, probably corresponds to different field excursions likely occurred at ∼5.0 and ∼10.0 ka BP. Actually, large amplitude fluctuations with reverse and intermediate polarities were observed across the Americas during the middle Holocene at ∼≤4-5-5.5 ka BP in lava flows and sediments from diverse environments in Mexico and the Red Rock locality, California, USA (Gonzalez et al. , 1997, Urrutia-Fucugauchi et al ., 1995, Nami, 1999b); in southern South America a number of well date locales yielded records with intermediate and reverse directions, mainly at La Serranita site in northeastern Patagonia, Argentina directly dated at 5300 ± 40 yr. BP (Nami, 2012, 2013). At the same time and in other parts of the world, large departures of the GMF were observed in Chinese fresh-water sediments from Beijing that occurred between 5060 and 4860±90 yr. B.P (Zhu et al ., 1998), several cores from the Barents sea yielded records of the Solovki excursion dated at 4.5-7.5 ka BP (Guskova et al. , 2008).
During the terminal Pleistocene and its transition to the Holocene other anomalous directions were recorded in several sites and localities across the world (Table 3). In other areas of South America in Southern Chile, Mylodon cave yielded a stable record with intermediate and reverse directions registered at sediments consistently dated at ∼11.0-10.0 and ∼5.0 ka BP (Nami, 1995). Furthermore, similar directions were recorded at Las Buitreras, Alero de las Circunferencias, and Barrancas de Maipú in Chile and Argentina (Nami, 1999a; Moreiras et al. , 2013). In North America, the Grandfather Lake in Alaska, yielded records with an excursion dated at the terminal Pleistocene and early Holocene dated between ∼9.7-11.7 ka BP or ∼11.8-13-6 Cal ka BP (Geiss and Banerjee, 2003); also, Creer and colleagues (1976) observed large GMF fluctuations at the Erieau Lake (Canada) in the time span under consideration. These anomalous directions might be contemporaneous to those excursions observed by Lund and associates (2008) at marine sediments of the Tahiti Coral Reef dated at 10.6 and 11.1 cal. ka BP and 12.6 and 13.2 cal. ka BP, other one observed at the South Pacific Ocean region at Tahiti, also dated a 12.5 cal. ka BP (Lund et al ., 2007) and, in West Coast South Island, New Zealand (Nelson et al. , 2009). Also, during the last millennium of the Pleistocene a number of PSV records in the northern Hemisphere, showed that despite the inclinations has the expected positive values, large amplitude swings in declination were recorded in Scandinavia and northern Russia (Backmutov, 1997; Backmutov et al. , 1994; Saarnisto and Sarinen, 2001).
Table 3 List of well dated records with anomalous GMF directions occurred during the last millennium of the Pleistocene and Pleistocene-Holocene transition. References: †: no given. To unify the results, all the available dates were calibrated using the “Calib radiocarbon calibration program” (Stuiver and Reimer, 1993) and the calibration data set assembled by Reimer and colleagues (2013). Calibrated ages are reported with 95.4% (2σ) cal age ranges.
Conclusions
The aforementioned anomalous GMF behavior occurred during the Pleistocene-Holocene transition and middle Holocene supports the hypothesis of the global excursional state of the GMF with not coetaneous intermediate and reverse directions during the last ∼11.0 ka BP (Nami, 1999b, 2012, 2013). Hence, it might be expected that the Holocene GMF might have had a peculiar behavior with normal, intermediate and/or reverse polarity positions at the same time in different regions. In this sense, remarkably is the GMF model proposed by Brown and colleagues (2007) to explore the possible influence of the time-varying nondipole components during reversals and excursions. With that aim, they varied the magnitude of the axial dipole component in the model CALS7K.2 constructed by using paleomagnetic and arqueomagnetic data of the last 7.0 ka BP (Korte and Constable, 2005). Resulting from their analysis, the authors suggest that non-dipole components could add significant structure to the GMF during the processes occurred in reversals and excursions which, in the latter, are neither global in extent nor synchronous in occurrence. Surpringly, VGPs locations derived from the Brown and colleagues (2007: Figure 5) model agrees fairly well with the VGPs distribution observed in the likely excursions occurred during the last 11.0 ka BP at about 2.5, 5.0 and 10.0 ka BP (Nami, 1995, 1999a, 2012, 2013). Remarkably, the presence of VGP across Africa is coincident with the theoretical model developed by Gubbins (1987, 1994), who pointed out that beneath the South Atlantic Ocean, there is a "reverse flux" patch which is a source of magnetic anomalies, particularly in Africa (Bloxham and Gubbins, 1985, Bloxham, 1995). Therefore, if the paleomagnetic records informed in this paper truly reflect the GMF behavior, they might be related with these anomalies.
Finally, if the anomalous GMF behavior observed at ∼10.5 ka BP represents a true excursion, it will become an excellent magnetostratigraphic marker for the Pleistocene-Holocene transition in certain parts of the world. In fact, as a dating tool, the excursion recorded at ET may be considered highly useful for dating materials and events formed and occurred during the Pleistocene-Holocene transition in the area surrounding the Ilaló hill in Ecuador. Repetition of denser sampling and supplementary precise dating is needed in order to gain a more detailed knowledge of the GMF behavior during the last 11.0 ka BP.